
Abstract
Purpose
COPD is a heterogeneous disease, and the available prognostic indexes are therefore limited. This study aimed to identify the factors associated with acute exacerbation leading to hospitalization.
Patients and methods
This was a retrospective study of consecutive patients with COPD (meeting the Global Initiative for Chronic Obstructive Lung Disease [GOLD] diagnostic criteria) hospitalized at the Ninth Hospital of Xi’an Affiliated Hospital of Xi’an Jiaotong University between October 2014 and September 2016. During follow-up after first hospitalization, the patients who had been rehospitalized within 1 year for acute exacerbation were grouped into the frequent exacerbation (FE) group, while the others were grouped into the infrequent exacerbation (IE) group. The baseline demographic, clinical, laboratory, pulmonary function, and imaging data were compared between the two groups.
Results
Compared with the IE group, the FE group had lower forced expiratory volume in 1 second (FEV1)/forced vital capacity (FVC) (P=0.005), FEV1%pred (P=0.002), maximal mid-expiratory flow (MMEF25–75%pred) (P=0.003), and ratio of carbon monoxide diffusion capacity to alveolar ventilation (DLCO/VA) (P=0.03) and higher resonant frequency (Fres; P=0.04). According to generations of bronchi, the percentage of the wall area (%WA) of lobes was found to be higher in the FE group. Emphysema index (EI), mean emphysema density (MED)whole and MEDleft lung in the FE group were significantly worse than in the IE group (P<0.05). Using logistic regression, exacerbation hospitalizations in the past year (odds ratio [OR] 14.4, 95% CI 6.1–34.0, P<0.001) and EI >10% (OR 2.9, 95% CI 1.2–7.1, P=0.02) were independently associated with frequent acute exacerbation of COPD (AECOPD) hospitalization.
Conclusion
Exacerbation hospitalizations in the past year and imaging features of emphysema (EI) were independently associated with FE hospitalization.
Introduction
COPD is a serious chronic disease. Because of its diversity and heterogeneity, individualized assessment and management are needed.Citation1,Citation2 Frequent exacerbations (FEs) mean that the disease is progressing faster, increasing the risk of acute re-exacerbation and mortality.Citation1,Citation2 Therefore, the accurate prediction of recurrent COPD exacerbation has great significance to determine the progression and prognosis.
Most of the Chinese patients with COPD are at high risk of exacerbation, with a mean of two acute exacerbation events each year.Citation3 Another study showed that the annual number of exacerbation events in Chinese patients was about 0.5–3.5.Citation4 Before 2011, forced expiratory volume in 1 second (FEV1) was considered as a significant prognostic factor of COPD, and the frequency of acute exacerbation of COPD (AECOPD), hospitalization rate, and mortality of COPD were associated with altered lung function.Citation5 More recent studies showed that ≥2 events/year of AECOPDCitation1 or ≥1 event/year of AECOPD leading to hospitalizationCitation6 was the risk factor for future exacerbation events. The 2017 Global Initiative for Chronic Obstructive Lung Disease [GOLD] guidelinesCitation7 reemphasized that patients with AECOPD and AECOPD events during hospitalization were important evidence for assessing the risk of future exacerbations.
Chest computed tomography (CT) can provide some data about the pathological changes of COPD. Some indicators (such as emphysema index [EI]) have a good correlation with pulmonary function test (PFT) parameters and mortality from COPD.Citation8 The COPDGene study showed that wall thickness and emphysema were involved in AECOPD and were independent of airflow limitation.Citation9 Many methods have been studied for forecasting AECOPDCitation10 and mortality,Citation11 but COPD is a heterogeneous disease, and these methods were not adopted because of their limitations and because a single index based on punctual clinical, imaging, pulmonary function, and biological markers cannot reflect the whole picture of the disease. Therefore, more reliable tools are necessary to predict AECOPD. Among others, wall thickness and EI, two imaging features, are well-accepted indicators reflecting the pathological changes of COPD.Citation12,Citation13 CT is the preferred imaging technique to image small areas of emphysema and to assess the seriousness of emphysema and COPD.Citation12,Citation13 However, it remains unknown if CT features of COPD can predict hospitalization due to AECOPD.
Therefore, the aims of the current study were: 1) to compare the differences in clinical symptom scores, inflammatory markers, lung function indicators, and CT parameters between patients frequently vs infrequently hospitalized for AECOPD events and 2) to identify the factors associated with acute exacerbation leading to hospitalization.
Patients and methods
Study design and subjects
This was a retrospective study of consecutive patients with COPD hospitalized at the Department of Respiratory Medicine of the Ninth Hospital of Xi’an Affiliated Hospital of Xi’an Jiaotong University between October 2014 and September 2016, meeting the GOLD diagnostic criteria (FEV1/forced vital capacity [FVC] <70% after bronchodilator inhalation).Citation14 The exclusion criteria were as follows: 1) <40 years of age; 2) pregnant woman; 3) comorbid lung diseases such as lung cancer, pneumonia, active pulmonary tuberculosis, pulmonary embolism, or interstitial lung disease; 4) previous lung surgery; 5) unable to complete PFT; 6) asthma, severe heart, liver, or kidney dysfunction; or 7) high-resolution CT (HRCT) quality was insufficient for analysis.
The study is a substudy of the “Digital Lung” Respiratory Disease Evaluation System and Diagnostic Criteria (201402013) approved by the Chinese Clinical Research Registry (approval number ChiCTR-OCH-14004904). The study was approved by the ethics committee of the Ninth Hospital of Xi’an (No 2014001). The need for individual informed consent was waived by the committee because of the retrospective nature of the study, and the medical data accessed were de-identified.
Grouping
During follow-up after the hospitalization, the patients who had been rehospitalized within 1 year for AECOPD were grouped into the FE group, while the ones who were not hospitalized in the following year were grouped into the infrequent exacerbation (IE) group.
Data collection
After enrollment, sex, age, smoking status (former smokers, never smokers, and current smokers), place of residence, COPD health education (both education to the general population and specialized education to the COPD patients), body mass index (BMI), and the number of hospitalization due to AECOPD in the past year were collected. The COPD Assessment Test (CAT) and the modified Medical Research Council (mMRC) dyspnea index were collected from the medical charts.
PFT
The PFT was performed just before discharge, at which time the patients had no symptoms of wheezing. Spirometry and impulse oscillometry system (IOS) (MasterScreen, Jaeger, Germany) were performed. Maximum expiratory flow–volume curve, FVC, pulmonary diffusion function in one breath, and bronchial diastolic function were evaluated after administration of 200 μg of salbutamol. The procedure was performed according to the American Thoracic Society/European Respiratory Society guidelines.Citation15
Biochemistry
Blood was sampled within 3 days of admission. White blood cells, hemoglobin, neutrophil ratio, eosinophil ratio, and platelet count were measured using an automatic blood cell analyzer (BC-6800; Mindray Bio Medical Electronics Co., Ltd, Shenzhen, People’s Republic of China). C-reactive protein (CRP) was measured using a Siemens automatic protein analyzer (BN ProSpec; Siemens, Erlangen, Germany). Fibrinogen was measured using an automatic coagulation analyzer (STA-R Evolution; Diagnostica Stago, Paris, France). Blood gas analysis was performed using a Radiometer ABL Fully Automatic Blood Gas Analyzer (ABL800; Radiometer, Copenhagen, Denmark). Procalcitonin was measured using a BioMerieux Automatic Fluorescence Immunoassay (Mini Vidas; BioMerieux, Marcy l’Étoile, France).
CT examinations were performed using a 64-detector CT (Somatom Definition AS; Siemens) with subjects holding their breath at full inspiration in the supine position. Tube voltage was 120 kV, and tube current varied by automatic methods based on slice location and participants’ body habitus. The exposure time was 0.5 second, and the matrix size was 512×512 pixels. Images were contiguously reconstructed with a 1 mm slice thickness (with 0.625 mm overlapping), using a standard kernel algorithm.
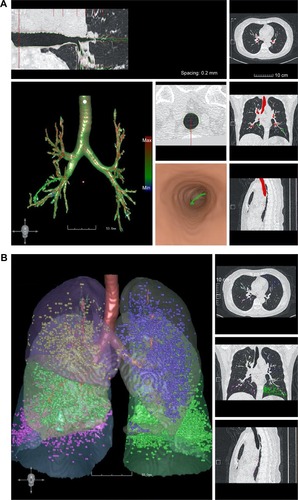
All CT images were automatically analyzed using the FACT-Digital Lung software.Citation16,Citation17 The percentage of the wall area (%WA) of different generations of bronchi in each lobe was calculated as the %WA of the fourth to seventh generations of the right upper lobe (RUL), left upper lobe (LUL), and right middle lobe (RML), and as the %WA of the fourth to ninth generations of the right lower lobe (RLL) and left lower lobe (LLL), represented as %WARUL4–7, %WALUL4–7, %WARML4–7, %WARLL4–9, and %WALLL4–9, respectively. The measurement method is shown in . The extents of emphysema were quantified by the percentage of lung volumes with CT attenuation value below −950 HU (%LAA-950) on the inspiratory images. %LAA-950 was defined as the EI, according to the literature.Citation18,Citation19 EI >10% was defined as the COPD emphysema threshold. The emphysema of whole lung, right lung, left lung, and each lobe was calculated and represented as %LAAwhole, %LAAright lung, %LAAleft lung, %LAARUL, %LAARML, %LAARLL, %LAALUL, and %LAALLL, respectively. Because of the limitations of CT accuracy, EI values <5% were filtered out.Citation18,Citation19 The mean emphysema density (MED) of whole lung, right lung, left lung, and each lobe was represented as MEDwhole, MEDright lung, MEDleft lung, MEDRUL, MEDRML, MEDRLL, MEDLUL, and MEDLLL, respectively. The measurement method is shown in . An emphysema heterogeneity index (HI) ranging from −1 to +1 between the upper and lower lobes was computed, based on a prior paper.Citation20 When emphysema was equally distributed among the lobes or the full extent of the whole lung was <1%, the HI was near zero; otherwise, HI = (%LAAupper − %LAAlower)/(%LAAupper + %LAAlower)*100%.Citation17 Values close to 0 indicated the uniformity of emphysema change. Values close to +1 indicated superiority of upper emphysema. Values close −1 indicated superiority of lower emphysema. %WA was used as an index of bronchial wall thickness. EI was an indicator of the extent of emphysema. MED was an indicator of the degree of emphysema. HI was an indicator of the distribution of emphysema.
Figure 1 (A) CT software measurement of the bronchial wall thickness. (B) CT software measurement of the lung density. The bronchial tree was first identified. Then, the generations of bronchus were identified, after which the mean wall thickness of each generation of bronchus, as well as the other parameters, was measured. The results of the measurements are shown in the left panel. The whole lung and the different lobes are shown. The measurements of the lung density (HU) are shown in different colors.
Statistical analysis
Statistical analysis was performed using SPSS 19.0 (IBM Corporation, Armonk, NY, USA). Two-sided P-values <0.05 were deemed statistically significant. Continuous data were tested for normality using the Kolmogorov–Smirnov test. Data meeting the normal distribution were expressed as mean ± SD and were analyzed using the Student’s t-test. Non-normally distributed data were expressed as median (range) and analyzed using the Mann–Whitney U test. Categorical data were expressed as proportions and analyzed using the chi-square test. Binary logistic regression models were used to identify predictive factors for FE using a stepwise method, with a probability value for the entry of P=0.10 and removal of P=0.05.
Results
Patients
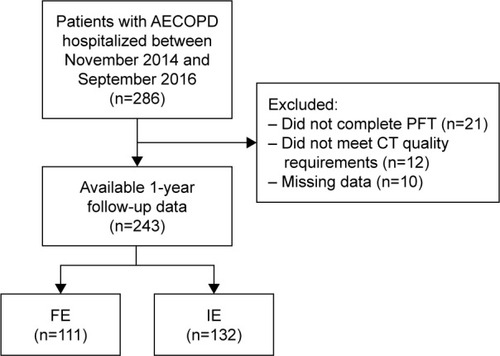
A total of 286 patients were included; 21 did not complete the PFTs, 12 patients failed to meet CT quality requirements, and data were missing for 10 patients. Therefore, 243 patients were included in the analyses ().
Figure 2 Patient flowchart.
Characteristics of the patients
Compared with the IE group, the FE group showed more exacerbation hospitalizations in the following year (P<0.001), higher mMRC classification (P=0.003), higher white blood cells (P=0.026), higher arterial blood carbon dioxide partial pressure (PaCO2; P=0.002), more comorbidities (P=0.032), and higher proportion of patients with GOLD grade 4 (P=0.048). No significant differences were found in age, sex, place of residence, smoking status, BMI, CAT, neutrophil ratio, eosinophil ratio, hemoglobin, platelet, fibrinogen, CRP, and arterial oxygen partial pressure (PaO2; ). Overall, these results suggest that patients in the FE group had a lower health status compared with the IE group.
Table 1 Demographic and clinical characteristics of the patients
Comparison of PFT between FE and IE hospitalization
Compared with the IE group, the FE group had lower FEV1/FVC (P=0.005), FEV1%pred (P=0.002), maximal mid-expiratory flow (MMEF25–75%pred) (P=0.003), and DLCO/VA (P=0.03) and higher response frequency (Fres; P=0.04). Residual volume/total lung capacity (RV/TLC), total respiratory impedance (Z5%pred), resistance at 5 Hz-resistance at 20 Hz (R5–R20), reactance at 5 Hz (X5), and reactance area (Ax) did not show significant differences (P>0.05; ). These results indicate lower pulmonary functions in patients of the FE group.
Table 2 Comparison of PFT between the FE and IE groups
Comparison of %WA, %LLA, MED, and HI between FE and IE
Compared with the IE group, the FE group had more %WARUL4 (0.63 [0.58–0.66] vs 0.60 [0.55–0.65], P=0.026); %WARML4 (0.56±0.09 vs 0.53±0.08, P=0.019); %WARLL5 (0.57±0.06 vs 0.55±0.06, P=0.008); %WALUL4 (0.59±0.08 vs 0.57±0.07, P=0.031); %WALLL4 (0.56±0.07 vs 0.53±0.07, P=0.019); and %WALLL5 (0.64 [0.59–0.67] vs 0.61 [0.57–0.65], P=0.021; ).
Table 3 Comparison of CT parameters between the FE and IE groups
Compared with the IE group, the EI of the whole lung, right lung, left lung, and each lung lobe in the FE group were higher: %LAAwhole (9.88 [1.82–18.58] vs 5.92 [1.53–11.21], P=0.014); %LAAright lung (9.47 [1.94–18.13] vs 5.58 [1.19–10.83], P=0.011); %LAAleft lung (9.43 [1.84–19.02] vs 4.85 [1.42–10.27], P=0.018); %LAARUL (9.45 [1.72–23.21] vs 5.1 [1.03–11.3], P=0.022); %LAARML (8.97 [3.75–17.64] vs 4.39 [1.15–11.34], P=0.004); %LAARLL (6.04 [1.52–12.93] vs 3.59 [0.74–9], P=0.024); %LAALUL (7.69 [2.27–22.39] vs 5.06 [1.5–12.88], P=0.045); and %LAALLL (7.44 [1.69–13.58] vs 3.64 [0.7–9.86], P=0.018; ).
MEDwhole and MEDleft lung in the FE group were significantly worse than in the IE group (P<0.05). Further analysis in each lobe showed emphysema density difference in MEDRUL (P=0.03) and MEDLLL (P=0.02). There were no differences in MEDright lung MEDRML, MEDRUL, and MEDLLL (P>0.05). Unexpectedly, HI (which represents emphysema distribution) was not different between the FE and IE groups (all P>0.05; ). Overall, these results suggest that worst imaging features of emphysema, ie, %WA, %LLA, and MED, were associated with more FEs of COPD.
Factors influencing FE hospitalization
The GOLD guidelines suggest that FEV1 is a predictor of poor prognosis; mMRC ≥2 is the recommended cutoff value for the classification of symptoms; and white cell counts (>10×109), PaCO2 >45 mmHg, and X5 negative value increase <0 are reference values for pulmonary functions.Citation1,Citation7 EI >10% was determined according to Hersh et alCitation18 and Xie et al.Citation19
Seven variables were included in the logistic regression model: exacerbation hospitalizations in the past year (≥1), FEV1%pred (<50%), mMRC (≥2), comorbidities (≥1), white cell counts (>10×109), and EI (>10%). Using the stepwise method, exacerbation hospitalizations in the past year and EI >10% were independently associated with frequent AECOPD hospitalization ().
Table 4 Logistic regression analysis of factors associated with FE hospitalization
Discussion
COPD is a heterogeneous disease, and the available prognostic indexes are therefore limited. This study aimed to identify the factors associated with AECOPD leading to hospitalization. The results suggest that exacerbation hospitalizations in the past year and EI were independently associated with FE hospitalization. Wall thickness and EI, two imaging features, are well-accepted indicators reflecting the pathological changes of COPD.Citation12,Citation13,Citation21 EI is more sensitive, while wall thickness can only be applied for major airways; hence, the contribution of small airway in the evaluation of COPD is limited. Nevertheless, the changes in the major airways can reflect the changes in the small airways. Therefore, the current study investigated COPD from the range and distribution of emphysema to explore the relationship with frequent hospitalization caused by acute exacerbation, which has never been reported before.
Previous studies of the readmissions for AECOPD identified a number of risk factors. Bahadori et alCitation22 identified preadmission oxygen use, history of lung infection, other chronic respiratory disease, and shorter hospital stay as risk factors for readmission for AECOPD. A review identified more severe COPD as the main factor for rehospitalization, as well as older age, increased breathlessness, poor general condition, cyanosis, peripheral edema, impaired consciousness, poor coping at home, significant comorbidities, and failure to initial treatments.Citation23 Another study reported that respiratory rate, heart rate, and oxygen saturation are factors for rehospitalization.Citation24 These studies did not directly examine CT features of COPD as risk factor for rehospitalization.
The current study showed that the COPD of patients with FE hospitalization showed more obvious symptoms of dyspnea, inflammation, and ventilation disorder, more comorbidities, and worse pulmonary function. In addition, CT analysis showed that the destruction of the parenchyma of whole lung, right lung, left lung, and all five lung lobes was more pronounced in FE patients. Furthermore, the mean density of emphysema was more severe in the RUL and LLL. Finally, exacerbation hospitalizations in the past year and EI were independently associated with hospitalization. These results are supported by a cohort study that showed that with the increase in the number of hospitalizations, the risk of acute exacerbation and death increased in turn.Citation25 The ECLIPSE study also showed that the three-year mortality rate was much higher in patients with AECOPD hospitalization than in those without AECOPD hospitalization.Citation26 Therefore, the prediction of frequent acute exacerbation of hospitalization is vital to the management of COPD.
HRCT imaging allows objective measurements of the pathological damages of COPD (peripheral airway stenosis, airflow limitation, emphysema structural changes, etc). The severity of emphysema is associated with increased health deterioration and increased mortality.Citation27,Citation28 Peripheral airway wall thickness is associated with pulmonary function and acute exacerbations.Citation27,Citation29 Therefore, CT data on COPD pathological damage and subtype assessment are of great significance. The current study showed that the emphysema range of the FE group was obviously more important than that of the IE group, and that the severity of emphysema was especially high in the upper right and lower left lobes. The parenchyma destruction could be used as an indicator of the progression of COPD. Previous studies have shown that the distribution of emphysema is heterogeneous,Citation30,Citation31 and the superior lung distribution of COPD suggests that a subgroup of patients may benefit from lung reduction surgery. On the other hand, the current study showed that the HI of emphysema was not associated with FE hospitalization.
Each leaf of the proximal bronchus (fourth and fifth generations) wall area percentage of the FE group was obviously increased compared to that of the IE group, but the distal bronchus (sixth to ninth generations) wall area was not found to be different between the two groups. The airway can respond to small airway inflammation, and small airway measurements have never been suitable for clinical assessments. The current study showed that the detection of airway morphological changes may have a certain clinical usefulness.
Although FEV1 is considered to be unable to provide the whole COPD picture and is not a reliable predictor for a specific individual,Citation32 this is controversial. Indeed, the ECLIPSE study suggested that the grade of lung function, COPD mortality, and previous year hospitalization were higher in patients with FE.Citation26 In the current study, FEV1 and other lung function parameters could not predict frequent AECOPD hospitalization. FEV1 mainly reflects the obstruction of the large airways and is not sensitive to the obstruction of the small airway.
It has been reported that the base CAT value can be highly accurate to predict the time of the first acute exacerbation.Citation21 The risk of death in COPD with cough and expectoration is reported to increase significantly.Citation33 A study found that the risk of AECOPD increased with the simultaneous increase in baseline CRP, fibrinogen, and white blood cell count.Citation34 In the current study, mMRC, white blood cell count, and PaCO2 were higher in the FE group than in the IE group, indicating that FE may be associated with more dyspnea symptoms, inflammation, and ventilation disorders. Nevertheless, neither CAT nor mMRC were associated with the risk of future exacerbation hospitalizations, as supported with a previous study.Citation5
The current study is not without limitations. The follow-up period was short, only 1 year. Second, the number of inflammatory indicators was limited, and no inflammatory indicator could be associated with acute exacerbation. Finally, the sample size was small. Additional studies are still necessary to identify the risk factors for AECOPD.
Conclusion
In addition to exacerbation hospitalizations in the past year, imaging parameters, including the EI (>10%), have a certain value in predicting FE hospitalization.
Author contributions
XW and ZQM conceived and coordinated the study, designed, performed, and analyzed the experiments, and wrote the paper. NY, JTR, CWJ, JYM, MJS, LBT, and YZG carried out the data collection, data analysis, and revised the paper. YMG designed the study and revised the paper. All the authors reviewed the results and approved the final version of the manuscript. All the authors participated in substantial contributions to conception and design, acquisition of data, or analysis and interpretation of data; drafting the paper or revising it critically for important intellectual content; final approval of the version to be published; and agreement to be accountable for all aspects of the work in ensuring that questions related to the accuracy or integrity of any part of the work are appropriately investigated and resolved.
Acknowledgments
This study was supported by the Shaanxi Province Social Development Science and Technology Research Project (Grant No 2016SF-151) and by the Xi’an Science and Technology Project (Grant No 2016045SF/YX01). The funders had no role in study design, data collection and analysis, decision to publish, or preparation of the manuscript.
Disclosure
The authors report no conflicts of interest in this work.
References
- Global Initiative for Chronic Obstructive Lung Disease (GOLD) [homepage on the Internet]Global Strategy for the Diagnosis, Management and Prevention of COPD2011 [cited Feb 21, 2011 Available from: http://www.goldcopd.org/Accessed December 8, 2014
- QureshiHSharafkhanehAHananiaNAChronic obstructive pulmonary disease exacerbations: latest evidence and clinical implicationsTher Adv Chronic Dis20145521222725177479
- ChenYYaoWKangJAttitudes and actions of chronic obstructive pulmonary disease patients on treatment: a national multi-center investigative studyChin J Tuberc Respir Dis20103310750753
- Diagnosis and Treatment of Acute Exacerbation of Chronic Obstructive Pulmonary Disease (AECOPD) Expert GroupChronic obstructive pulmonary disease acute exacerbation (AECOPD) diagnosis and treatment of Chinese experts consensus (revised in 2014)Int J Respir2014341111
- HurstJRVestboJAnzuetoASusceptibility to exacerbation in chronic obstructive pulmonary diseaseN Engl J Med2010363121128113820843247
- Global Initiative for Chronic Obstructive Lung Disease (GOLD) [homepage on the Internet]From the Global Strategy for the Diagnosis, Management and Prevention of COPD2013 Available from: http://goldcopd.org/Accessed December 8, 2014
- Global Initiative for Chronic Obstructive Lung Disease (GOLD) [webpage on the Internet]From the Global Strategy for the Diagnosis, Management and Prevention of COPD2017 Available from: http://goldcopd.org/gold-2017-global-strategy-diagnosis-management-prevention-copd/Accessed February 12, 2017
- HarunaAMuroSNakanoYCT scan findings of emphysema predict mortality in COPDChest2010138363564020382712
- HanMKKazerooniEALynchDAChronic obstructive pulmonary disease exacerbations in the COPDGene study: associated radiologic phenotypesRadiology2011261127428221788524
- ShahSAVelardoCFarmerATarassenkoLExacerbations in chronic obstructive pulmonary disease: identification and prediction using a digital health systemJ Med Internet Res2017193e6928270380
- ChanHPMukhopadhyayAChongPLPRole of BMI, airflow obstruction, St George’s Respiratory Questionnaire and age index in prognostication of Asian COPDRespirology201722111411927581386
- ChoromanskaAMacuraKJRole of computed tomography in quantitative assessment of emphysemaPol J Radiol2012771283622802863
- ChaeEJSeoJBSongJWSlope of emphysema index: an objective descriptor of regional heterogeneity of emphysema and an independent determinant of pulmonary functionAJR Am J Roentgenol20101943W248W25520173123
- Global Initiative for Chronic Obstructive Lung Disease (GOLD) [homepage on the Internet]From the Global Strategy for the Diagnosis, Management and Prevention of COPD2016 Available from: http://goldcopd.org/Accessed February 12, 2017
- MillerMRHankinsonJBrusascoVATS/ERS Task ForceStandardisation of spirometryEur Respir J200526231933816055882
- PuJFuhrmanCGoodWFSciurbaFCGurDA differential geometric approach to automated segmentation of human airway treeIEEE Trans Med Imaging201130226627820851792
- YuNXinX-MLiYEffect of computed tomography dose on quantitative measurement and automated segmentation of airway treeJ Med Imaging Health Inf20155715191523
- HershCPMakeBJLynchDANon-emphysematous chronic obstructive pulmonary disease is associated with diabetes mellitusBMC Pulm Med20141416425341556
- XieMWangWDouSCuiLXiaoWQuantitative computed tomography measurements of emphysema for diagnosing asthma-chronic obstructive pulmonary disease overlap syndromeInt J Chron Obstruct Pulmon Dis20161195396127226711
- YuNWeiXLiYDengLJinC-WGuoYComputed tomography quantification of pulmonary vessels in chronic obstructive pulmonary disease as identified by 3D automated approachMedicine20169540e509527749587
- LeeSDHuangMSKangJThe COPD assessment test (CAT) assists prediction of COPD exacerbations in high-risk patientsRespir Med2014108460060824456695
- BahadoriKFitzGeraldJMLevyRDFeraTSwistonJRisk factors and outcomes associated with chronic obstructive pulmonary disease exacerbations requiring hospitalizationCan Respir J2009164e43e4919707601
- MacIntyreNHuangYCAcute exacerbations and respiratory failure in chronic obstructive pulmonary diseaseProc Am Thorac Soc20085453053518453367
- WiwatcharagosesKLueweeravongKFactors associated with hospitalization of chronic obstructive pulmonary disease patients with acute exacerbation in the emergency department, Rajavithi HospitalJ Med Assoc Thai201699suppl 2S161S16727266231
- SuissaSDell’AnielloSErnstPLong-term natural history of chronic obstructive pulmonary disease: severe exacerbations and mortalityThorax2012671195796322684094
- MuellerovaHMaselliDJLocantoreNHospitalized exacerbations of COPD risk factors and outcomes in the ECLIPSE cohortChest20151474999100725356881
- HanMKBartholmaiBLiuLXClinical significance of radiologic characterizations in COPDCOPD20096645946719938970
- MartinezFJFosterGCurtisJLPredictors of mortality in patients with emphysema and severe airflow obstructionAm J Respir Crit Care Med2006173121326133416543549
- HasegawaMNasuharaYOnoderaYAirflow limitation and airway dimensions in chronic obstructive pulmonary diseaseAm J Respir Crit Care Med2006173121309131516556695
- ValipourAShahPLGesierichWPatterns of emphysema heterogeneityRespiration201590540241126430783
- JuJLiRGuSImpact of emphysema heterogeneity on pulmonary functionPLoS One2014911e11332025409328
- HanMKAgustiACalverleyPMChronic obstructive pulmonary disease phenotypes the future of COPDAm J Respir Crit Care Med2010182559860420522794
- PutchaNDrummondMBConnettJEChronic productive cough is associated with death in smokers with early COPDCOPD201411445145824127996
- ThomsenMIngebrigtsenTSMarottJLInflammatory biomarkers and exacerbations in chronic obstructive pulmonary diseaseJAMA2013309222353236123757083