
Abstract
Introduction
Severe exacerbations associated with chronic obstructive pulmonary disease (COPD) that require hospitalization significantly contribute to morbidity and mortality. Definitions for exacerbations are very broad, and it is unclear whether there is one predominant underlying mechanism that leads to them. Functional respiratory imaging (FRI) with modeling provides detailed information about airway resistance, hyperinflation, and ventilation–perfusion (V/Q) mismatch during and following an acute exacerbation.
Materials and methods
Forty-two patients with COPD participating in a multicenter study were assessed by FRI, pulmonary function tests, and self-reported outcome measures during an acute exacerbation and following resolution. Arterial blood gasses and lung function parameters were measured.
Results
A significant correlation was found between alveolar–arterial gradient and image-based V/Q (iV/Q), suggesting that iV/Q represents V/Q mismatch during an exacerbation (p<0.05).
Conclusion
Recovery of an exacerbation is due to decreased (mainly distal) airway resistance (p<0.05). Improvement in patient-reported outcomes were also associated with decreased distal airway resistance (p<0.05), but not with forced expiratory volume. FRI is, therefore, a sensitive tool to describe changes in airway caliber, ventilation, and perfusion during and after exacerbation. On the basis of the fact that FRI increased distal airway resistance seems to be the main cause of an exacerbation, therapy should mainly focus on decreasing it during and after the acute event.
Introduction
Exacerbation frequency has been increasingly used as an endpoint in clinical trials for obstructive lung diseases such as asthma and COPD. While an exacerbating episode is, without doubt, clinically relevant, the use of exacerbation frequency as a primary endpoint in clinical studies remains problematic. The definition of a respiratory exacerbation, per the Global Initiative for Chronic Initiative for Obstructive Lung Disease (GOLD) criteria, is very general and described as “an acute event characterized by a worsening of the patient’s respiratory symptoms that is beyond normal day-today variations and leads to a change in medication.”Citation1 In practice, this implies that a COPD exacerbation is typically diagnosed by the physician based on patient-reported changes in his or her symptoms rather than an objective threshold defined by changes in lung function (eg, spirometry) or by image-based parameters derived from CT or magnetic resonance imaging. Confounding factors such as physical and psychological comorbidities can also influence the signal of this endpoint. Consequently, the signal-to-noise ratio is quite low and requires large clinical trials to ensure adequate statistical power. Another downside is that this endpoint requires a reliable baseline of the patient’s exacerbation rate, typically defined as at least two exacerbations per year. Often, the observed improvement in exacerbation rate, even in large clinical trials, is very limited in absolute value. Furthermore, a relatively long study duration is required to observe significant and relevant treatment effects using this endpoint.
Objective parameters are needed since they could also add prognostic value in clinical practice by predicting future exacerbating episodes. The latter could be achieved if parameters detect clinically relevant changes in structure and function in lungs that remain subsymptomatic during the in-between exacerbation periods. We believe that image-based parameters including image-based airway resistance, regional flows, and perfusion giving an indication for lobar ventilation–perfusion ratio (V/Q)Citation2 have the potential to be suchparameters. Oxygen uptake indeed depends on optimal ventilation and perfusion matching.
A hallmark feature of COPD patients, especially among those with an emphysematous phenotype, is the destruction of lung tissue resulting in altered vascularization and internal flow distribution, with potentially less airflow going to still well-perfused areas (). This V/Q mismatch ofCitation3–Citation5 has been associated with worsening of patient-reported outcomes (PROs) and exercise tolerance but, to our knowledge, has not been confirmed during exacerbation periods looking at the local changes in ventilation and perfusion; however, it is mainly derived from blood gas measurements that are suggestive for increased alveolar–arterial oxygen gradient (AaDO2). A method that could, therefore, assess patient-specific V/Q ratio in a straightforward manner, preferably on a lobar basis, has high potential to be a relevant parameter and potentially a more objective descriptor of the pathophysiological changes during an exacerbation. It also has the potential to be a prognostic factor. Lobar level seems relevant as many diseases exhibit patterns where either the upper lobes (eg, emphysema in COPD) or lower lobes (eg, emphysema in α1 antitrypsin deficiency or fibrosis in idiopathic pulmonary fibrosis) are initially affected, followed by a spreading of the disease to the other lobes.
Figure 1 Functional respiratory imaging can describe vascular structures and blood vessel density as well as lobe and lung expansion and, therefore, indicate the image-based ventilation–perfusion ratio.
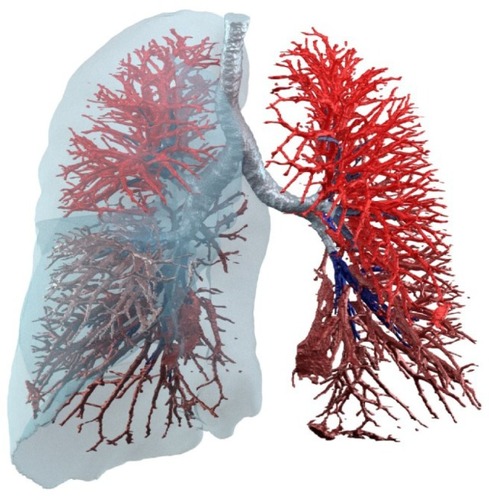
Our group has developed a method called functional respiratory imaging (FRI) that addresses the call for more objective parameters. FRI is a combination of high-resolution, low-dose, volumetric CT scans and computational fluid dynamics (CFD). FRI provides regional details associated with lung structure and function. In previous studies, we demonstrated the capabilities of FRI to provide accurate parameters related to ventilation, perfusion, and tissue characteristic.Citation6,Citation8 As such, FRI has emerged as a powerful tool to assess bronchodilation, vasodilation, and changes in internal flow distribution and, based on that, inhaled aerosol deposition.
The aim of this study was to examine exacerbations in COPD patients using FRI to better understand alterations in lung structure and function due to the exacerbating episode.
Materials and methods
A total of 42 patients with COPD participating in a multicenter trial (NCT1684384) were included in this study. COPD was defined by the GOLD criteria. Patients had documented histories of postbronchodilator forced expiratory volume (FEV1)/forced vital capacity (FVC) <70% and postbronchodilator FEV1 <80% predicted in the last 5 years and smoking histories of at least 10 pack-years. At entry into the study, experiencing an exacerbation was defined as an acute change in a patient’s baseline dyspnea, cough, and/or sputum that was beyond normal day-to-day variations and that necessitates the administration or doubling of systemic corticosteroid treatment. Patients diagnosed with asthma, pneumonia as defined radiologically at the start of the exacerbation, and/or a history of lung cancer were excluded. Patients with an indication for noninvasive ventilation were also excluded, as we know that this can alter airway geometries.
Patients underwent two low-dose high-resolution computed tomography (HRCT), one during an exacerbation and another 6–8 weeks after the recovery from the episode. During the scan sessions, one scan was taken at total lung capacity (TLC), the lung level attained after deep inspiration, and another was taken at functional residual capacity (FRC), the lung volume attained after a normal expiration. A handheld pneumotachograph was used for volume-gating purposes to ensure scans were taken at the correct lung level. A pneumotachograph has limitations because it only gives relative volume values and not absolute volume values. The HRCT scans were then processed using the FRI approach, which quantifies lobar volumes (iVlobes) at both lung volumes also providing internal airflow distribution, airway volumes (iVaw), airway resistance (iRaw), and blood vessel volumes (iVbv). In addition to the scans, spirometry was performed and patients completed a range of PROs, including the COPD Assessment Test (CAT) and Modified Medical Research Council Dyspnea scale. Arterial blood gases were obtained at baseline in a subset of patients not taking oxygen and in all patients during recovery without oxygen.
The study protocol was approved by the Ethical Committee of the University Hospital of Antwerp (14/35/361), and written informed consent was given by each patient at the time of entry to the study. All procedures performed in this study were in accordance with the ethical standards of the institutional research committee and with the 1964 Helsinki declaration and its later amendments or comparable ethical standards. The clinical trial registration number for this study is NCT1684384.
Functional respiratory imaging
HRCT images were imported into Mimics, a commercial, US Food and Drug Administration-approved, medical image processing software package (Materialise, Leuven, Belgium, Food and Drug Administration, K073468; CE certificate, BE 05/1191 CE01). This software package converts the HRCT images into patient-specific, three-dimensional (3D) computer models of the lung lobes and the airway tree, which can be segmented down to bronchi with a diameter of about 1–2 mm. The 3D models were converted in a computational grid using a commercial software package. Mesh size was about 4.5×10⁶ cells. Steady flow simulations on these grids were performed using a commercial CFD solver. The airway tree was evaluated at TLC and at FRC. CT scans are taken using a dose-reduction protocol (120 kV, 10–100 mAs; noise factor 28; collimation 0.625 mm; rotation time 0.6 s; and pitch factor 1.375), resulting in an effective dose of 1–2 mSv per CT scan. The scan resolution is 0.5 mm3, and the slice increment is 0.6 mm.
A mass flow of 30 L/min was specified as a boundary condition at the trachea to reflect normal tidal breathing. At the outlets, the static pressure was defined using an iterative process to reflect the internal mass flow distribution matching the lobar expansion as derived from the CT data. The flow was considered laminar, incompressible, and adiabatic. The local airway resistance (iRaw) was obtained from the CFD data and defined as iRaw = Δp/F, where Δp equals the total pressure drop over a certain region and F equals the mass flow rate of air through this region.
FRI assessment of blood vessel density
Blood vessel density can be determined through segmentation and 3D reconstruction of the blood vessels. Segmentation is based on a Hounsfield unit (HU) threshold of [−600; 600] and is performed on the TLC scan. Blood vessel density can be considered a surrogate for perfusion, as outlined in the study by De Backer et al.Citation9 These insights allow us to study the localization of emphysema and V/Q mismatch in COPD patients. We calculated perfusion and ventilation separately for each lobe. Image-based perfusion (iQ) was calculated by blood vessel density at TLC multiplied by image volume at TLC. Image-based ventilation (iV) was calculated by image-based volume at TLC minus the image-based volume at FRC. This was calculated for the five lobes separately. The mean value of image-based ventilation–perfusion match (iV/Q) for each individual patient was calculated.
Statistical analysis
Statistical analysis was performed using the Statistica (Statistica 13, Statsoft, Dell, Tulsa, OK, USA). Spearman rank order correlations were performed between parameters that were measured on a lobar basis. Significance level was set at p<0.05.
Results
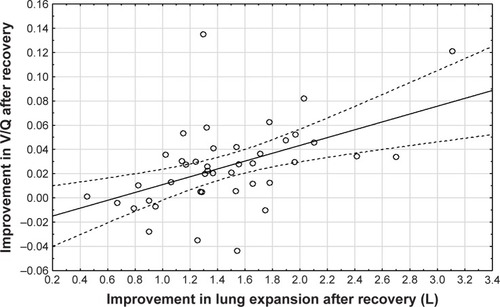
A total of 54 patients were enrolled (intention to treat population) in the clinical trial (NCT1684384) between October 2012 and August 2014 in Belgium (N=38), the Netherlands (N=6), and Italy (N=10). Forty-two patients were evaluated in this study as per protocol analysis. Twelve patients were excluded because of clinical and technical reasons (pneumonia, need of Bipap, second CT scan could not be taken, or data were missing). Not all the test could be performed in all the patients at both visits. All the patients started with systemic corticosteroids treatment after admission to the hospital. About 55% were male (N=23) with a mean age of 68 years and a mean FEV1 of 1.13 L. Descriptive data are listed in . The changes in FEV1, FRC, and TLC between visit 1 and visit 2 are listed in . FEV1 significantly increased at recovery (p<0.001), FRC significantly decreased at recovery (p=0.02), and TLC remained unchanged. The iV/Q ratio derived from the HRCT scans significantly correlated with AaDO2 (p=0.01; ). It was found that iV/Q significantly improved after recovering from an exacerbation (p<0.05). Improvement in iV/Q correlated with increased lung expansion (p=0.00, ). Lung expansion is the difference at lobar level between FRC and TLC volumes measured by imaging (iV). No such correlation was found with changes in the imaged perfusion surrogate (iQ). Hence, the improvement in iV/Q is mainly driven by the improvement in iV.
Table 1 Patient characteristics
Table 2 Changes in FEV1, FRC, and TLC between visit 1 and visit 2
Figure 2 There is a significant correlation (Spearman rank order R=−0.47, p=0.02) between iV/Q (at visit 2) and AaDO2 (at visit 2) indicating that iV/Q reflects ventilation–perfusion mismatch.
Abbreviations: AaDO2, alveolar–arterial oxygen gradient; iV/Q, image-based ventilation–perfusion.
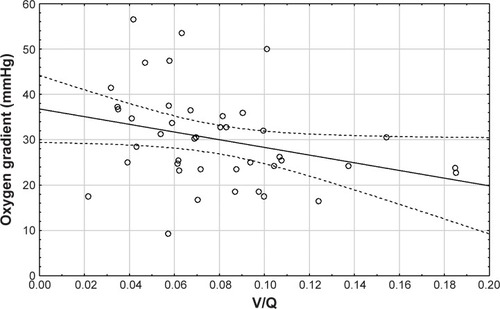
Figure 3 There is a significant correlation between the improvement in lung expansion (the difference at lobar level between FRC and TLC volumes) and the improvement in iV/Q (Spearman rank order R=0.51, p=0.00) indicating that the improvement in iV/Q is due to improved ventilation at the lobar level.
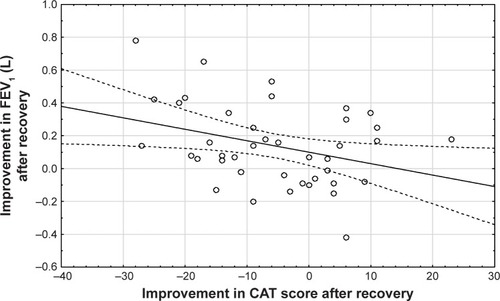
Central airway resistance and distal airway resistance both declined after an exacerbation. The increased lung expansion significantly correlated with improved distal airway resistance (, p=0.03) and with improved central airway resistance (, p=0.00). Changes in FRI-based distal airway resistance (iRaw distal) measured at FRC significantly correlated with changes in the PROs, mainly CAT (, p=0.04) and mMRC (p=0.00). No association was found between patients’ improvement in FEV1 and their PROs ().
Figure 4 Correlation between the improvement in lung expansion (as a sum of lobar expansion; Spearman rank order R=−0.34, p=0.03) after recovery and distal airway resistance (measured at TLC) after recovery (at visit 2).
Abbreviation: TLC, total lung capacity.
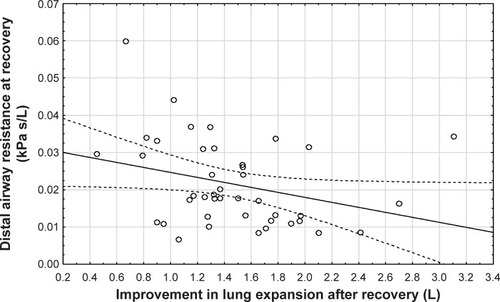
Figure 5 Correlation between lung expansion (Spearman rank order R=−0.53, p=0.00) after recovery and central airway resistance (at TLC) after recovery (at visit 2).
Abbreviation: TLC, total lung capacity.
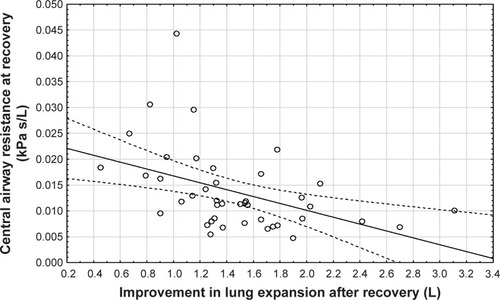
Figure 6 Correlation between the improvement in CAT score (Spearman rank order R=0.33, p=0.04) and the drop in distal airway resistance (at FRC) after recovery.
Abbreviations: CAT, COPD assessment test; FRC, functional residual capacity.
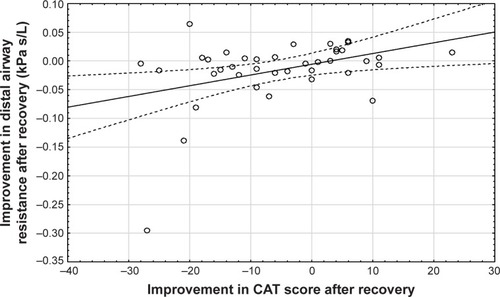
Figure 7 Absence of correlation between the improvement in FEV1 and the improvement in CAT score (Spearman rank order R=−0.25, p=0.12).
Discussion
We observed that the increase in distal airway resistance mainly leads to hyperinflation and V/Q mismatch during the exacerbation. Further, changes in perfusion only partially contribute to the observed worsening in V/Q. The changes in distal airway resistance correlated with the PROs, which was not the case for the lung function tests. Enhanced distal airway inflammation seems to be the main driver of the exacerbation and, therefore, also the most important target for treatment. For the first time, HRCT data and CFD have been used to understand the pathophysiological changes that take place during a COPD exacerbation. FRI provided deeper insight into regional changes in distal bronchial and central bronchial airway resistance and the V/Q ratio during an exacerbation and in the recovery phase. One of the major limitation of the study is it’s small sample size; thereby, the findings of this study may or may not be conclusive or generalizable to other COPD patients. To confirm the results of this study, a larger-scale study has to be implemented.
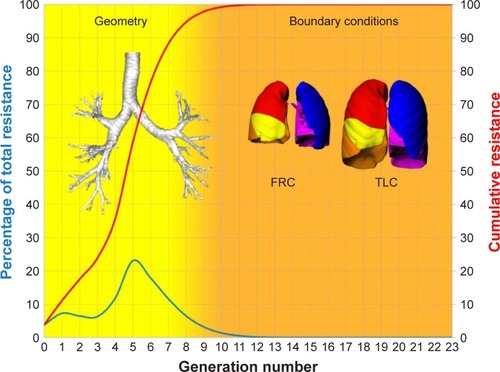
Small airways are usually defined as noncartilaginous conducting airways with an internal diameter <2 mm (corresponding to approximately eight generations of airways down to the terminal and respiratory bronchioles) and alveoli.Citation10,Citation11 We looked at distal airways (starting from the fourth generation until the seventh to eighth generation) since these airways include almost all the airway resistance (). A characteristic finding in COPD subjects with severe airflow limitation (GOLD stages III and IV) is increased epithelial thickness, probably related to squamous metaplasia and goblet cell hyperplasia.Citation12 An increase in airway resistance can be caused by a range of mechanisms such as respiratory infection, cardiac failure, or emotional distress and is not well defined by traditional lung function measurements.Citation13 A retrospective review of patients who underwent spirometry and static lung volume measurements before and after the administration of 200 µg salbutamol showed that FEV1 is an insensitive marker for bronchodilator responsiveness and is especially unable to predict improvement in symptoms or exercise tolerance.Citation14 Lung hyperinflation correlates better with dyspnea and health status than with FEV1 and is responsible for excessive loading and functional weakness of inspiratory muscles.Citation15–Citation17
Figure 8 Relationship between airway resistance and airway generation.
Abbreviations: FRC, functional residual capacity; TLC, total lung capacity.
Our findings using FRI indicate that treatment of an exacerbation should be focused on improvement of distal bronchial airway resistance. However, measurement of distal bronchial airway resistance in patients with COPD has proven difficult to explore. An invasive technique that involves an esophageal balloon to measure pleural pressure can be used to calculate the total pulmonary resistance. Forced oscillations techniques and multiple nitrogen washout tests have the disadvantage of inconsistent reliabilityCitation18,Citation19 and lack spatial resolution.
FRI provides deeper insight as the static images obtained with CT can be made more functional by means of CFD. CFD allows for patient-specific, high-quality 3D modeling with accurate boundary conditions. The process is also relatively simpler and significantly less invasive. Patients undergo two low-dose HRCT scans with respiratory gating, performed at FRC and TLC. A combination of increased speed and reduced slice thickness makes it possible to scan the patient during one breath hold and subsequently reconstruct the airway geometry in a 3D computer model up to the distal airways. FRI provides details of the ventilation, perfusion, and deposition of inhaled drugs.Citation7,Citation9,Citation17,Citation20–Citation27 Regional airway resistance and impedance can also be measured with FRI. The airways can be segmented up to the point where no distinction can be made between the intraluminal and alveolar air. This is where the airway diameter is about 1–2 mm, typically around the fifth to tenth bifurcation, depending mainly on the disease state of the individual patient. From the resulting model, the central and distal airway volumes (iVaw) can be assessed at individual airways or within different regions. The distal airway volume is defined as the segmented airway volume starting from the third bifurcation.Citation28 For the boundary conditions, a steady normal inspiratory flow is chosen, typically at 25–30 L/min to simulate tidal breathing. The outflow to each lobe is adjusted iteratively for each patient to match the internal flow rate distributions obtained from the segmentation of the CT scans. The airflow distribution in the computer model reflects the airflow distribution as derived from the expansion of the lung lobes from FRC to TLC. This way, airway resistance (iRaw), defined as the total pressure drop over an airway, divided by the flow rate through that airway, in individual airways or different regions can be obtained from the CFD calculations ().
Distal airways abnormalities are found early during COPD, and this provides a rationale for early therapy targeting these airways. Yanai et alCitation29 showed that distal airway resistance was significantly increased in patients with chronic airflow obstruction. Despite recognition that distal airways are important in the pathophysiology of COPD, current inhaled therapies mostly deposit in proximal airways.Citation30 In our patients, there was significant improvement in distal resistance in the recovery phase of an exacerbation. Better treatment strategies for patients with COPD include the delivery of oral medications or inhaled medication using extra-fine particles, which are known to deposit in both proximal and distal airways, as opposed to non-extra-fine particles, which deposit predominantly in proximal airways.
Other possible methods to improve distal bronchial airway resistance are systematic effective anti-inflammatory therapies. Roflumilast is a novel phosphodiesterase 4 inhibitor that has been shown to induce a modest increase in FEV1 and to reduce mainly severe COPD exacerbations in specific subgroups of patients with COPD.Citation9,Citation27,Citation31,Citation32 In a previous study, we demonstrated that orally administered Roflumilast supported the reduction of regional hyperinflation in areas previously undertreated by inhalation medication.Citation27 The local reduction in hyperinflation induced a redistribution of ventilation and aerosol deposition, leading to the enhanced efficacy of the concomitant ICS/LABA/LAMA therapy. Reducing the airway resistance could also be established by increasing the intraluminal airway pressure with noninvasive ventilation (NIV). NIV effects in chronic hypercapnic COPD patients were studied using FRI to identify the mechanism behind the beneficial effect and to investigate if there were different responder groups.Citation25 A mass flow redistribution occurred in patients treated with long-term NIV over 6 months, providing a better V/Q match and, hence, better blood gases and lung function in patients with a blood vessel density of >9%. Control patients improved homogeneously in iVaw and iRaw, but no changes were found in gas exchange, and so no increase in V/Q ratio or alveolar ventilation was seen. This led us to conclude that only patients with localized small airway disease may be good candidates for long-term NIV treatment.
In our opinion, all currently available inhaled drugs may have effects on distal bronchial airways if they can reach them. Opening the distal bronchial airways by systemic therapy, inhaled therapy, and/or airway clearance techniques is the adequate treatment for a COPD exacerbation and maintenance therapy. This study supports the role of the distal airway in the exacerbation period.
Structural abnormalities are not only limited to small conducting airways and alveoli but also extend to small pulmonary arteries (diameter <500 µm). Abnormalities in pulmonary arteries can also be found in patients with moderate COPD and in smokers with normal lung function, suggesting that these abnormalities may originate at an early stage in cigarette smoke-induced respiratory disease.Citation33 Abnormalities in pulmonary arteries may result in gas exchange impairment and, in a minority of patients, in pulmonary hypertension.Citation7,Citation34 HRCT can also determine vasculature by calculating the percentage of voxels in a lobe that lie in the (−600, 600) HU range, a measure of the electron density of the tissue. Furthermore, the severity of emphysema can also be correlated with a decrease in local HU, indicating a destruction in pulmonary lung tissue. These insights in perfusion allow us to study the localization of emphysema in COPD patientsCitation7 and their V/Q match. In our study, there was a significant correlation between iV/Q and AaDO2, indicating that the iV/Q represents V/Q mismatch. Improvement of the iV/Q at recovery of an exacerbation appears mainly driven by lobar expansion, indicative of better ventilation with minimal change in perfusion. No significant changes in the blood vessel density were observed. The iV/Q is still only a surrogate marker for the real V/Q mismatch, and the units used in this study are driven by the units used for the blood vessel density and, therefore, not representative for the real V/Q units. However, given the good correlation with the AaDO2, it can probably be used in a more systematic way to obtain insight in the relative contribution of the airway component (reflected in the iV factor) and the vascular component (reflected in the iQ factor). In this study, we mainly observed changes in iV as driver for the V/Q mismatch, but it might well be that at the individual level and larger scale some patients do present with an exacerbation clinic driven by the iQ factor. That would, of course, have therapeutic implications.
Improvement in the PROs did not correlate with changes in FEV1. On the contrary, distal bronchial airway resistance was significantly associated with patients’ self-reported symptoms (). Change in FRI-based distal bronchial airway resistance at FRC correlated with the change in CAT and mMRC dyspnea scores. We can conclude from these results that distal bronchial airways are a major site of airflow limitation in COPD patients during an exacerbation and have a direct impact on their perceived symptoms. We consider this as an important finding from this study.
Conclusion
Therapeutic interventions should be aimed at improving distal bronchial airway resistance, especially during COPD-associated exacerbations. iV/Q helps us better understand the pathophysiology of COPD exacerbations and other effects of complex pulmonary diseases. The correlation with iV/Q and blood gases is not perfect, but the trends are there, and in fact we were impressed that regional information coming from CT images can explain the V/Q mismatch in a meaningful way. This indeed may also help us when looking for the “regional” cause of the hypoxemia. FRI is a compatible tool to determine the underlying mechanisms that lead to exacerbations as well as the potential effectiveness of a treatment by providing a highly sensitive and detailed description of airway resistance. Future studies using this tool may further confirm this approach that has the potential to substantially improve the diagnosis and treatment of the exacerbation.
Acknowledgments
Cedric van Holsbeke also contributed to this research. This study was sponsored by GSK (unrestricted grant).
Disclosure
J De Backer and W Vos are affiliated with FLUIDDA NV. The authors report no other conflicts of interest in this work.
References
- VestboJHurdSSRodriguez-RoisinRThe 2011 revision of the global strategy for the diagnosis, management and prevention of COPD (GOLD) – why and what?Clin Respir J20126420821422906068
- BarberàJARocaJFerrerAMechanisms of worsening gas exchange during acute exacerbations of chronic obstructive pulmonary diseaseEur Respir J1997106128512919192930
- Rodríguez-RoisinRDrakulovicMRodríguezDARocaJBarberàJAWagnerPDVentilation-perfusion imbalance and chronic obstructive pulmonary disease staging severityJ Appl Physiol (1985)200910661902190819372303
- WestJBState of the art: ventilation-perfusion relationshipsAm Rev Respir Dis19771165919943921067
- MarthanRCastaingYManierGGuenardHGas exchange alterations in patients with chronic obstructive lung diseaseChest19858744704753979134
- HajianBDe BackerJVosWVan HolsbekeCClukersJDe BackerWFunctional respiratory imaging (FRI) for optimizing therapy development and patient careExpert Rev Respir Med201610219320626731531
- HajianBDe BackerJVosWPulmonary vascular effects of pulsed inhaled nitric oxide in COPD patients with pulmonary hypertensionInt J Chron Obstruct Pulmon Dis2016111533154127462149
- HajianBDe BackerJVosWAertsJCluckersJDe BackerWEfficacy of inhaled medications in asthma and COPD related to disease severityExpert Opin Drug Deliv2016131719172727292454
- De BackerWVosWVan HolsbekeCThe effect of roflumilast in addition to LABA/LAMA/ICS treatment in COPD patientsEur Respir J201444252752924791831
- BurgelPRBourdinAChanezPUpdate on the roles of distal airways in COPDEur Respir Rev20112011972221357888
- BurgelPRde BlicJChanezPUpdate on the roles of distal airways in asthmaEur Respir Rev200918112809520956128
- HoggJCChuFUtokaparchSThe nature of small-airway obstruction in chronic obstructive pulmonary diseaseN Engl J Med2004350262645265315215480
- RichardsonATolleyEHartmannJEvaluation of chronic obstructive pulmonary disease (COPD) and reduced ejection fraction heart failure (HFrEF) discharge medication prescribing: is drug therapy concordant with national guidelines associated with a reduction in 30-day readmissions?Respir Med201611913514027692135
- NewtonMFO’DonnellDEForkertLResponse of lung volumes to inhaled salbutamol in a large population of patients with severe hyperinflationChest200212141042105011948031
- Garcia-RioFLoresVMedianoODaily physical activity in patients with chronic obstructive pulmonary disease is mainly associated with dynamic hyperinflationAm J Respir Crit Care Med2009180650651219542481
- O’DonnellDEBertleyJCChauLKWebbKAQualitative aspects of exertional breathlessness in chronic airflow limitation: pathophysiologic mechanismsAm J Respir Crit Care Med199715511091159001298
- De BackerJVosWVinchurkarSThe effects of extrafine beclometasone/formoterol (BDP/F) on lung function, dyspnea, hyperinflation, and airway geometry in COPD patients: novel insight using functional respiratory imagingJ Aerosol Med Pulm Drug Deliv2015282889925004168
- GoldmanMDSaadehCRossDClinical applications of forced oscillation to assess peripheral airway functionRespir Physiol Neurobiol20051481–217919415990365
- VerbanckSSchuermansDMeysmanMPaivaMVinckenWNoninvasive assessment of airway alterations in smokers: the small airways revisitedAm J Respir Crit Care Med2004170441441915130906
- De BackerJWVosWGVinchurkarSCValidation of computational fluid dynamics in CT-based airway models with SPECT/CTRadiology2010257385486221084417
- VinchurkarSBackerLDVosWHolsbekeCVBackerJDBackerWDA case series on lung deposition analysis of inhaled medication using functional imaging based computational fluid dynamics in asthmatic patients: effect of upper airway morphology and comparison with in vivo dataInhal Toxicol2012242818822260527
- De BackerLAVosWDe BackerJVan HolsbekeCVinchurkarSDe BackerWThe acute effect of budesonide/formoterol in COPD: a multi-slice computed tomography and lung function studyEur Respir J201240229830522183484
- De BackerLAVosWGSalgadoRFunctional imaging using computer methods to compare the effect of salbutamol and ipratropium bromide in patient-specific airway models of COPDInt J Chron Obstruct Pulmon Dis2011663764622162649
- De BackerJVosWVan HolsbekeCEffect of high-dose N-acetylcysteine on airway geometry, inflammation, and oxidative stress in COPD patientsInt J Chron Obstruct Pulmon Dis2013856957924293993
- De BackerLVosWDieriksBThe effects of long-term noninvasive ventilation in hypercapnic COPD patients: a randomized controlled pilot studyInt J Chron Obstruct Pulmon Dis2011661562422135493
- De BackerWDevolderAPoliGLung deposition of BDP/formoterol HFA pMDI in healthy volunteers, asthmatic, and COPD patientsJ Aerosol Med Pulm Drug Deliv201023313714820109122
- VosWHajianBDe BackerJFunctional respiratory imaging to assess the interaction between systemic roflumilast and inhaled ICS/LABA/LAMAInt J Chron Obstruct Pulmon Dis20161126327126917956
- De BackerJWVosWGDevolderAComputational fluid dynamics can detect changes in airway resistance in asthmatics after acute bronchodilationJ Biomech200841110611317698073
- YanaiMSekizawaKOhruiTSasakiHTakishimaTSite of airway obstruction in pulmonary disease: direct measurement of intrabronchial pressureJ Appl Physiol1992723101610231568955
- LeachCColiceGLLuskinAParticle size of inhaled corticosteroids: does it matter?J Allergy Clin Immunol20091246 SupplS88S9319962042
- CalverleyPMRabeKFGoehringUMRoflumilast in symptomatic chronic obstructive pulmonary disease: two randomised clinical trialsLancet2009374969168569419716960
- FabbriLMCalverleyPMIzquierdo-AlonsoJLRoflumilast in moderate-to-severe chronic obstructive pulmonary disease treated with longacting bronchodilators: two randomised clinical trialsLancet2009374969169570319716961
- SantosSPeinadoVIRamirezJCharacterization of pulmonary vascular remodelling in smokers and patients with mild COPDEur Respir J200219463263811998991
- MageeFWrightJLWiggsBRParéPDHoggJCPulmonary vascular structure and function in chronic obstructive pulmonary diseaseThorax19884331831893406902