
 ?Mathematical formulae have been encoded as MathML and are displayed in this HTML version using MathJax in order to improve their display. Uncheck the box to turn MathJax off. This feature requires Javascript. Click on a formula to zoom.
Abstract
Background
Spirometry, the main tool for diagnosis and follow-up of COPD, incompletely describes the disease. Based on volumetric capnography (VCap), an index was developed for the diagnosis and grading of COPD, aimed as a complement or alternative to spirometry.
Methods
Nine non-smokers, 10 smokers/former smokers without COPD and 54 smokers/former smokers with COPD were included in the study. Multiple breath washout of N2 and VCap were studied with Exhalyzer D during tidal breathing. VCap was based on signals for flow rate and CO2 and was recorded during one breath preceding N2 washout. Efficiency Index (EFFi) is the quotient between exhaled CO2 volume and the hypothetical CO2 volume exhaled from a completely homogeneous lung over a volume interval equal to 15% of predicted total lung capacity.
Results
EFFi increased with increased Global initiative for chronic Obstructive Lung Disease (GOLD) stage and the majority of subjects in GOLD 2 and all subjects in GOLD 3 and 4 could be diagnosed as having COPD using the lower 95% confidence interval of the healthy group. EFFi also correlated with N2 washout (r=−0.73; p<0.001), forced expiratory volume in 1 second (r=0.70; p<0.001) and diffusion capacity for carbon oxide (r=0.69; p<0.001).
Conclusion
EFFi measures efficiency of tidal CO2 elimination that is limited by inhomogeneity of peripheral lung function. EFFi allows diagnosis and grading of COPD and, together with FEV1, may explain limitation of physical performance. EFFi offers a simple, effortless and cost-effective complement to spirometry and might serve as an alternative in certain situations.
Introduction
Spirometry is the main diagnostic test for COPD and other obstructive diseases.Citation1,Citation2 COPD commences with bronchiolitis and centrilobular emphysema for which spirometry has limited sensitivity and, thus, provides incomplete information about physiological aberrations in COPD.Citation2–Citation5 Additionally, spirometry requires proper patient collaboration and can, therefore, be problematic to perform in children and mentally/physically incapable subjects. Diagnoses may therefore be delayed for years, leading to increased burden on patients and society.Citation6,Citation7 Inhomogeneity of pathology reduces diffusion capacity of carbon monoxide over the lung (DL,CO) and retards washout of nitrogen in the multiple breath washout of nitrogen (MBW N2). These tests require complex equipment and are demanding with respect to patient cooperation. In contrast, volumetric capnography (VCap) requires just a few tidal breaths through a pneumotachograph and a CO2 analyzer followed by simple computer analysis, leading to a more facilitated method of obtaining and analyzing data. In COPD, the shape of the curve from a single breath test for CO2 (SBT CO2) differs from that of a healthy subject by a slower rise of CO2 towards an alveolar plateau that, furthermore, has a higher slope.Citation8–Citation11
Our objectives were to obtain an index of efficiency of tidal ventilation with respect to CO2 exchange (Efficiency Index, EFFi) and to test the hypothesis that EFFi may be used for diagnostics and grading of COPD. To do this, we modified a concept originally proposed by Fletcher and Jonson and applied in healthy subjects by Åström et al,Citation12 so that all relevant information in the SBT CO2 was taken into account, while non-relevant information was excluded.Citation13
Materials and methods
Lung function measurements have been previously described in the “Materials and methods” section of the study by Jarenbäck et al.Citation14 Subjects were recruited from a research cohort and from an existing pool of patients attending our research clinic. Exclusion criteria were cardiorespiratory disease other than COPD, including respiratory tract infection during the last 3 weeks and any history of asthma. Study subjects were instructed to refrain from smoking, intake of caffeine and high nitric containing food 2 hours before visiting the clinic. They performed spirometry, DL,CO and MBW N2 (including VCap) in the given order. All lung function measurements were performed without bronchodilator (except for in very severe subjects who could not refrain from their standard medications due to dyspnea). Ethical permission was given by the Regional Ethical Board in Lund (431/2008), and written informed consent was obtained from each subject. This study followed the guidelines set in the Declaration of Helsinki.
Nine non-smokers, 10 smokers/former smokers without COPD and 54 smokers/former smokers with COPD (Global initiative for chronic Obstructive Lung Disease [GOLD] 1–4)Citation1 were included. All smokers and former smokers had >10 pack years. For spirometry and for DL,CO, Master Screen BODY and Master Screen PFT (Erich Jaeger GmbH, Würzburg, Germany) were used, respectively. Reference values for spirometry were defined by Crapo et alCitation15 and for DL,CO by Quanjer et al.Citation16
MBW N2 and VCap were studied with Exhalyzer D (Eco Medics, Dürnten, Switzerland). Tidal breaths, ~1 L deep, were taken under guidance from a computer screen (Spiroware, Eco Medics). Ventilation heterogeneity in the acinar airways (Sacin) that expresses inhomogeneity of the acinar airways is then calculated.Citation17 Exhalyzer D uses a mainstream capnograph and an ultrasound flow meter connected to the subject via a mouthpiece and an anti-microbial filter (Electrostatic Filter; GVS Filter Technology, Zola Predosa, Italy). VCap was based on signals for flow rate and fraction of expired CO2 (FECO2) during the MBW N2. From one breath, before N2 washout with pure oxygen was started, flow and CO2 signals were sampled at a rate of 200 per second and transferred to Microsoft Excel for analyses of the SBT CO2 (). The analyses started after expiration of pure airway dead space, which was when FECO2 reached 0.002 and continued over the “analyzed volume” (VAN) which was standardized to 15% of predicted total lung capacity (TLC). For breaths not covering the whole VAN, the alveolar plateau was extrapolated as in previous studies.Citation8,Citation18 The volume of CO2 exhaled over VAN equals area “A”. The hypothetical volume of CO2 exhaled from a lung with a completely homogenous function would correspond to the rectangular area (A+B). EFFi was calculated as:
Figure 1 Single breath test curve for CO2 for calculations of EFFi.
Abbreviations: EFFi, Efficiency Index; TLC, total lung capacity.
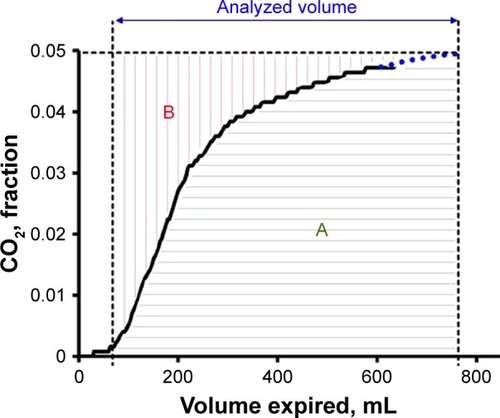
EFFi represents the ratio between eliminated CO2 over the volume eliminated from a theoretical “ideal” lung and expresses the efficiency of the breath in elimination of CO2.
Statistics
Statistical analyses were performed in SPSS version 23 for Windows (IBM Corporation, Armonk, NY, USA). Differences between groups were analyzed using the Kruskal–Wallis test with Dunn’s post hoc test to compare all groups to each other. Correlations were performed using Spearman’s correlation test. All correlations were checked graphically to confirm association. Categorical data between groups were analyzed using the Chi-square test. A value of p<0.05 was considered significant. Table data are presented as median with interquartile range. Data in graphs are presented as individual dots with median.
Results
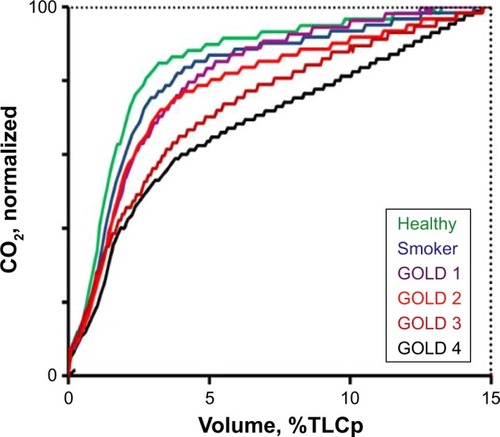
The different groups were similar in age and height, but lung physiology data showed deterioration with increasing disease severity (). illustrates SBT CO2 for the subjects with median EFFi in each group. The curves were normalized so that the volume axis covered 0–100% of VAN, while the CO2 axis covered the range from 0 to 100% of the value at the end of VAN.
Table 1 Patient demographics and characteristics
Figure 2 SBT CO2 curves from the subject with median value of EFFi in each group.
Abbreviations: EFFi, Efficiency Index; GOLD, Global initiative for chronic Obstructive Lung Disease; SBT CO2, single breath test for CO2; TLCp, predicted value for total lung capacity.
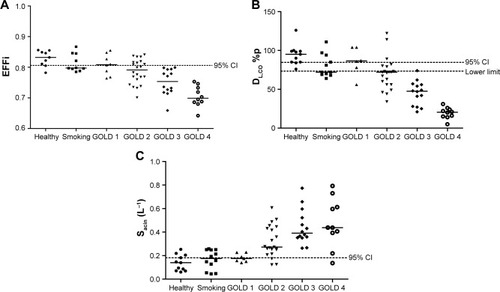
The distribution of EFFi in the different groups is illustrated in . The majority of subjects in GOLD 2 and all subjects in GOLD 3 and 4 showed EFFi below the 95% confidence interval of healthy subjects. Similar findings were observed for DL,CO and Sacin (,respectively).
Figure 3 Grading COPD with small airway parameters.
Abbreviations: %p, % of predicted value; EFFi, Efficiency Index; GOLD, Global initiative for chronic Obstructive Lung Disease; DL,CO, diffusion capacity of carbon monoxide over the lung; Sacin, ventilation heterogeneity in the acinar airways.
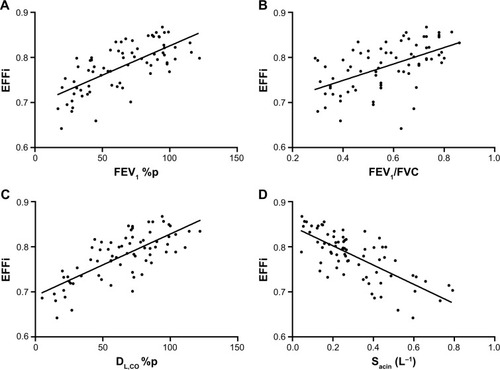
EFFi correlated with forced expiratory volume in 1 second (FEV1) (r=0.70; p<0.001; ), FEV1/forced vital capacity (r=0.58; p<0.001; ), DL,CO (r=0.69; p<0.001; ) and Sacin (r=−0.73; p<0.001; ).
Figure 4 Correlation between EFFi and lung function parameters.
Abbreviations: %p, % of predicted value; EFFi, Efficiency Index; DL,CO, diffusion capacity of carbon monoxide over the lung; FEV1, forced expiratory volume in 1 second; FVC, forced vital capacity; Sacin, ventilation heterogeneity in the acinar airways.
Discussion
We found that by analyzing EFFi from a SBT CO2 curve, information about lung pathology could be accessed. This may be used as a simple, inexpensive way to identify subjects with COPD or as a complement to spirometry.
Along a principle related to that used for calculation of EFFi, Åström et al calculated a dead space volume based on information limited to Phase II. In that case, the information related to the high slope of the alveolar plateau in COPD is then ignored.Citation12 Our goal was to include all relevant information in the SBT CO2 curve, ie, Phase II and III. Initial fraction of VAN contained little CO2 and contributed to low efficiency, while later fractions with higher CO2 content were more efficient. Accordingly, VAN must be standardized to avoid influencing EFFi by the volume range of analysis. Tidal volume depends on several factors and is a confounding, non-relevant factor. To compare subjects with different lung size, it was reasoned that predicted TLC is a proper parameter for standardization of VAN. VAN was set to 15% of predicted value for TLC, in line with previous studies.Citation8,Citation18 Accordingly, VAN commenced when CO2 fraction in expired air became significant and ended after expiration of a further 15% of predicted TLC. When needed, the alveolar plateau was extrapolated to the end point of VAN.Citation8,Citation18 Future studies based on completely spontaneous ventilation and a lower tidal volume may show if an alternative definition of VAN might be favorable.
Area A, as shown in , represents the expired CO2 volume while area (A+B) reflects the theoretical volume of CO2 exhaled from an ideal homogenous lung. Accordingly, A/(A+B), ie, EFFi, is an index of the efficiency of the lung with respect to CO2 elimination. EFFi is considered easier to comprehend than any parameter related to alveolar dead space. Being dimensionless, EFFi is independent on the level of CO2 in alveolar gas, on calibration of the CO2 meter and in which unit CO2 content is expressed. The normalization of both expired volume and fraction of CO2 that is inherent in EFFi lends itself to a graphical presentation that facilitates comparison between groups () or between results of consecutive follow-up in patients.
Most previous studies are based on limited information from the SBT CO2 such as slope of Phase II and/or the slope of the alveolar plateau, Phase III.Citation11,Citation19–Citation21 Analysis of slope, the derivative of a mathematical function, is inherently sensitive to signal noise. The alveolar plateau is upward convex rather than linear and minor variation in the algorithm may lead to large variation in calculated slope.Citation22 EFFi is based on integration of all data over VAN, a stable, comprehensible mathematical process refractory to noise. Kars et al found that Phase II of the SBT did not provide information sensitive enough for diagnosis of emphysema.Citation10 This may reflect that the analysis was limited to a narrow volume interval of the SBT CO2 without relation to predicted lung size.
Low EFFi reflects a combination of: 1) a widened range of alveolar CO2 caused by inhomogeneity of ventilation/perfusion quotient (V/Q) among lung compartments; and 2) that compartments with high V/Q and low CO2 content during expiration empty sooner than compartments with low V/Q and high CO2 content.Citation23 These two phenomena are concurrent in COPD and other obstructive lung diseases. In pulmonary embolism, compartments with high and low V/Q empty in synchrony leading to a SBT CO2 with normal form, but a depressed alveolar plateau.Citation8,Citation18
In COPD, the alveolar plateau extrapolated to 15% of TLC leading to a CO2 value indicating the level of arterial pressure of CO2 (PaCO2).Citation7 However, before partial pressure of CO2 (PCO2) at expiration of 15% of TLC is used as an indicator of PaCO2, studies in wider COPD populations are needed.
COPD leads to emphysema, mainly of centrilobular nature. Centrilobular bullae represent high V/Q compartments, while better preserved, more peripheral alveolar structures represent low V/Q compartments. During expiration, gas from central bullae is expired sooner than gas from peripheral alveoli. The two prerequisites for a low EFFi are thereby fulfilled. These compartments are connected in series with one another. Uneven airway obstruction is another pathological feature of COPD. More obstructive lung compartments represent low V/Q compartments which during expiration empty slower than less obstructive, high V/Q compartments. These compartments are connected in parallel. VCap does not indicate to what extent serial and parallel compartments contribute to a low EFFi.
A recent analysis emphasizes that ventilatory inefficiency and increased dead space contribute to exertional dyspnea in COPD.Citation24 It was concluded that ventilatory inefficiency may progress despite only modest changes in FEV1 and that serial measurements of ventilation over CO2 elimination might prove valuable to track disease progression. This is exactly what EFFi offers in a most simple way. FEV1 (percentage of predicted value) indicates the patient’s ventilatory capacity, while EFFi indicates the efficiency of ventilation. FEV1 and EFFi may together explain how physical performance is limited in COPD.
In all GOLD 3 and 4 subjects, EFFi was lower than in healthy subjects. Spirometric criteria for COPD for grade GOLD 1 and 2 have important limitations.Citation25 While EFFi allows diagnosis of advanced COPD, further studies are needed to define the usefulness of VCap and EFFi for diagnosis of early COPD. Between all groups, EFFi correlated similarly with DL,CO and Sacin (). The overall agreement between EFFi, DL,CO and Sacin is explained in that all three measurements reflect uneven ventilation.Citation26 DL,CO and MBW N2 are frequently used as a complement to FEV1 with respect to how the disease affects gas exchange and ventilatory inhomogeneity. EFFi would be a simpler alternative that directly indicates how the diseases affect CO2 exchange.
This study is based upon data from previous studies to illustrate physiological aberrations in COPD of varying GOLD grades.Citation14,Citation27,Citation28 EFFi was measured in one single breath among the few breaths available before oxygen was administered during the N2 wash out test. The material is small and does not allow consideration of age, which has known effects on V/Q inequality and VCap.Citation12,Citation29 Notably, age did not differ between the groups in this study.
This study is suggestive and calls for further studies in larger cohorts before the method can be reliably used for diagnosis of COPD or other obstructive lung diseases. With respect to modelling, it would then be of value to study alternative values of VAN. In unpublished data from Jonson et al (B Jonson, Lund University, unpublished data, 2000), children and adults with cystic fibrosis point to that an index of the same nature as EFFi may indicate deterioration earlier than spirometry. Therefore, studies of obstructive diseases other than COPD are justified.
Conclusion
EFFi measures efficiency of tidal CO2 elimination that is limited by inhomogeneity of peripheral lung function. It may be suitable for diagnosis and grading of COPD and may, together with FEV1, explain limitation of physical performance. EFFi may offer an easy, effortless and cost-effective complement to spirometry and might, in some situations, serve as an alternative when spirometry is not possible.
Author contributions
All authors participated in designing the study and critically revised the manuscript. LJ tested the patients, performed primary analysis, co-wrote the manuscript and performed all statistical calculations. ET, JA and LB helped with collecting data. BJ proposed and performed the calculations and analysis of EFFi and co-wrote the manuscript. All authors approved the final version of the article and are accountable for the accuracy and integrity of the work.
Acknowledgments
We would like to thank the staff at the Lung Research Unit at Region Skåne Hospital for clinical support. This work was supported by independent research grants from the Swedish Heart and Lung Foundation, Evy and Gunnar Sandberg’s Foundation, Crafoord Foundation and Royal Physiographic Society in Lund.
Disclosure
The authors report no conflicts of interest in this work.
References
- Global Initiative for Chronic Obstructive Lung DiseaseGOLD 2017 Global Strategy for the Diagnosis, Management and Prevention of COPD Available from: http://goldcopd.org/gold-2017-global-strategy-diagnosis-management-prevention-copd/Accessed May 8, 2017
- JarenbäckLChronic Obstructive Pulmonary Disease – lung physiology and genetic links [thesis]LundDepartment Clinical Science, Lund, Lund University2016
- MartinezFDEarly-life origins of chronic obstructive pulmonary diseaseN Engl J Med2016375987187827579637
- WoodruffPGCouperDHanMKSymptoms in smokers with preserved pulmonary functionN Engl J Med20163759896897
- WoodruffPGBarrRGBleeckerEClinical significance of symptoms in smokers with preserved pulmonary functionN Engl J Med2016374191811182127168432
- WangSGongWTianYVoluntary pulmonary function screening identifies high rates of undiagnosed asymptomatic chronic obstructive pulmonary diseaseChron Respir Dis201613213714326869578
- ManninoDMDoes undiagnosed chronic obstructive pulmonary disease matter?Am J Respir Crit Care Med2016194325025227479056
- ErikssonLWollmerPOlssonCGDiagnosis of pulmonary embolism based upon alveolar dead space analysisChest19899623573622752819
- YouBPeslinRDuvivierCVuVDGrilliatJPExpiratory capnography in asthma: evaluation of various shape indicesEur Respir J1994723183238162985
- KarsAHGoordenGStijnenTBogaardJMVerbraakAFHilveringCDoes phase 2 of the expiratory PCO2 versus volume curve have diagnostic value in emphysema patients?Eur Respir J19958186927744199
- PontoSKapnovolumetrie als mitarbeitsfreie Diagnostik in der Lungenfunktionsanalyse [Volumetric capnography as a work-free diagnostic in pulmonary function analysis] [thesis]SchweinfurtUFL Private Universität im Fürstentum Liechtenstein2015 German
- AströmENiklasonLDrefeldtBBajcMJonsonBPartitioning of dead space – a method and reference values in the awake humanEur Respir J200016465966411106209
- FletcherRJonsonBDeadspace and the single breath test for carbon dioxide during anaesthesia and artificial ventilation. Effects of tidal volume and frequency of respirationBr J Anaesth19845621091196419753
- JarenbäckLAnkerstJBjermerLTufvessonEAcinar ventilation heterogeneity in COPD relates to diffusion capacity, resistance and reactanceRespir Med2016110283326607879
- CrapoROMorrisAHGardnerRMReference spirometric values using techniques and equipment that meet ATS recommendationsAm Rev Respir Dis198112366596647271065
- QuanjerPHTammelingGJCotesJEPedersenOFPeslinRYernaultJCLung volumes and forced ventilatory flows. Report Working Party Standardization of Lung Function Tests, European Community for Steel and Coal. Official Statement of the European Respiratory SocietyEur Respir J Suppl1993165408499054
- RobinsonPDLatzinPVerbanckSConsensus statement for inert gas washout measurement using multiple- and single-breath testsEur Respir J201341350752223397305
- OlssonKJonsonBOlssonCGWollmerPDiagnosis of pulmonary embolism by measurement of alveolar dead spaceJ Intern Med199824431992079747742
- VeronezLPereiraMCda SilvaSMVolumetric capnography for the evaluation of chronic airways diseasesInt J Chron Obstruct Pulmon Dis2014998398925284998
- RomeroPVRodriguezBde OliveiraDBlanchLManresaFVolumetric capnography and chronic obstructive pulmonary disease stagingInt J Chron Obstruct Pulmon Dis20072338139118229577
- QiGSGuWCYangWLXiFWuHLiuJMThe ability of volumetric capnography to distinguish between chronic obstructive pulmonary disease patients and normal subjectsLung2014192566166825022827
- TusmanGScandurraABöhmSHSuarez-SipmannFClaraFModel fitting of volumetric capnograms improves calculations of airway dead space and slope of phase IIIJ Clin Monit Comput200923419720619517259
- FletcherRJonsonBCummingGBrewJThe concept of deadspace with special reference to the single breath test for carbon dioxideBr J Anaesth198153177886779846
- NederJABertonDCMullerPTVentilatory inefficiency and exertional dyspnea in early chronic obstructive pulmonary diseaseAnn Am Thorac Soc201714Supplement_1S22S2928345959
- WollmerPEngströmGFixed ratio or lower limit of normal as cutoff value for FEV1/VC: an outcome studyRespir Med201310791460146223845882
- WagnerPDDantzkerDRDueckRClausenJLWestJBVentilation-perfusion inequality in chronic obstructive pulmonary diseaseJ Clin Invest1977592203216833271
- ErikssonGJarenbackLPetersonSAnkerstJBjermerLTufvessonEA new approach to assess COPD by identifying lung function breakpointsInt J Chron Obstruct Pulmon Dis2015102193220226508849
- JarenbäckLAnkerstJBjermerLTufvessonEFlow-volume parameters in COPD related to extended measurements of lung volume, diffusion, and resistancePulm Med2013201378205223844288
- CardúsJBurgosFDiazOIncrease in pulmonary ventilation-perfusion inequality with age in healthy individualsAm J Respir Crit Care Med19971562 Pt 16486539279253