
Abstract
Purpose
Asthma–COPD overlap (ACO) is heterogeneous in nature and requires a unified diagnostic approach. We investigated the urinary levels of l-histidine, a precursor of histamine related to inflammatory responses, as a new candidate biomarker for diagnosing this condition.
Patients and methods
We performed a prospective multicenter cohort study with retrospective analysis of 107 patients, who were divided into three groups: asthma, COPD, and ACO, according to the Spanish guidelines algorithm. Urinary l-histidine levels were measured using liquid chromatography-mass spectrometry. High-resolution metabolomic analysis, coupled with liquid chromatography-mass spectrometry and followed by multivariate statistical analysis, was performed on urine samples to discriminate between the metabolic profiles of the groups.
Results
Urinary l-histidine levels were significantly higher in patients with ACO than in those with asthma or COPD, but the subgroups of ACO, classified according to disease origin, did not differ significantly. High urinary l-histidine level was a significant factor for the diagnosis of ACO even after adjusting for age, sex, and smoking amount. Among patients with airflow obstruction, the urinary l-histidine levels were elevated in patients with a documented history of asthma before the age of 40 years or bronchodilator responsiveness ≥400 mL; bronchodilator responsiveness ≥200 mL of forced expiratory volume in 1 second and exceeding baseline values by 12% on two or more visits; blood eosinophil count ≥300 cells·mm−3; and frequent exacerbations (P < 0.05).
Conclusion
Urinary l-histidine could be a potential biomarker for ACO, regardless of the diversity of diagnostic definitions used.
Introduction
Asthma–COPD overlap (ACO) was initially described as a condition characterized by an increased variability in airflow associated with an incompletely reversible airflow obstruction.Citation1 However, there is no universally accepted definition for this condition, and this leads to diverse epidemiology and outcomes of ACO.Citation2 Indeed, ACO is not a single disease, but a combination of syndromes, consisting of several different endotypes and phenotypes with diverse pathogeneses.Citation3 Classification based on the inflammatory profiles and treatable traits, irrespective of taxonomy, would help provide more personalized treatment. However, the identification of new biomarkers for treatable symptoms is needed.Citation4
The main reason for diagnosing ACO in clinical practice is to identify patients with COPD who are likely to have a better response to inhaled corticosteroids (ICSs).Citation4,Citation5 Recently, the use of a Th-2 inflammatory signature (defined by a blood eosinophil count ≥300 cells μL−1 and/or a sputum eosinophil count ≥3%) and genomic signatures of Th-2 inflammation, instead of historical classifications of chronic obstructive airway disease (COAD), was suggested to guide ICS therapy.Citation6,Citation7 However, the cutoff points of blood eosinophil counts are arbitrary, and other Th-2 signatures are difficult to measure. Thus, more markers that represent Th-2 features are required to distinguish ACO for clinical applications.
Histamine is important in the inflammatory response and airway smooth muscle contraction.Citation8,Citation9 Patients with ACO might secrete higher levels of histamine than patients with asthma or COPD, because of airway hyper-responsiveness,Citation10,Citation11 repetitive Th-2-related inflammation, and smooth muscle contraction.Citation11,Citation12 Moreover, urine is easy to collect and has a high concentration of metabolites,Citation13 which are important indicators of pathological states.Citation14,Citation15
Thus, we investigated urinary l-histidine, a precursor of histamine, as a new candidate for the diagnosis of ACO by using high-resolution metabolomics (HRM) and liquid chromatography-mass spectrometry (LC-MS), which is an emerging technique to measure small molecules <1,000 Da in given samples simultaneously and to determine the important features associated with diseases.
Patients and methods
Study design
We performed this prospective cohort study for developing optimal clinical and biological markers for the diagnosis and monitoring of treatment response in patients with chronic airway disease. This multicenter study was performed in Korea University Guro Hospital, Seoul St Mary’s Hospital, and Chonbuk National University Hospital and used the airway disease registry from June 2015 to May 2016. The inclusion criteria for the cohort were as follows: adult patients aged >19 years and patients clinically diagnosed with asthma, COPD, or ACO who had been in a stable state without exacerbation and worsening of symptoms for at least 3 months. Patients with all other diseases that could cause airflow obstruction, including bronchiectasis, tuberculosis-destroyed lungs, or interstitial lung disease, were excluded.
The patients were divided into three groups based on age, medical history, smoking history, pulmonary function test (PFT) results, and blood eosinophil count. COPD (n = 38) was diagnosed on the basis of the American Thoracic Society and Global Initiative for Chronic Obstructive Lung Disease guidelines,Citation16 ie, airflow limitation confirmed by post-bronchodilator spirometry, with forced expiratory volume in 1 second (FEV1)/forced vital capacity (FVC) <70% and a history of smoking or biomass exposure. Asthma (n = 32) was defined according to the Global Initiative for Asthma guidelines.Citation17 The diagnosis of ACO (n = 37) was based on the GesEPOC (the Spanish COPD guidelines) and GEMA (the Spanish Guidelines for the Management of Asthma) algorithms.Citation18 Patients aged >35 years with significant exposure to smoking (≥10 pack-years), persistent airflow limitation, and with a current diagnosis of asthma or with a significantly positive bronchodilator response (BDR ≥ 400 mL and FEV1 ≥ 15%) and/or significant blood eosinophilia (≥300 cells·mm−3) were included in the ACO group.
The following variables were evaluated: smoking history and amount, body mass index (BMI), modified Medical Research Council (mMRC) dyspnea score, St George Respiratory Questionnaire (SGRQ) score, COPD assessment test (CAT) score, asthma control test (ACT) score, PFT (spirometry, lung volume, and diffusing capacity of the lung for carbon monoxide [DLCO]) results, fractionated exhaled nitric oxide (FeNO; ppb), and exacerbation history for 1 year. Blood tests, including eosinophil counts, were performed routinely on the day of enrollment. Urine samples in the overnight-fasted and medication-free state were collected.
FeNO measurement was performed online by using the NIOX MINO® instrument (Aerocrine AB, Solna, Sweden) at 50 mL min−1. An exacerbation was defined as a sustained worsening of the patient’s condition, from the stable state and beyond normal day-to-day variations, that is acute in onset and necessitates a change in regular medication with an unscheduled Dr’s visit because of the worsened respiratory symptoms. Moderate exacerbation was defined as an increase in symptoms that requires treatment with antibiotics and/or corticosteroids, and severe exacerbation was defined as one that requires hospitalization. Patients with two or more moderate-to-severe exacerbations within 1 year and with one or more hospitalizations for severe exacerbation were defined as frequent exacerbators. A significantly positive BDR was defined as ≥400 mL and high eosinophilia was defined as blood eosinophil count ≥300 cells·μL−1.
The study protocol was approved by the institutional review boards (Korea University Guro Hospital: KUGH 13246; Seoul St Mary’s Hospital: KC15OIMI0553; and Chonbuk National University Hospital: 2015-01-018-005). Written informed consent was provided by the patients, and the study conformed to the tenets of the Declaration of Helsinki.
HRM coupled with LC-MS
For HRM analyses, 50 μL of sample aliquots was treated with acetonitrile (Burdick & Jackson, Muskegon, MI, USA) (1:4, v/v) and centrifuged at 13,000 × g for 10 min at 4°C to separate proteins.Citation19,Citation20 Urine samples were analyzed using Agilent 1290 Infinity ultra performance liquid chromatography (UPLC) (Agilent Technologies, Santa Clara, CA, USA) connected to a 6550 iFunnel Q-ToF LC-MS with an electrospray ionization (ESI) source (Agilent Technologies). Samples were analyzed in the ESI-positive ion mode. Mobile phases were high-performance liquid chromatography (HPLC)-grade water (Tedia, Fairfield, OH, USA) with 0.1% formic acid (Fluka, St Louis, MO, USA) (A) and HPLC-grade acetonitrile (Burdick & Jackson) with 0.1% formic acid (Fluka) (B). UPLC gradient conditions were as follows: 0.0−1.0 min 95% A; 1.0−9.0 min 55% A; 9.0−12.0 min 10% A; 12.0−13.5 min 10% A; and 13.5−13.6 min 95% A at a flow rate of 0.4 mL min−1. The injection volume was 3 μL, and each sample was randomly analyzed in triplicate. The analytical column was a Hypersil GOLD aQ (Thermo Fisher Scientific, Waltham, MA, USA; 1.9 μm, 100 × 2.1 mm2) maintained at 45°C. The gas temperature was 250°C, and the nebulizer pressure was 35 psig. The flow rates of the drying gas and sheath gas were 14 L min−1 and 11 L min−1, respectively. Mass spectra, ranging from a mass-to-charge ratio (m/z) of 50–1,000, were collected with 20,000 resolutions over 15 min LC runs.Citation21
Data preprocessing and extraction of mass spectral data
Mass spectral data acquired were converted to mzXML by using ProteoWizard (http://proteowizard.sourceforge.net/) followed by adaptive processing of high-resolution LC-MS data (apLCMS) to obtain ion intensities.Citation21 The apLCMS provided 5,213 m/z within a range of ions set from 50 to 1,000. Data were further processed with normalization, scaling, filtering, and statistical analysis using MetaboAnalyst 3.0 (www.metaboanalyst.ca), which is a web server designed to analyze metabolomic data comprehensively for visualization and interpretation. MetaboAnalyst improves the statistical analysis by filtering the non-informative variables that are unlikely to be of use for further modeling of data, by applying an interquartile range (IQR). In preprocessing mass spectral data, data sets were quantile normalized, log transformed, and pareto-scaled to obtain more comparable individual features before carrying out statistical analyses.
Determination of metabolic profiles and identification of potential metabolites of ACO from asthma and COPD
Metabolites altered between each pair of groups were considered important toward the identification of potential metabolites related to the metabolic effects of ACO that were different from those of asthma and COPD. Accurate masses of significant metabolites were searched against the online biochemical database service The Human Metabolome Database (http://www.hmdb.ca/).Citation22
Statistical analysis
Clinical data were presented as the median and IQR for continuous variables and as a percentage for categorical variables. Data were compared using the Kruskal−Wallis test for continuous variables, comparing each two groups using the Mann−Whitney U-test with Bonferroni corrections (α < 0.017; significant). For categorical variables, Pearson’s χ2 test or Fisher’s exact test was used. Correlations between plasma biomarkers and parameters were analyzed using Spearman’s correlation analysis. Significance was defined as P < 0.05. All analyses were conducted using IBM SPSS Statistics for Windows, Version 20.0 (IBM Corporation, Armonk, NY, USA). Student’s t-test and orthogonal signal correction partial least squares-discriminant analysis (OPLS-DA) were performed using MetaboAnalyst 3.0, to identify the differentially expressed metabolites among the comparison groups. The intensity of l-histidine in the compared groups was analyzed using GraphPad Prism v 5.03 (GraphPad Software, Inc., La Jolla, CA, USA).
Results
Patient characteristics
A total of 107 patients were enrolled. Their baseline characteristics are described in . Patients with asthma were significantly younger than patients with COPD. Most patients in the COPD and ACO groups were male. All of the patients with COPD and ACO were smokers by definition. Comorbidities other than allergic rhinitis were not significantly different between the groups. The mMRC and SGRQ scores of patients with COPD were higher than those of patients with asthma. In the PFTs, BDR was the highest in patients with ACO. Median serum creatinine levels (asthma, 0.8 [0.6–0.9] mg dL−1; COPD, 0.8 [0.6–0.9] mg dL−1; ACO, 0.7 [0.6–0.8] mg dL−1; P = 0.167) and creatinine clearance rates (asthma, 100.5 [71.5–120.9] mL min−1; COPD, 95.7 [66.4–123.0] mL min−1; ACO, 95.7 [66.4–122.9] mL min−1; P = 0.606) were similar among the groups.
Table 1 Comparison of the baseline characteristics of chronic inflammatory airway diseases
Urine metabolomics
To observe the urinary metabolic alterations among asthma, COPD, and ACO, we compared the three groups through multiple testing, by inserting the apLCMS feature table containing 5,213 features obtained from 107 urine samples. Student’s t-test was first utilized to observe the difference in the urinary metabolic phenotype of ACO in comparison with asthma and COPD. Of the 5,213 features, 223 were found significant in the t-test (P < 0.05) between the ACO and asthma group urine samples, whereas 215 features were significantly different between the ACO and COPD group urine samples. Furthermore, to better define the metabolic alteration among the three groups and to visualize the variation among groups, we performed OPLS-DA. In OPLS-DA, the entire sample cluster of ACO showed a clear separation from the clusters of asthma () and COPD (). Such an apparent separation of ACO in comparison with asthma and COPD indicated that the metabolic profile of ACO was highly differentiated from that of asthma and COPD. Moreover, the results of the cross-validation procedure indicated that neither models were overfitting and that both models were reliable, as shown in (intercepts: R2 = 0.964 and Q2 = 0.153) and (intercepts: R2 = 0.971 and Q2 = 0.046). Asthma and COPD urine samples also showed a similar separation pattern in OPLS-DA, as shown in (intercepts: R2 = 0.963 and Q2 = 0.163).
Figure 1 Differential urinary metabolic profiles in patients with asthma–COPD overlap (ACO), asthma, and COPD.
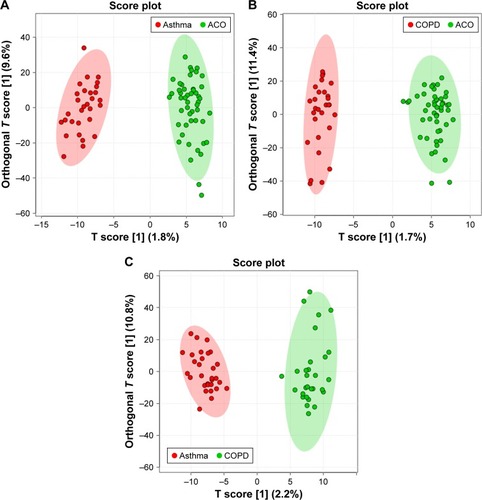
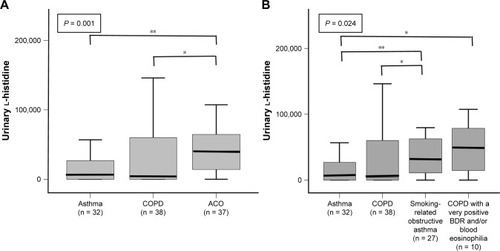
After observing such variations in the metabolome of ACO, we desired to analyze the urinary level of l-histidine in ACO compared with that in asthma and COPD. Interestingly, as shown in , the urinary level of l-histidine (m/z 178.0571, [M+Na]+) was significantly higher in patients with ACO than in those with asthma and COPD. Furthermore, to confirm that l-histidine was specifically elevated among patients with ACO, we analyzed the urine samples of patients with asthma and compared them with those of patients with COPD. Although the OPLS-DA showed a clear separation between the two groups (), the urinary level of l-histidine was not significantly different among patients with asthma and COPD (). These results suggested that l-histidine was specifically elevated among patients with ACO.
Figure 2 Urinary l-histidine levels in chronic inflammatory airway diseases according to disease classifications.
Abbreviations: ACO, asthma-COPD overlap; BDR, bronchodilator response.
Urinary l-histidine in chronic airway disease
Although the median urinary l-histidine levels were significantly higher in patients with ACO than in those with asthma or COPD (), no significant difference was observed in the levels of urinary l-histidine between smoking-related obstructive asthma (n = 27) and COPD with a significantly positive BDR and/or blood eosinophilia (BDR ≥ 400 mL and/or blood eosinophil count ≥300 cells·mm−3, n = 10) ().
The overall sensitivity and specificity of ACO diagnosis were 75.7% and 63.0%, respectively, at the urinary l-histidine cutoff of 13,860. Multivariate logistic regression revealed that a high urinary l-histidine level was a significant parameter of ACO even after adjusting for age, sex, and smoking amount (urinary l-histidine >13,860; OR, 5.254; 95% CI, 2.085–13.236; P < 0.001).
Urinary l-histidine levels and parameters
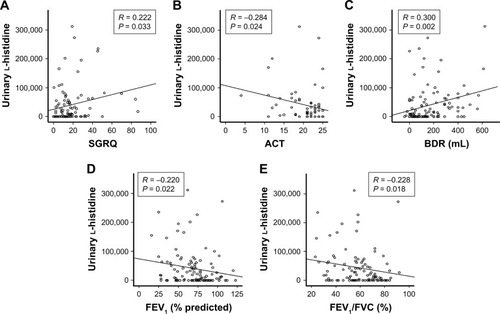
In the total study population, urinary l-histidine levels were positively correlated with SGRQ scores (R = 0.222; P = 0.033) and negatively correlated with ACT scores (R = −0.284; P = 0.024). In the PFTs, urinary l-histidine level was positively associated with BDR (R = 0.300; P = 0.002), total lung capacity (R = 0.242; P = 0.012), and residual volume (R = 0.263; P = 0.006), and negatively correlated with FEV1 (R = −0.220; P = 0.022) and FEV1/FVC (R = −0.228, P = 0.018) (). There was no association between smoking amount and urinary l-histidine levels (R = 0.001, P = 0.990).
Figure 3 Correlation between urinary l-histidine levels and parameters.
Abbreviations: ACT, asthma control test; BDR, bronchodilator response; FEV1, forced expiratory volume in 1 second; FVC, forced vital capacity; RV, residual volume; SGRQ, St George Respiratory Questionnaire; TLC, total lung capacity.
Urinary l-histidine in COAD
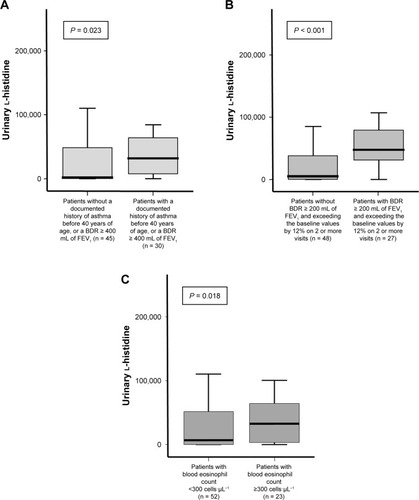
To evaluate the role of urinary l-histidine as a Th-2 inflammatory marker in patients with COAD without diagnostic labeling, we compared the urinary l-histidine levels between the following groups of patients: patients with and without a documented history of asthma before 40 years of age or a BDR ≥ 400 mL of FEV1; patients with and without a BDR ≥ 200 mL of FEV1 and exceeding the baseline values by 12% on two or more visits; and patients with high and low eosinophil counts (according to the experts’ agreement regarding the Th-2 features of ACO).Citation23 The levels of urinary l-histidine were significantly higher in patients with the previously mentioned characteristics than in those without these characteristics (). Moreover, urinary l-histidine levels were significantly higher in frequent exacerbators than in non-frequent exacerbators ().
Table 2 Comparison between frequent exacerbator and non-frequent exacerbator
Figure 4 Urinary l-histidine levels for each category of patients with Th-2 features of ACO as agreed upon by experts.
Abbreviations: ACO, asthma–COPD overlap; BDR, bronchodilator response; FEV1, forced expiratory volume in 1 second.
Discussion
This study investigated urinary l-histidine levels as a bio-marker of ACO. Urinary l-histidine levels were elevated in patients with severe airflow obstruction, high BDR, severe symptoms, and exacerbation. Moreover, the levels were significantly higher in patients with key Th-2 features of ACO agreed upon by experts.Citation23 Histidine is an essential amino acid that is a potential inflammatory metabolite,Citation24 and it has been correlated with inflammation and oxidative stress in previous studies.Citation25 Histidine is a precursor of histamine, which is important in the Th-2 inflammatory response and airway smooth muscle contraction.Citation8,Citation12,Citation26 Thus, the current results imply that urinary l-histidine increases as smooth muscle contraction with reversibility increases and that urinary l-histidine could be an indicator of Th-2-related inflammation.
ACO has both features of asthma and COPD and is regarded to stem from either asthma or COPD.Citation27 Miravitlles has suggested that smoking-related obstructive asthma and COPD with a Th-2 genetic background or with significantly positive BDR could be classified as ACO.Citation28 The former is regarded to originate from asthma, while the latter originates from COPD. However, when we divided patients with ACO into those with smoking-related obstructive asthma and COPD with a significantly positive BDR and/or blood eosinophilia groups, no significant differences were observed in urinary l-histidine levels between the two groups, even though other clinical characteristics, such as lung functions, were significantly different. The two subgroups of ACO are divided on the basis of different historic classifications, but this classification does not reflect inflammatory heterogeneity. ACO might be the different expressions of a single disease entity; this is because we frequently found difficulties in differentiating the origin between asthma and COPD.Citation6 A recent study demonstrated that Th-2-related inflammatory gene expression was also up-regulated in COPD that could not be distinguished using a clinical history of asthma,Citation7 and the Th-2-related signature provided a more clear distinction than the classical diagnosis.Citation6 Moreover, in this study, if we applied the ACO criteria proposed by experts,Citation23 we could classify only 48.1% of patients with smoking-related obstructive asthma and 40.0% of the patients with COPD with significantly positive BDR and/or high blood eosinophilia as having ACO. Therefore, the term “ACO” may be replaced when new phenotypes or endotypes are identified.Citation2,Citation27,Citation29
Recently, emphasis has shifted from diagnostic labels to “treatable traits” among chronic airway inflammatory diseases.Citation4 A primary goal in patients with COPD is to identify patients who may benefit from ICSs. ICS therapy can prevent exacerbation and improve the symptoms and health status of patients with COPD.Citation30,Citation31 However, the use of ICSs also carries the risks of osteoporosis, diabetes, and pneumonia.Citation31,Citation32 Therefore, it is important to find biomarkers that could guide the use of ICSs to reduce the risk−benefit ratio of ICS therapy.
In this study, urinary l-histidine levels were higher in patients identified using the recently proposed algorithm of ACOCitation18 than in patients with asthma or COPD. However, the definition of and diagnostic criteria for ACO are variable, and thus, we removed the classical diagnosis in patients with airflow obstruction and compared the patients according to the characteristics – agreed upon by experts – related to Th-2 features in ACO (ie, a documented history of asthma before 40 years of age or a BDR ≥ 400 mL of FEV1, a BDR ≥ 200 mL of FEV1 and exceeding baseline values by 12% on two or more visits, and a peripheral blood eosinophil count ≥300 cells·μL−1).Citation23 Urinary l-histidine levels were significantly higher in patients with these characteristics. Thus, urinary l-histidine levels could be a biomarker for ACO, regardless of the diversity of ACO definitions.
In addition to considering Th-2 features, ICS use in patients with frequent exacerbation is still needed despite the recent trend of withdrawing ICS in patients with moderate-to- severe COPD without a history of exacerbation.Citation5,Citation33 A history of previous exacerbation is the most potent predictor of future exacerbation.Citation34–Citation36 Thus, there is a need to perform ICS therapy in patients with previous frequent exacerbations despite treatment with bronchodilators. In this study, urinary l-histidine levels were also higher in frequent exacerbators, which supports the evidence indicating that urinary l-histidine is a candidate biomarker for guiding the decision to initiate ICS therapy.
Despite its strengths, this study had some limitations. First, because this study was based on urine analysis, the results could be affected by the time of urine collection. However, we collected urine samples after overnight fasting and in a medication-free state when patients were stable without exacerbation for 3 months. Moreover, we checked the metabolites three times and used the mean results. No patients had renal diseases, and the creatinine clearance rates of all enrolled patients were within the normal range. Furthermore, different from other parameters such as blood markers, urine has an advantage that its sampling is non-invasive and easy. Second, a quantitative analysis was not performed for urine metabolites. Further studies including quantitative analysis and proteomics/genomics studies are necessary to confirm the diagnostic value of urinary l-histidine and to elucidate the underlying mechanism.
Conclusion
Urinary l-histidine could be a potential biomarker for ACO and could be an adjunctive biomarker for ICS guidance, regardless of the diagnosis.
Author contributions
All authors contributed toward data analysis, drafting and revising the paper and agree to be accountable for all aspects of the work.
Acknowledgments
We thank SY Hwang for the excellent statistical support. AstraZeneca supported this study.
Disclosure
The authors report no conflicts of interest in this work.
References
- WedzichaJAPriceDMezziKFogelRBanerjiDQVA149 compared with salmeterol/fluticasone (SFC) on exacerbations and its correlation with baseline blood eosinophils: a pooled analysis of LANTERN and ILLUMINATEEur Respir J201546A1005
- CazzolaMRoglianiPDo we really need asthma-chronic obstructive pulmonary disease overlap syndrome?J Allergy Clin Immunol2016138497798327372569
- TurnerAMTamasiLSchleichFClinically relevant subgroups in COPD and asthmaEur Respir Rev20152413628329826028640
- AgustiABelEThomasMTreatable traits: toward precision medicine of chronic airway diseasesEur Respir J201647241041926828055
- KaplanAGApplying the wisdom of stepping down inhaled corticosteroids in patients with COPD: a proposed algorithm for clinical practiceInt J Chron Obstruct Pulmon Dis2015102535254826648711
- CosíoBGPerez de LlanoLLopez ViñaATh-2 signature in chronic airway diseases: towards the extinction of asthma−COPD overlap syndrome?Eur Respir J2017495160239728461299
- ChristensonSASteilingKvan den BergeMAsthma-COPD overlap. Clinical relevance of genomic signatures of type 2 inflammation in chronic obstructive pulmonary diseaseAm J Respir Crit Care Med2015191775876625611785
- JungJKimSHLeeHSSerum metabolomics reveals pathways and biomarkers associated with asthma pathogenesisClin Exp Allergy201343442543323517038
- HirstSJLeeTHAirway smooth muscle as a target of glucocorticoid action in the treatment of asthmaAm J Respir Crit Care Med19981585 Pt 3S201S2069817746
- HospersJJPostmaDSRijckenBWeissSTSchoutenJPHistamine airway hyper-responsiveness and mortality from chronic obstructive pulmonary disease: a cohort studyLancet200035692381313131711073020
- WhiteMVSlaterJEKalinerMAHistamine and asthmaAm Rev Respir Dis19871355116511763555190
- MazzoniAYoungHASpitzerJHVisintinASegalDMHistamine regulates cytokine production in maturing dendritic cells, resulting in altered T cell polarizationJ Clin Invest2001108121865187311748270
- ForsytheIJWishartDSExploring human metabolites using the human metabolome databaseCurr Protoc Bioinformatics2009 Chapter 14: Unit14.8
- BouatraSAziatFMandalRThe human urine metabolomePLoS One201389e7307624023812
- WishartDSEmerging applications of metabolomics in drug discovery and precision medicineNat Rev Drug Discov201615747348526965202
- Global Initiative for Chronic Obstructive Lung Disease (GOLD) [webpage on the Internet]Global Strategy for Diagnosis, Management and Prevention of COPD 2017GOLD2017 Available from: http://goldcopd.org/gold-2017-global-strategy-diagnosis-management-prevention-copd/Accessed April 9, 2018
- Global Initiative for Asthma [webpage on the Internet]2017 GINA Report, Global Strategy for Asthma Management and PreventionGINA2017 Available from: http://ginasthma.org/gina-reports/Accessed April 9, 2018
- MiravitllesMAlvarez-GutierrezFJCalleMAlgorithm for identification of asthma-COPD overlap: consensus between the Spanish COPD and asthma guidelinesEur Respir J2017495 pii: 1700068
- JohnsonJMYuTStrobelFHJonesDPA practical approach to detect unique metabolic patterns for personalized medicineAnalyst2010135112864287020838665
- PamungkasADParkCLeeSJeeSHParkYHHigh resolution metabolomics to discriminate compounds in serum of male lung cancer patients in South KoreaRespir Res201617110027506545
- YuTParkYJohnsonJMJonesDPapLCMS – adaptive processing of high-resolution LC/MS dataBioinformatics200925151930193619414529
- WishartDSJewisonTGuoACHMDB 3.0 – the human metabolome database in 2013Nucleic Acids Res201241Database issueD801D80723161693
- SinDDMiravitllesMManninoDMWhat is asthma-COPD overlap syndrome? Towards a consensus definition from a round table discussionEur Respir J201648366467327338195
- AndersenHHElberlingJArendt-NielsenLHuman surrogate models of histaminergic and non-histaminergic itchActa Derm Venereol201595777177926015312
- GervasiniGAgúndezJAGarcía-MenayaJVariability of the L-Histidine decarboxylase gene in allergic rhinitisAllergy201065121576158420608921
- CaronGDelnesteYRoelandtsEHistamine polarizes human dendritic cells into Th2 cell-promoting effector dendritic cellsJ Immunol200116773682368611564782
- PostmaDSRabeKFThe asthma-COPD overlap syndromeN Engl J Med2015373131241124926398072
- MiravitllesMDiagnosis of asthma–COPD overlap: the five commandmentsEur Respir J2017495170050628461307
- BarrechegurenMEsquinasCMiravitllesMThe asthma-COPD overlap syndrome: a new entity?COPD Research and Practice2015118
- SuissaSMcGhanRNiewoehnerDMakeBInhaled corticosteroids in chronic obstructive pulmonary diseaseProc Am Thorac Soc20074753554217878466
- PriceDYawnBBrusselleGRossiARisk-to-benefit ratio of inhaled corticosteroids in patients with COPDPrim Care Respir J20132219210023135217
- SuissaSPatenaudeVLapiFErnstPInhaled corticosteroids in COPD and the risk of serious pneumoniaThorax201368111029103624130228
- RossiAGuerrieroMCorradoAOPTIMO/AIPO Study GroupWithdrawal of inhaled corticosteroids can be safe in COPD patients at low risk of exacerbation: a real-life study on the appropriateness of treatment in moderate COPD patients (OPTIMO)Respir Res2014157725005873
- SantibáñezMGarrastazuRRuiz-NuñezMPredictors of hospitalized exacerbations and mortality in chronic obstructive pulmonary diseasePLoS One2016116e015872727362765
- McGhanRRadcliffTFishRPredictors of rehospitalization and death after a severe exacerbation of COPDChest200713261748175517890477
- HurstJRVestboJAnzuetoASusceptibility to exacerbation in chronic obstructive pulmonary diseaseNew Engl J Med2010363121128113820843247