
Abstract
Background
COPD-associated mortality was examined using a novel approach of phenotyping COPD based on computed tomography (CT)-emphysema index from quantitative CT (QCT) and post-bronchodilator (BD) forced expiratory volume in 1 second (FEV1) in a local Malaysian cohort.
Patients and methods
Prospectively collected data of 112 eligible COPD subjects (mean age, 67 years; male, 93%; mean post-BD FEV1, 45.7%) was available for mortality analysis. Median follow-up time was 1,000 days (range, 60–1,400). QCT and clinicodemographic data were collected at study entry. Based on CT-emphysema index and post-BD FEV1% predicted, subjects were categorized into “emphysema-dominant,” “airway-dominant,” “mild mixed airway-emphysema,” and “severe mixed airway-emphysema” diseases.
Results
Sixteen patients (14.2%) died of COPD-associated causes. There were 29 (25.9%) “mild mixed,” 23 (20.5%) “airway-dominant,” 15 (13.4%) “emphysema-dominant,” and 45 (40.2%) “severe mixed” cases. “Mild mixed” disease was proportionately more in Global Initiative for Chronic Obstructive Lung Disease (GOLD) Group A, while “severe mixed” disease was proportionately more in GOLD Groups B and D. Kaplan–Meier survival estimates showed increased mortality risk with “severe mixed” disease (log rank test, p=0.03) but not with GOLD groups (p=0.08). Univariate Cox proportionate hazard analysis showed that age, body mass index, long-term oxygen therapy, FEV1, forced volume capacity, COPD Assessment Test score, modified Medical Research Council score, St Georges’ Respiratory Questionnaire score, CT-emphysema index, and “severe mixed” disease (vs “mild mixed” disease) were associated with mortality. Multivariate Cox analysis showed that age, body mass index, and COPD Assessment Test score remain independently associated with mortality.
Conclusion
“Severe mixed airway-emphysema” disease may predict COPD-associated mortality. Age, body mass index, and COPD Assessment Test score remain as key mortality risk factors in our cohort.
Introduction
COPD is a leading cause of death globally.Citation1 Its heterogeneity presents a challenge to research and pursuit of effective treatment. Many factors like airflow obstruction by spirometry, exercise capacity, frequency of exacerbation, body mass index (BMI), and comorbidities have been shown to influence prognosis.Citation2 Since 2011, the Global Initiative for Chronic Obstructive Lung Disease (GOLD) initiative has advocated a 2-dimensional combined approach (based on symptoms and exacerbation risk/forced expiratory volume in 1 second [FEV1]) to classifying COPD (into Groups A–D) to guide treatment. From the 2017 guidelines, GOLD committee has removed FEV1 from to ease ranking.Citation3 In recent years, quantitative computed tomography (QCT) is being recognized as a valuable tool of phenotyping and prognosticating COPD.Citation4,Citation5 All these approaches will help to prognosticate COPD with a view to recommend therapy.
Compared to the pre-2011 GOLD classification (based solely on post-bronchodilator [BD] FEV1), some researchers have questioned the ability of the GOLD combined approach to better predict mortality.Citation6,Citation7 It is unclear if the exclusion of FEV1 from GOLD combined assessment in 2017 further affects this. QCT measurement of emphysema, air-trapping, and airways in COPD has significantly improved over the yearsCitation8 and has been shown to correlate with physiologic parameters and clinical outcomes like exacerbations, quality of life, and mortality.Citation4,Citation5,Citation9 Among the QCT measurements, CT-emphysema index is probably the most robust parameter that is least subjected to external influences like inspiratory volume and measurement biases.Citation8,Citation10
Lee et alCitation11 were the first researchers who explored the use of CT-emphysema index and FEV1 to subtype COPD into 4 phenotypes of “airway-dominant,” “emphysema-dominant,” “mild mixed airway-emphysema,” and “severe mixed airway-emphysema” disease. They showed that “emphysema-dominant” subtype alone showed least improvement of FEV1 and dyspnea to 3-month treatment with combined inhaled corticosteroids and long-acting β2 agonist compared to others. Such a combination of morphologic and physiologic assessments is logical to approach a complex disease like COPD. In this study, we hypothesized that this CT-emphysema index/FEV1 approach of phenotyping COPD may predict mortality. In a local cohort of well-characterized stable multiethnic COPD patients followed up in a chest clinic of an urban-based general hospital, we studied the COPD-associated mortality and its risk factors according to these phenotypes. We also compared this approach with that of GOLD 2017 combined assessment.
Patients and methods
Patient population
All eligible patients with stable COPD who were referred to or followed up in the chest clinic of the 1,200-bed Penang Hospital, Malaysia, were invited to participate. The inclusion criteria were age ≥40 years old, smoking history of ≥10 pack-years, a diagnosis of COPD by GOLD criteria (inclusive of post-BD FEV1/forced volume capacity [FVC] ⩽0.7), Asian ethnicity, and willingness to undergo study-related testing that included thorax CT. The exclusion criteria were COPD exacerbation within the past 1 month, tuberculosis-destroyed lung (defined as post-tuberculosis scarring involving more than one lung lobe), presence of significant concomitant lung conditions like bronchiectasis or interstitial lung disease, previous lung resection surgery, uncontrolled cancer, and pregnancy. The recruitment began in September 2013. This study forms part of a larger longitudinal cohort study of Asian Network of Obstructive Lung Disease (ANOLD)Citation12 that looks at the heterogeneity of COPD. To date, this research network consists of eleven Asian countries. Written informed consent was obtained from all participants. Research and ethical approval was obtained from the National Research and Ethics Committee of Malaysia (NNMR-13-313-15138).
Data collection including mortality
Demographic and clinical data were collected by a single investigator (OCK) via face-to-face interview and self-administered questionnaires. The data included respiratory symptoms, spirometry, St George’s Respiratory Questionnaire (SGRQ),Citation13 breathlessness score (using modified Medical Council Research Scale [mMRC]Citation14), COPD Assessment Tool (CAT),Citation15 respiratory diagnoses, Charlson’s Comorbidity Index,Citation16 health care utilization, medication use, and COPD risk factors. Spirometry data were obtained before and after administration of a short-acting β-agonist, and its quality was independently reviewed by ANOLD study coordinating center in Seoul to ensure that American Thoracic Society criteria were met.Citation17 Participants were followed up at least once annually on spirometry and mortality. For subjects who died, the specific dates and causes of death were obtained from hospital medical records or family members with verification from official death certificate whenever possible. Death directly due to COPD or recognized COPD-associated comorbidities was considered as COPD-associated death.
QCT measurement
Objective analysis of the lung parenchyma and airways was performed on volumetric CT scans of thorax at full inspiration using a 64-MDCT scanner (Somaton Sensation 64; Siemens Medical Solutions, Forchheim, Germany) in Loh Guan Lye Specialist Centre, Penang. All CT scans were obtained based on standardized protocol from Research Institute of Radiology, Asan Medical Center in Seoul.Citation18,Citation19 Briefly, scan parameters included 0.75 mm collimation, 100 eff mAs, 140 kVp, and pitch 1.0. Patients were scanned craniocaudally in supine position. Images were reconstructed using a soft kernel (B30f; Siemens Medical Solutions) from thoracic inlet to lung base. The CT-emphysema index (or Low Attenuation Area percent) was determined by automatic calculation from the CT data of the volume fraction of the lungs below −950 HU at full inspiration. Airway dimensions including the wall area (WA), lumen area (LA), and WA (WA%), defined as WA/(WA + LA) ·100, were measured near the origin of the 4 segmental bronchi (RB1, LBI+2, RB10, LB10) using in-house software in Asan Medical Center. Quality of images and compliance to protocol in Penang center were verified by Asan Medical Center prior to commencement of scanning COPD study subjects.
Combined COPD assessment
Patients were categorized into Groups A–D according to GOLD 2017 classification (refer to GOLD 2017). The cut-off point between high and low risk of future exacerbation was based on previous reported hospitalized exacerbations of two times a year (ie, high risk of exacerbation when ≥2 times a year). The cut-off point between the “more” or “less” symptoms followed the GOLD recommendation of CAT of 10 and mMRC of 2 (whichever is higher) (ie, “more” symptoms when CAT ≥10 or mMRC ≥2).
Classification into CT-emphysema index/FEV1 phenotypes
Patients were categorized into “mild mixed airway- emphysema,” “airway-dominant,” “emphysema-dominant,” and “mixed airway-emphysema” disease based on CT-emphysema index at cut-off points of 15% (ie, ≥15% for emphysema) and post-BD FEV1 of 50% predicted normal (ie, FEV1 of ⩽50% predicted normal for airway-dominant).Citation11 Emphysema is normally considered present when >10% of pixels fall below the cut-off values of −910 or −920 HU, depending on slice thickness and the reconstruction algorithm employed.Citation20 We used 15% of −950 HU as cut-off to distinguish between emphysema and nonemphysema status in our Asian patients based on measurements derived from 48 healthy Korean nonsmokers that showed a −950 HU range between 0.15% and 13.25% with a mean of 4.66% (unpublished data). As such, we are confident that −950 HU values of <15% are compatible with no or trivial emphysema.Citation21,Citation22 A cut-off of FEV1 50% predicted normal is based on GOLD 2017 recommendation of severe airflow limitation when FEV1 is ⩽50% predicted (GOLD 2017 recommendation).
Statistical analysis
Standard descriptive analyses were performed on patient baseline characteristics. Kaplan–Meier survival estimates were performed to examine the probability of death with CT-emphysema index/FEV1 phenotypes and GOLD 2017 classification. Log rank tests were used to test for differences between groups. Univariate and multivariate Cox proportional hazards analyses were performed to investigate the associations of clinicodemographic indices and CT-emphysema index/FEV1 phenotypes with COPD-associated mortality. Proportional-hazards assumption tests were used to ensure that the variables fit the regression models. A p-value of ⩽0.05 was considered as statistical significant. All analyses were performed using Stata Version 13.1 (Stata Corporation, College Station, TX, USA).
Results
Baseline patient characteristics
One hundred and twenty-three patients were recruited. Three declined QCT. Eight subjects’ QCT data were not interpretable due to quality issues. Four subjects were lost to follow-up and their survival data were censored till the date of last follow-up visit (follow-up rate, 96.4%). Final analyzable data were based on 112 subjects. Their baseline characteristics are shown in . The cohort appeared to represent those with a more severe disease characterized by a mean FEV1 of 46% predicted normal, frequent exacerbations, and high treatment burden including home oxygen use.
Table 1 Baseline patient characteristics (n=112)
CT-emphysema index/FEV1 phenotypes and GOLD classification
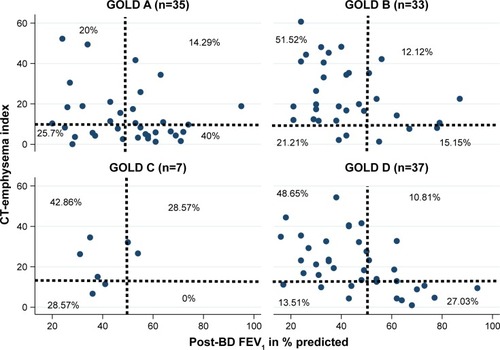
The number (percentage) of patients in each CT-emphysema index/FEV1 phenotype was as follows: 29 (25.9%) “mild mixed airway-emphysema” disease, 23 (20.5%) “airway-dominant,” 15 (13.4%) “emphysema-dominant,” and 45 (40.2%) “severe mixed airway-emphysema” disease. The number (percentage) of patients in each GOLD group was as follows: 35 (31.3%) Group A, 33 (29.5%) Group B, 7 (6.2%) Group C, and 37 (33%) Group D. The relation-ship between the proportion of patients according to GOLD classification and CT-emphysema index/FEV1 phenotypes are shown in a scatterplot (). Proportionately more patients of Groups B and D had “severe mixed airway-emphysema” disease while more patients of Group A had “mild mixed” disease.
Figure 1 Scatter plot showing relationships between CT-emphysema index/FEV1 COPD phenotypes and GOLD groups among patients (n=112).
Abbreviations: BD, bronchodilator; CT, computed tomography; FEV1, forced expiratory volume in 1 second; GOLD, Global Initiative for Chronic Obstructive Lung Disease.
Mortality data
The median follow-up time as of June 30, 2017 was 1,000 days (2 years and 9 months) (range, 60–1,400 days). Eighteen out of 112 (16%) died during this time. Causes of death were as follows: COPD (n=8), pneumonia (n=4), congestive cardiac failure/coronary artery disease (n=2), lung carcinoma (n=1), stroke (n=1), motor traffic accident (n=1), and intestinal obstruction (n=1). The final 2 causes were considered as non-COPD-associated causes. As such, 16 patients died of COPD-associated death (14.2%).
Kaplan–Meier survival estimates
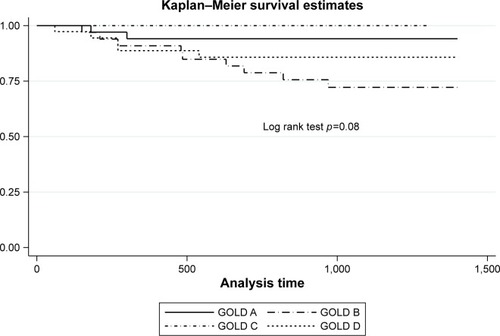
There was significant difference of survival estimates with CT-emphysema index/FEV1 phenotypes (p=0.03, log rank test) but not with GOLD classification (p=0.08). These are shown in and .
Figure 2 Kaplan–Meier survival probability estimates according to CT-emphysema index/FEV1 COPD phenotypes.
Abbreviations: CT, computed tomography; FEV1, forced expiratory volume in 1 second.
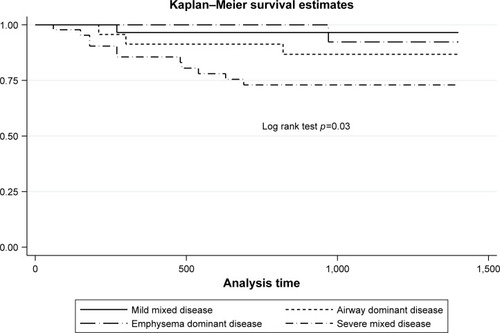
Figure 3 Kaplan–Meier survival probability estimates according to GOLD 2017 groups. Abbreviation: GOLD, Global Initiative for Chronic Obstructive Lung Disease.
Cox proportional hazards analyses on predictors of mortality
All demographic and clinical parameters were entered for univariate analyses. The parameters shown to predict mortality were age, BMI, use of long-term oxygen therapy (LTOT), FEV1, FVC, CAT score, SGRQ, CT-emphysema index, and “severe mixed airway-emphysema” disease (compared to “mild mixed” disease) ().
Table 2 Predictors in Cox proportional hazard models of COPD-associated mortality
All indices predictive of mortality on univariate analyses (except for LTOT) were entered into multivariate analyses to investigate the relationship between CT-emphysema index/FEV1 and mortality. LTOT was not selected as it is primarily a treatment outcome. CT-emphysema index and FEV1 are also not entered into the multivariate model as separate factors since they contribute to the CT-emphysema index/FEV1 phenotypes. Multivariate analyses showed that only age, BMI, and CAT score remained predictive of COPD-associate mortality (). In fact, the lack of change of hazard ratios of these three parameters indicates their independence with COPD-associated mortality.
Discussion
We explored the potential of a novel CT-emphysema index/FEV1 approach to predict COPD-associated mortality and showed in our cohort that “severe mixed airway-emphysema” had a higher mortality risk than “mild mixed” phenotype. The survival model seems to perform better than GOLD 2017 classification. However, only age, BMI, and CAT score were independently predictive of mortality in multivariate analyses. Our findings of age, BMI, and CAT score as independent predictors of COPD-associated mortality lend support to the existing bulk of evidence of their importance in prognosticating COPD.Citation2,Citation3
Our main study limitation is that our cohort size was not powered for mortality analysis. However, it is still plausible that we are encountering a genuine observation and that our current findings can be considered as hypothesis generating. Combining a morphology assessment with a physiologic parameter makes much clinical and research sense to help assess a complex disease like COPD. Our preliminary finding from a small local cohort may point toward the relevance of a certain “severe mixed airway-emphysema” disease that carries a worse prognosis. Together with the reports of Lee et al,Citation11 this novel QCT/FEV1 approach to phenotyping or subtyping COPD may be worth exploring further. Larger sample size studies are obviously necessary to validate this possibility. We hope to compare our findings with other COPD cohorts of the ANOLD network based on this CT-emphysema index/FEV1 approach.
Another important study limitation is that we only collected general data on comorbidities, which are not specific enough on severity (eg, those of cardiac failure or diabetes). This may bias our survival results. Also, it should be noted that the discriminative capacity of our QCT/FEV1 approach (over this period of follow-up) was limited to discriminating those with “severe mixed airway-emphysema” disease from “mild mixed” disease. The other 2 groups had either a different charted course or one in which QCT/FEV1 approach is not discriminative enough.
We also showed that there was generally a lack of correlation in the distribution of subjects classified under CT-emphysema index/FEV1 and GOLD 2017 groups. GOLD A group has proportionately more “mild mixed” disease, while GOLD B and D groups have proportionately more “severe mixed” disease. The latter may suggest a morphologic/physiologic similarity (ie, more emphysema and airflow obstruction) of GOLD B and D groups that explain their higher degree of symptoms (compared to A and C groups). This also supports a possible “severe mixed” disease as a relevant COPD phenotype. It is unclear what the prevalence of airway or emphysema-dominant or mixed disease in the general COPD population is. It is likely that its prevalence would vary according to the differing COPD populations and based on geography. In an epidemiology survey of over 1,400 Japanese COPD patients, Tatsumi et alCitation23 showed that 90% were of emphysema-dominant phenotype based on QCT. Some researchers have shown that emphysema-dominant disease is probably a COPD phenotype that is less responsive to both anti-inflammatory and bronchodilator therapy.Citation24 In our cohort, “emphysema-dominant” was the least common of the 4 phenotypes.
The mortality rate of COPD patients varies significantly depending on disease severity. In their review, Nishimura and TsukinoCitation25 suggested that the 5-year COPD mortality can be as high as 40%–70%, a figure that is similar to many malignancies.Citation25 The near 4-year absolute mortality rate attributable to COPD was around 14% in our cohort of moderate-to-severe COPD patients. Preliminary comparison with some ANOLD Asian sites suggests that the mortality rate of our cohort is considered high. This may be due to our COPD cohort having more severe disease.
At the time of writing, the GOLD 2018 guidelines have just been published. It acknowledges that the “ABCD” combined assessment performed no better than the earlier GOLD spirometric classification in predicting mortality or other health outcomes.Citation26 Despite this, they suggest that the “ABCD” assessment can still be used to provide therapeutic recommendations and also advised that spirometric assessment will remain vital for diagnosis and prognostication, considering other therapeutic approaches (eg, lung volume reduction surgery) as complement to the GOLD 2017 “ABCD” assessment tool (where FEV1 is dropped). This perhaps explains our observation of our CT-emphysema index/FEV1 model predicting mortality better than the GOLD 2017 model.
Acknowledgments
The authors wish to thank the National Institute of Health, Ministry of Health Malaysia, for the provision of research grant to conduct this study, and Loh Guan Lye Specialist Centre, Penang for providing the service of CT and blood collection for this research. This paper was presented at the 22nd Congress of the Asian Pacific Society of Respirology, Sydney, Australia, November 23–26, 2017 (Oral Presentation, “Late Breaking Findings” Session) and the abstract was published in Respirology. 2017;22(Suppl 3):70–71 (Abstract no AOL 012).
Disclosure
The authors report no conflicts of interest in this work.
References
- MathersCDLoncarDProjections of global mortality and burden of disease from 2002 to 2030PLoS Med20063e44217132052
- CelliBRPredictors of mortality in COPDRespir Med2010104677377920417082
- Global Initiative for Chronic Obstructive Lung Disease (GOLD)Global strategy for the diagnosis, management, and prevention of chronic obstructive pulmonary disease2017 Available from: http://goldcopd.org/gold-2017-global-strategy-diagnosis-management-prevention-copd/Accessed December 1, 2017
- CoxsonHOLeipsicJParragaGSinDDUsing pulmonary imaging to move chronic obstructive pulmonary disease beyond FEV1Am J Respir Crit Care Med2014190213514424873985
- MartinezCHChenYHWestgatePMCOPD Gene InvestigatorsRelationship between quantitative CT metrics and health status and BODE in chronic obstructive pulmonary diseaseThorax201267539940622514236
- LeivsethLBrumptonBMNilsenTILMaiXMJohnsenRLanghammerAGOLD classifications and mortality in chronic obstructive pulmonary diseaseThorax2013681091492123611880
- SorianoJBLamprechtBRamírezASMortality prediction in chronic obstructive pulmonary disease comparing the GOLD 2007 and 2011 staging systems: a pooled analysis of individual patient dataLancet Respir Med20153644345025995071
- LynchDAProgress in imaging COPD, 2004–2014Chronic Obstr Pulm Dis201411738228848813
- HarunaAMuroSNakanoYCT scan findings of emphysema predict mortality in COPDChest2010138363564020382712
- SchroederJDMcKenzieASZachJARelationships between air-flow obstruction and quantitative CT measurements of emphysema, air trapping, and airways in subjects with and without chronic obstructive pulmonary diseaseAJR Am J Roentgenol20132013460470
- LeeJHLeeYKKimEKResponses to inhaled long-acting beta-agonist and corticosteroid according to COPD subtypeRespir Med2010104454254919926461
- LohLCOhYMLeeSDANOLD ResearchersAsian Network for Obstructive Lung Disease (ANOLD)-COPD from an Asian perspectiveQJM20151081292192226025690
- JonesPWQuirkFHBaveystockCMThe St George’s respiratory questionnaireRespir Med199185Suppl B25311759018
- CelliBRCoteCGMarinJMThe body-mass index, airflow obstruction, dyspnea, and exercise capacity index in chronic obstructive pulmonary diseaseN Engl J Med2004350101005101214999112
- JonesPWHardingGBerryPWiklundIChenWHKline LeidyNDevelopment and first validation of the COPD Assessment TestEur Respir J20093464865419720809
- CharlsonMEPompeiPAlesKLMacKenzieCRA new method of classifying prognostic comorbidity in longitudinal studies: development and validationJ Chronic Dis19874053733833558716
- American Thoracic SocietyStandardization of spirometry, 1994 updateAm J Respir Crit Care Med19951523110711367663792
- LeeYKOhYMLeeJHKOLD Study GroupQuantitative assessment of emphysema, air trapping, and airway thickening on computed tomographyLung2008186315716518351420
- YooJWHongYSeoJBComparison of clinicophysiologic and CT imaging risk factors for COPD exacerbationJ Korean Med Sci201126121606161222147998
- FriedmanPJImaging studies in emphysemaProc Am Thorac Soc2008549450018453361
- BoschettoPMiniatiMMoiottoDPredominant emphysema phenotype in chronic obstructive pulmonary disease patientsEur Respir J200321345045412662000
- MiniatiMFilippiEFalaschiFRadiologic evaluation of emphysema in patients with chronic obstructive pulmonary disease: chest radiography versus high resolution computed tomographyAm J Respir Crit Care Med19951515135913677735585
- TatsumiKKasaharaYKurosuKRespiratory Failure Research Group in JapanClinical phenotypes of COPD: results of a Japanese epidemiological surveyRespirology20049333133615363004
- MiravitllesMCalleMSoler-CataluñaJJClinical phenotypes of COPD: identification, definition and implications for guidelinesArch Bronconeumol2012483869822196477
- NishimuraKTsukinoMClinical course and prognosis of patients with chronic obstructive pulmonary diseaseCurr Opin Pulm Med20006212713210741772
- Global Initiative for Chronic Obstructive Lung Disease (GOLD)2018Global strategy for prevention, diagnosis and management of COPD2018 Available from: http://goldcopd.org/wp-content/uploads/2017/11/GOLD-2018-v6.0-FINAL-revised-20-Nov_WMS.pdfAccessed January 10, 2018