
Abstract
Background
Asthma–COPD overlap (ACO) is difficult to diagnose because it is characterized by persistent airflow limitation, and patients present with several manifestations that are usually associated with both asthma and COPD. In this retrospective study, we aimed to evaluate the diagnostic accuracy of fractional exhaled nitric oxide (FeNO) and blood eosinophil counts for the clinical diagnosis of ACO.
Patients and methods
A total of 121 patients were divided into two study groups, COPD alone or ACO, which was based on criteria from the joint document by the Global Initiative for Asthma and the Global initiative for chronic Obstructive Lung Disease. From July 2014 to April 2017, FeNO levels and blood eosinophil counts were measured in specimens from patients naïve to inhaled corticosteroids (ICS) and those using ICS. Receiver operating characteristic curve analysis was used to determine the cutoff values of FeNO and blood eosinophil levels that provided the best differential diagnosis between ACO and COPD.
Results
Among a total of 121 patients, 65 patients were diagnosed with COPD and 56 patients with ACO. The FeNO level was higher in patients with ACO than in patients with COPD (median 24.5 vs 16.0 ppb, respectively; P<0.01). Among patients naïve to ICS, the area under the receiver operating characteristic curve of FeNO values was 0.726, and the optimal diagnostic cutoff level of FeNO was 25.0 ppb, with 60.6% sensitivity and 87.7% specificity for differentiating ACO from COPD. FeNO (≥25.0 ppb) combined with blood eosinophil counts (≥250/μL) showed 96.1% specificity.
Conclusion
These results demonstrate that the FeNO level combined with blood eosinophil count is useful for the differential diagnosis between ACO and COPD.
Introduction
Asthma–COPD overlap (ACO) is characterized by persistent airflow limitation and several manifestations usually associated with both asthma and COPD.Citation1 There is broad agreement that patients with ACO have worse outcomes than patients with COPD or asthma alone, unless they receive adequate treatment, which includes inhaled corticosteroids (ICS).Citation2,Citation3 Although the Global Initiative for Asthma (GINA) and the Global initiative for chronic Obstructive Lung Disease (GOLD) proposed a stepwise approach for the diagnosis of ACO,Citation1 the diagnostic criteria were based on syndromic features and lacked objective indicators, such as results from lung function testing, imaging, and testing for inflammatory biomarkers. A GINA/GOLD document on ACO recommended that both fractional exhaled nitric oxide (FeNO) and blood eosinophils be used as inflammatory biomarkers for differentiating ACO from COPD.Citation1
Although previous studies have reported that FeNOCitation4–Citation6 and blood eosinophil levelsCitation4 were good parameters for differentiating between ACO and COPD, several limitations were identified. First, ACO was not defined according to the universally accepted definition.Citation5,Citation6 Second, these studiesCitation4–Citation6 included patients receiving ICS, which affect FeNO levelsCitation7,Citation8 and blood eosinophil counts.Citation9 Taking these limitations into account, we performed a retrospective study that aimed to evaluate the diagnostic accuracy of FeNO levels and blood eosinophil counts for the clinical diagnosis of ACO.
Patients and methods
Patient population
Patients with COPD who underwent FeNO testing at Kochi Medical School Hospital from July 2014 to April 2017 were retrospectively enrolled in this study. COPD patients were diagnosed according to the following GOLD criterion: a forced expiratory volume in 1 second/forced vital capacity ratio of <0.70 after bronchodilator use. Subjects were excluded if they had used oral corticosteroids during the previous 4 weeks. The ethical review board of Kochi Medical School approved this study protocol and waived written informed consent from patients, because this was a noninterventional trial and the study was retrospective (approval number: 29-124). We confirmed that the patient confidentiality in this study was maintained.
Methods
Patients were divided into two study groups, COPD alone and ACO according to syndromic and spirometric features of the ACO from the GINA/GOLD joint document.Citation1 The features of the ACO took into consideration the following general categories: age at onset, pattern of symptoms, lung function, patient or family history, time course, and chest X-ray. Participants in this study fulfilled three or more features of COPD. Among patients with COPD, we further identified ACO patients as those with three or more features of asthma as follows: onset before age 20 years, family history of asthma or allergic rhinitis or eczema, normal findings on chest X-rays without severe hyperinflation, common time course in asthmatic patients, variable respiratory symptoms, and variable expiratory airflow limitation. The common time course included spontaneous improvement and immediate response to bronchodilator or to ICS over weeks. Variable respiratory symptoms included wheezing and shortness of breath that varied over minutes, hours, or days and worsened during the night or early morning. Variable expiratory airflow limitation was defined as improvement in forced expiratory volume in 1 second ≥200 mL and ≥12% from baseline immediately after the use of a bronchodilator or several weeks after the use of ICS. We evaluated these diagnostic features, which were extracted from the patients’ medical records.
Inflammatory biomarkers
FeNO was measured using the NIOX MINO device (Aerocrine AB, Solna, Sweden), according to the recommendations of the American Thoracic Society/European Respiratory Society.Citation10 FeNO results are reported as parts per billion (ppb).
Blood eosinophil counts were determined from peripheral blood samples; absolute blood eosinophil counts are reported as cells/μL. Blood eosinophil counts were acquired from 110 of the 121 patients enrolled in this study.
Data on these biomarkers were extracted from the patients’ medical records. In patients who were measured for these biomarkers before and after the use of ICS, we extracted data at any two time points.
Statistical analysis
Data are shown as medians (interquartile range) or mean ± SD, unless otherwise specified. Differences between groups were assessed by the Mann–Whitney U test and Fisher’s exact test. The relationship between FeNO levels and blood eosinophil counts was assessed by determining Spearman’s rank correlation coefficients. Receiver operating characteristic (ROC) curve analysis with measurements of area under the curve (AUC) was used to evaluate the diagnostic value of FeNO and blood eosinophil levels for differentiating ACO from COPD. We performed the analysis with different cutoff values for FeNO and blood eosinophils, and an optimal cutoff value was obtained from the highest value for the sum of sensitivity and specificity. All statistical analyses were performed with EZR software (Saitama Medical Center, Jichi Medical University, Saitama, Japan), a graphical user interface for R (The R Foundation for Statistical Computing, Vienna, Austria). Briefly, the EZR software is a modified version of R commander that was designed to add statistical functions frequently used in biostatistics.Citation11 P-values <0.05 were considered significant.
Results
Characteristics of the study patients
A total of 121 patients were enrolled in this study. According to the diagnostic criteria, 65 (53.7%) patients had COPD alone and 56 (46.3%) patients had ACO. The characteristics of the study patients are shown in . Patients with ACO had fewer tobacco smoking pack-years (P=0.048) than patients with COPD. In addition, the proportion of patients with ACO who were treated with ICS at the time of FeNO measurement was higher than the proportion of patients with COPD treated with ICS at the time of FeNO measurement (41.1% vs 12.3%, respectively; P<0.001). The difference between the frequency of comorbidities in patients with COPD and ACO was not significant.
Table 1 Characteristics of the study patients (N=121)
Inflammatory biomarkers in patients with COPD and ACO
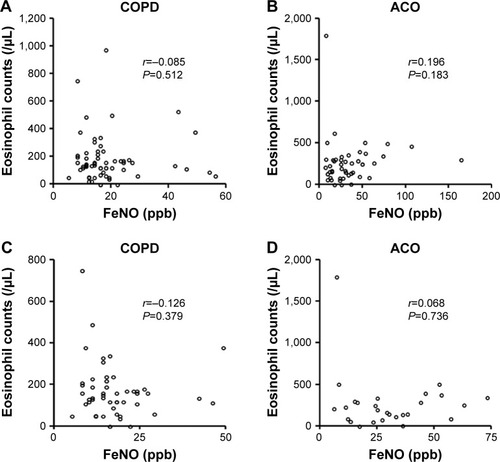
The FeNO levels were higher in patients with ACO than in patients with COPD (median 24.5 ppb [14.0–39.5 ppb] vs 16.0 ppb [12.0–20.0 ppb], respectively; P<0.01). Among patients naïve to ICS, the difference between the FeNO levels of the two patient groups (median 27.0 ppb [15.0–44.0 ppb] vs 15.0 ppb [11.0–19.0 ppb]; P<0.001) was notable when compared to the differences between all patients in the two groups. The difference between the FeNO levels of patients being treated with ICS in both the ACO and COPD groups was not significant (median 21.0 ppb [12.5–35.0 ppb] vs 19.0 ppb [15.3–31.5 ppb], respectively; P=0.95; ). In addition, among current smokers, the FeNO levels were higher in patients with ACO than in patients with COPD (median 24.0 ppb [13.8–39.3 ppb] vs 14.0 ppb [9.5–16.0 ppb], respectively; P<0.05). Similarly, the blood eosinophil counts were higher in patients with ACO than in patients with COPD (median 240.0 cells/μL [127.5–310.0 cells/μL] vs 138.0 cells/μL [90.0–207.5 cells/μL], respectively; P<0.05). However, among patients treated with ICS, the difference between the blood eosinophil counts of the patients in each group was not significant (). Moreover, FeNO levels were significantly reduced from a baseline median value of 36.0 ppb (25.0–46.0 ppb) to 21.0 ppb (15.0–36.0 ppb) after ICS treatment (P<0.05; ). The median treatment duration of ICS in patients whose FeNO levels are shown in was 18 weeks. In addition, blood eosinophil counts were also significantly reduced from a median baseline value of 294.0 cells/μL (177.5–347.5 cells/μL) to 185.0 cells/μL (120.0–269.5 cells/μL) after ICS treatment (P<0.05; ). The median treatment duration of ICS in patients whose eosinophil counts are shown in was 23 weeks. Although both FeNO levels and blood eosinophil counts were higher in patients with ACO than in patients with COPD, the correlations between FeNO levels and blood eosinophil counts in patients with either COPD or ACO were not significant ().
Figure 1 Inflammatory biomarkers in patients with COPD and ACO.
Notes: (A) FeNO levels, (B) blood eosinophil counts. Data are shown as medians (interquartile range). Differences between groups were assessed by the Mann–Whitney U test.
Abbreviations: ACO, asthma–COPD overlap; FeNO, fractional exhaled nitric oxide; ICS, inhaled corticosteroids; ICS treatment (−), patients naïve to ICS; ICS treatment (+), patients treated with ICS.
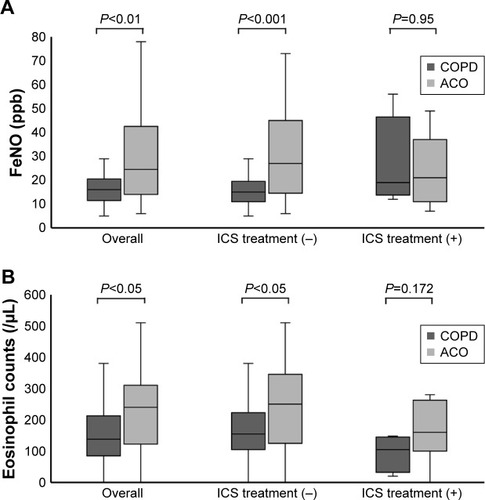
Figure 2 Effects of ICS on FeNO levels and blood eosinophil counts in patients with ACO.
Notes: (A) FeNO levels, (B) blood eosinophil counts. Data are shown as medians (interquartile range). The median treatment duration of ICS was 18 weeks (A) and 23 weeks (B). Differences between groups were assessed by the Mann–Whitney U test.
Abbreviations: ACO, asthma–COPD overlap; FeNO, fractional exhaled nitric oxide; ICS, inhaled corticosteroids; post-ICS, after ICS treatment; pre-ICS, before ICS treatment.
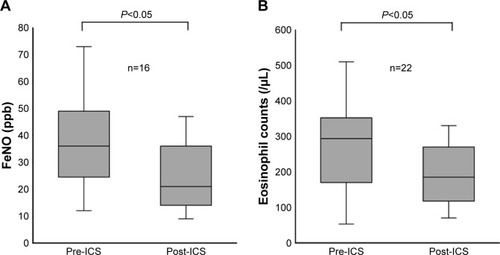
Figure 3 Correlation of FeNO levels with blood eosinophil counts in patients with COPD and ACO.
Abbreviations: ACO, asthma–COPD overlap; FeNO, fractional exhaled nitric oxide; ICS, inhaled corticosteroids.
Diagnostic accuracy of biomarkers
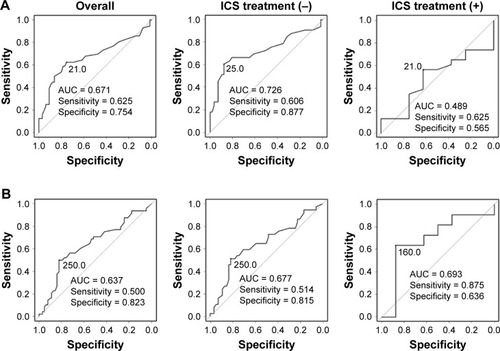
ROC curve analysis demonstrated that 21.0 ppb was the best diagnostic cutoff value of FeNO for differentiating ACO from COPD (AUC: 0.671). The sensitivity and specificity at 21.0 ppb for the diagnosis of ACO were 62.5% and 75.4%, respectively. Among patients naïve to ICS, the AUC for FeNO was calculated to be 0.726, and the optimal diagnostic cutoff level was 25.0 ppb, with 60.6% sensitivity and 87.7% specificity for differentiating ACO from COPD (). On the other hand, ROC curve analysis demonstrated that 250 cells/μL was the best cutoff value for blood eosinophil counts in differentiating ACO from COPD. However, the AUC for blood eosinophil counts was relatively low, even among patients naïve to ICS (). Unlike blood eosinophil counts, FeNO was thought to be useful for differentiating ACO from COPD, especially among patients naïve to ICS.
Figure 4 ROC curve for FeNO levels and blood eosinophil counts for differentiating ACO from COPD.
Abbreviations: ACO, asthma–COPD overlap; AUC, area under the curve; FeNO, fractional exhaled nitric oxide; ICS, inhaled corticosteroids; ICS treatment (−), patients naïve to ICS; ICS treatment (+), patients treated with ICS; ROC, receiver operating characteristic.
Diagnostic accuracy of FeNO levels and blood eosinophil counts combined
We examined the diagnostic accuracy of FeNO levels combined with blood eosinophil counts, since each biomarker showed relatively low sensitivity and specificity. The combination of an FeNO level ≥21.0 ppb and a blood eosinophil count ≥250 cells/μL showed 35.4% sensitivity and 96.8% specificity. Among patients naïve to ICS, an FeNO level ≥21.0 ppb plus a blood eosinophil count ≥250 cells/μL showed 25.9% sensitivity and 96.1% specificity (). These data show that the biomarkers combined led to increased specificity and decreased sensitivity for the diagnosis of ACO compared to the use of either biomarker alone.
Table 2 Diagnostic accuracy of the biomarkers
Discussion
We performed a retrospective study to assess whether inflammatory biomarkers were useful for the diagnosis of ACO. ROC curve analysis demonstrated that 25.0 ppb was the best diagnostic cutoff level of FeNO, with 60.6% sensitivity and 87.7% specificity for differentiating ACO from COPD in patients naïve to ICS. In addition, an FeNO level ≥25.0 ppb combined with a blood eosinophil count ≥250 cells/μL showed high specificity (96.1%). The results of this study demonstrate the utility of FeNO and blood eosinophils for the differential diagnosis of ACO in a population of patients with COPD.
Previous studiesCitation4–Citation6 demonstrated the inflammatory biomarkers FeNO and blood eosinophil counts supported the diagnosis of ACO. Chen et alCitation6 reported that the best diagnostic cutoff level of FeNO was 22.5 ppb, with 70.2% sensitivity and 75.0% specificity for differentiating ACO from COPD. In addition, Kobayashi et alCitation4 reported that an FeNO level (≥23.0 ppb) combined with a blood eosinophil count (≥156.2 cells/μL) showed 59.5% sensitivity and 85.5% specificity for the diagnosis of ACO. However, the diagnosis of ACO was not performed using the universally accepted definitionCitation5,Citation6 and patients using ICS were not excluded from these studies.Citation4–Citation6 In our study, we used the universally accepted definition in the GINA/GOLD joint documentCitation1 to perform the diagnosis of ACO.
This study clearly demonstrated that FeNO levels and/or blood eosinophil counts should be used for differentiating ACO from COPD in patients naïve to ICS treatment, but not in patients using ICS. We believe that this distinction is the primary strength of our study. ICS treatment is known to decrease FeNO levels in patients with asthma.Citation7,Citation8 Our study found that FeNO levels were decreased in patients with ACO after ICS treatment, which could account for the low diagnostic value of FeNO in the diagnosis of ACO in patients being treated by ICS.
Interestingly, the correlations between FeNO levels and blood eosinophil counts in patients with either COPD or ACO were not significant. In patients with asthma, a weak-to-moderate correlation has been observed between FeNO levels and eosinophil counts in blood or sputum.Citation12,Citation13 On the other hand, FeNO levels and blood eosinophil counts were each found to be independently associated with wheezing and asthmatic events,Citation14 which suggests that FeNO and blood eosinophils, respectively, relate to two different inflammatory pathways, interleukin (IL)-4- and IL-13-mediated pathwaysCitation15 and the IL-5-mediated pathway.Citation16 Our study found that the FeNO level combined with a blood eosinophil count showed high specificity for the diagnosis of ACO. We speculate that the use of two types of inflammatory biomarkers with different properties led to increased diagnostic specificity for the ACO.
ICS play a central role in the treatment of ACO because the asthmatic component of T helper 2 cell-mediated airway inflammation is observed in patients with ACO. However, previous studies have reported that ICS treatment was associated with an increased risk of pneumonia in patients with COPD.Citation17,Citation18 Therefore, ICS should not be used in patients without an asthmatic component. Our study found that the combination of FeNO (≥25.0 ppb) and blood eosinophil counts (≥250 cells/μL) showed high specificity (96.1%) for differentiating ACO from COPD. This combination of cutoff values, which showed such high specificity, could be useful for preventing the inappropriate use of ICS in patients without an asthmatic component.
This was a retrospective study with several limitations. First, current smoking has been reported to reduce FeNO levels.Citation19 In our study, the number of smoking pack-years of patients with ACO was lower than that of patients with COPD (P=0.048). Although the FeNO levels of ACO patients were higher than those of COPD patients, even among current smokers, the smoking history might have affected the difference between the FeNO levels of the two groups. Second, the FeNO level has been reported to be increased in patients with allergic rhinitis.Citation19 We could not determine if the coexistence of allergic rhinitis affected the FeNO levels of the patients in our study. Third, FeNO levelsCitation20 in healthy adults and blood eosinophil countsCitation21 in the general population have been reported to be higher for males than for females. In the present study, there was a higher proportion of male patients than female patients in both the COPD and ACO groups. Additional detailed examinations are required for the diagnosis of ACO.
Conclusion
The results of this study demonstrated that the inflammatory biomarkers FeNO and blood eosinophils can support the diagnosis of ACO. The primary strengths of our study were that ACO was defined according to the universally accepted criteria in the joint GINA/GOLD document and that this study evaluated patients naïve to ICS as well as patients using ICS. For patients naïve to ICS, an FeNO level ≥25.0 ppb combined with a blood eosinophil count ≥250 cells/μL showed high specificity (96.1%) for differentiating ACO from COPD. Treatment with ICS could be useful for patients who satisfy the criteria of an FeNO level ≥25.0 ppb and a blood eosinophil count ≥250 cells/μL.
Disclosure
The authors report no conflicts of interest in this work.
References
- Global Initiative for Asthma, Global Initiative for Chronic Obstructive Lung DiseaseDiagnosis of Disease of Chronic Airflow Limitation: Asthma, COPD, and Asthma–COPD Overlap Syndrome (ACOS) Available from: http://www.ginasthma.org/local/uploads/files/ACOS_2015.pdfAccessed February 20, 2018
- HardinMSilvermanEKBarrRGThe clinical features of the overlap between COPD and asthmaRespir Res20111212721951550
- SilvaGESherrillDLGuerraSBarbeeRAAsthma as a risk factor for COPD in a longitudinal studyChest20041261596515249443
- KobayashiSHanagamaMYamandaSIshidaMYanaiMInflammatory biomarkers in asthma–COPD overlap syndromeInt J Chron Obstruct Pulmon Dis2016112117212327660429
- GotoTCamargoCAHasegawaKFractional exhaled nitric oxide levels in asthma–COPD overlap syndrome: analysis of the National Health and Nutrition Examination Survey, 2007–2012Int J Chron Obstruct Pulmon Dis2016112149215527660432
- ChenFJHuangXYLiuYLLinGPXieCMImportance of fractional exhaled nitric oxide in the differentiation of asthma–COPD overlap syndrome, asthma, and COPDInt J Chron Obstruct Pulmon Dis2016112385239027713629
- IchinoseMTakahashiTSugiuraHBaseline airway hyperresponsiveness and its reversible component: role of airway inflammation and airway calibreEur Respir J200015224825310706487
- KharitonovSAYatesDHBarnesPJInhaled glucocorticoids decrease nitric oxide in exhaled air of asthmatic patientsAm J Respir Crit Care Med199615314544578542158
- EvansPMO’ConnorBJFullerRWBarnesPJChungKFEffect of inhaled corticosteroids on peripheral blood eosinophil counts and density profiles in asthmaJ Allergy Clin Immunol19939126436508436777
- DweikRABoggsPBErzurumSCAn official ATS clinical practice guideline: interpretation of exhaled nitric oxide levels (FENO) for clinical applicationsAm J Respir Crit Care Med2011184560261521885636
- KandaYInvestigation of the freely available easy-to-use software ‘EZR’ for medical statisticsBone Marrow Transplant201348345245823208313
- StrunkRCSzeflerSJPhillipsBRRelationship of exhaled nitric oxide to clinical and inflammatory markers of persistent asthma in childrenJ Allergy Clin Immunol2003112588389214610474
- MattesJStorm van’s GravesandeKReiningUNO in exhaled air is correlated with markers of eosinophilic airway inflammation in corticosteroid-dependent childhood asthmaEur Respir J19991361391139510445617
- MalinovschiAFonsecaJAJacintoTAlvingKJansonCExhaled nitric oxide levels and blood eosinophil counts independently associate with wheeze and asthma events in National Health and Nutrition Examination Survey subjectsJ Allergy Clin Immunol2013132482182723890753
- AlvingKMalinovschiABasic aspects of exhaled nitric oxideEuropean Respiratory Society Monograph201049131
- StirlingRGvan RensenELBarnesPJChungKFInterleukin-5 induces CD34(+) eosinophil progenitor mobilization and eosinophil CCR3 expression in asthmaAm J Respir Crit Care Med20011648 Pt 11403140911704586
- DrummondMBDasenbrookECPitzMWMurphyDJFanEInhaled corticosteroids in patients with stable chronic obstructive pulmonary disease: a systematic review and meta-analysisJAMA2008300202407241619033591
- SinghSAminAVLokeYKLong-term use of inhaled corticosteroids and the risk of pneumonia in chronic obstructive pulmonary disease: a meta-analysisArch Intern Med2009169321922919204211
- MatsunagaKHiranoTAkamatsuKExhaled nitric oxide cutoff values for asthma diagnosis according to rhinitis and smoking status in Japanese subjectsAllergol Int201160333133621502803
- MatsunagaKHiranoTKawayamaTReference ranges for exhaled nitric oxide fraction in healthy Japanese adult populationAllergol Int201059436336720864792
- LewisSAPavordIDStringerJRThe relation between peripheral blood leukocyte counts and respiratory symptoms, atopy, lung function, and airway responsiveness in adultsChest2001119110511411157591