
Abstract
Background
The role of airway microbiota in COPD is highly debated. Symptomology assessment is vital for the management of clinically stable COPD patients; however, the link between symp toms and the airway microbiome is currently unknown.
Purpose
The present study aimed to evaluate the relationship among stable COPD patients.
Patients and methods
We conducted pyrosequencing of bacterial 16S rRNA using induced sputum samples in a Han Chinese cohort that included 40 clinically stable COPD patients and 19 healthy controls.
Results
Alterations in community composition and core bacte rial taxa (Neisseria subflava, etc.) were observed in patients with severe symptoms compared with controls. The co-occurrence network indicated that the key microbiota enriched in COPD patients showed higher expression in patients with severe symptoms. The association pattern of symptoms with the sputum microbiome was obviously different from that of lung function in COPD patients.
Conclusion
These findings broaden our insights into the relationship between the sputum microbiota and the symptom severity in COPD patients, emphasizing the role of symptoms in the airway microbiome, independent of lung function.
Introduction
COPD is a chronic inflammatory lung disorder that is characterized by irreversible airflow limitation and remains a major public health problem.Citation1 Cigarette smoking is the principal cause of COPD, but only ~15% of adults with substantial tobacco exposure develop clinical COPD.Citation2,Citation3 Bacterial colonization or infection is also considered to be an important factor in COPD.Citation4 Traditional culture-based strategies have demonstrated that bacteria such as Haemophilus influenzae, Streptococcus pneumoniae, and Moraxella catarrhalis may be a key etiological factor exacerbating COPD;Citation5–Citation7 however, the role of microorganism in clinically stable patients remains unclear, although some studies indicated that their presence may contribute to chronic inflammation in the airway.Citation8
In recent years, numerous researchers have revealed the relationship between the lung microbiome and COPD using culture-independent sequencing techniques, such as 16S rRNA pyrosequencing.Citation9–Citation12 These studies strongly emphasized microbial complexity and the significant heterogeneity among COPD patients.Citation9–Citation13 This intersubject variation may be caused by the severity of lung function and patient exacerbation status.Citation14–Citation20 However, the heterogeneity of COPD cannot be fully explained by these factors.Citation21,Citation22 Symptomology assessment is vital for the management of clinically stable COPD patients; however, the relationship between symptoms and the airway microbiome is currently unknown.Citation1
Here, we conducted 16S rRNA-based pyrosequencing to evaluate the relationship between the sputum microbiota and the COPD symptoms in a Han Chinese population. We reported symptom-related bacterial taxa and their relationships with lung function in COPD patients.
Patients and methods
Subjects and study design
This study (NCT3310164) was approved by the Peking University Institutional Review Board (PUIRB, identifier: IRB00001052-11067) and was strictly conducted according to the designed protocols. Written informed consent was obtained from all participants.
Outpatients with COPD (n=40) were enrolled in the clinic of Peking University Third Hospital. The inclusion criteria have been previously depicted,Citation23,Citation24 and the brief description was shown as follows: 1) males 40–80 years of age; 2) a smoking history of >10 pack-years; 3) diagnosis of COPD according to the Global Initiative for Obstructive Lung Disease (GOLD);Citation1,Citation25 4) lack of exacerbation events or use of systemic antibiotics within the past 3 months; and 5) lack of severe organ dysfunction or active disease. The control group (n=19) consisted of male smokers without COPD.
A spirometry test was performed in all subjects using a ventilator (SensorMedics, Yorba Linda, CA, USA). The predicted percent of forced expiratory volume in 1 second (FEV1%pred) was used to evaluate the severity of lung function, as follows: GOLD I, FEV1%pred >80%; GOLD II, 80%> FEV1%pred ≥50%; GOLD III, 50%> FEV1%pred ≥30%; and GOLD IV, FEV1%pred <30%. The ratio of residual volume to total lung capacity (RV/TLC) was used to assess the degree of emphysema. The symptoms of COPD patients were quantified with the St George’s Respiratory Questionnaire (SGRQ): SGRQ score of <25 was considered to indicate “mild symptoms”, and SGRQ score of ≥25 was considered to indicate “severe symptoms”. The cutoff value (SGRQ=25) was equal to the threshold 10 for the COPD Assessment Test (CAT).Citation1,Citation26 Information regarding age, body mass index (BMI), smoking history, bronchodilators, inhaled corticosteroids (ICSs), exacerbation history in the past 1 year, and comorbidities (hypertension and diabetes) was also collected using questionnaires.
Sample collection
The subjects were required to stop smoking and stop using corticosteroids and bronchodilators for at least 12 hours prior to sample collection. The sputum induction was performed by an experienced technician under the supervision of a physician. The mouth and posterior oropharynx were rinsed by swishing and gargling with normal saline three times. Then, the subjects received an ultrasonic nebulizer inhalation of 3% hypertonic saline for up to 20 minutes before coughing up sputum until a volume of at least 1 mL was collected. The collected samples were stored at −80°C prior to DNA extraction.
Bacterial DNA extraction, polymerase chain reaction (PCR) amplification, and pyrosequencing
The samples were treated with an equal volume of 0.1% dithiothreitol (Calbiochem, La Jolla, CA, USA) for 15 minutes and aliquoted into sterile Eppendorf tubes. After centrifugation at 13,000× g for 15 minutes, bacterial DNA was extracted from the cell pellets of the aliquoted samples (500 μL) with a DNA extraction kit (Qiagen, Hilden, Germany) based on a modified protocol.Citation27 The DNA from sterile water and acute exacerbation (AE) buffer were collected as a potential source of contamination. The total copy number of the 16S rDNA was quantified through real-time PCR (Thermo Fisher Scientific, Waltham, MA, USA).Citation9 PCR amplification and pyrosequencing were conducted at BGI (Shenzhen, China) according to the protocols supplied by the laboratory of GBH.Citation9 Briefly, the V3–V5 region of the 16S rRNA gene was amplified by PCR using the universal primers 907R (5′-CCGTCAATTCMTTTGAGTTT-3′) and 338F (5′-ACTCCTACGGGAGGCAGCAG-3′), with specific 10-digit barcodes for each sample. The purified amplicons were sequenced with the Roche 454 platform (Roche Applied Science, Basel, Switzerland).
Microbiome analyses
Mothur software (version 1.38.1, University of Michigan, Ann Arbor, MI, USA) was used to process the raw sequencing data, as described elsewhere.Citation28 Briefly, we allowed one mismatch to the sample barcode and two mismatches to the adjacent primer. These filtered sequences were aligned through a SILVA-based (version 128) reference database. Chimeric sequences were eliminated with the UCHIME command. The processed sequences were classified with Ribosomal Database Project training set 16.0. Finally, high-quality sequences were annotated to operational taxonomic units (OTUs) at a 3% distance cutoff.
Statistical analysis
To determine the spatial separation of bacterial communities between groups, principal coordinate analysis was plotted with the Bray–Curtis distance matrix. In addition, permutational multivariate analysis of variance (PERMANOVA) with the Bray–Curtis distance matrix was used to quantify differences in community composition. The mean abundance of OTUs was compared between groups through a Welch’s t-test or through ANOVA with Tukey’s post hoc test as appropriate. Categorical variables were compared between groups by Fisher’s exact test. The associations between OTUs and clinical information were evaluated with Spearman’s coefficient. The co-occurrence network was built with Cytoscape (version 3.5.1). Spearman’s coefficient of >0.5 was defined as “co-occurrence”, and Spearman’s coefficient of <−0.5 was defined as “mutual exclusion”. A P-value of <0.05 was defined as statistically significant. All statistical analyses were performed in R software (version 3.4.0).
Results
Study demographics
A total of 59 smokers were enrolled in this study, with 19 healthy controls and 40 COPD patients. The COPD patients were divided into two subgroups: “mild symptoms” (SGRQ <25) and “severe symptoms” (SGRQ ≥25). Age, BMI, smoking history, exacerbation (≥2), medication, and comorbidities were similar between the groups, as summarized in .
Table 1 Baseline data of participants
Shifted community composition in COPD patients with severe symptoms
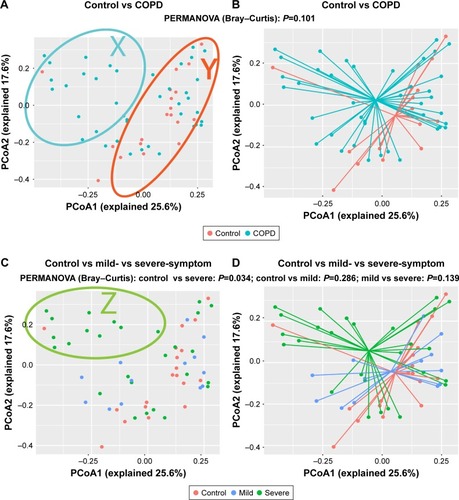
shows a huge heterogeneity among COPD patients. The patients in the X-zone were obviously different from the controls, but the patients in the Y-zone were similar to the controls. We observed a separation trend only between COPD patients and the controls, as presented in , but this trend was not statistically significant (P=0.101, PERMANOVA). We found that the patients in the Z-zone had severe symptoms (SGRQ >25) and markedly different from controls, as shown in . Accordingly, patients with severe symptoms were significantly different from controls (P=0.034, PERMANOVA), and no difference was observed between patients with mild symptoms and controls (P=0.286, PERMANOVA), as illustrated in . These results suggested that the observed intersubject heterogeneity may be partly explained by the symptom severity of COPD patients.
Figure 1 Community composition is shifted in COPD patients with severe symptoms.
Abbreviations: PCoA, principal coordinate analysis; PERMANOVA, permutational multivariate analysis of variance; SGRQ, St George’s Respiratory Questionnaire.
The PERMANOVA model, which corrected for spirometry severity, the use of ICS or bronchodilators, and comorbidity history (hypertension and diabetes) confirmed the previous univariate PERMANOVA findings, as shown in Table S1. The community composition was not shifted in patients with different severities of lung function and was not affected by the use of ICS, as presented in Figures S1 and S2, respectively.
Relative abundance of OTUs is altered in COPD patients with severe symptoms
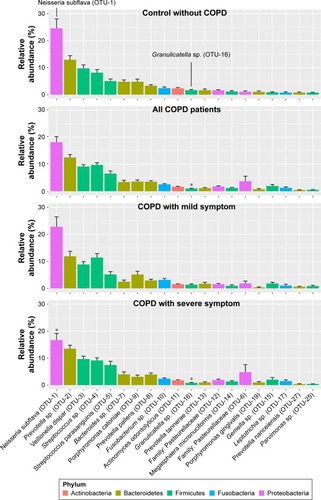
To identify the key microbial drivers, we plotted a rank curve of the top 20 OTUs and analyzed abundance differences between groups, as shown in . Compared with the controls, Granulicatella sp. (OTU-16) was reduced in all patients and in the group of patients with severe symptoms. In addition, Neisseria subflava (OTU-1) was reduced only in patients with severe symptoms but was not altered in all COPD patients. These findings suggested that decreased Granulicatella sp. and N. subflava may be the main contributors to the community discrepancy between patients with severe symptoms and controls. The two bacteria were not detected in sterile water or AE buffer, as shown in Figure S3, demonstrating that they did not originate from contamination.
Figure 2 Relative abundance of OTUs is altered in COPD patients with severe symptoms.
Abbreviations: ANOVA, analysis of variance; OTU, operational taxonomic unit; SEM, standard error of the mean; SGRQ, St George’s Respiratory Questionnaire.
Interaction of OTUs enriched in controls and COPD patients
depicts the interaction between control- and COPD-enriched OTUs. The blue and red edges represent co-occurrence and mutual exclusion, respectively. The size of the nodes (OTUs) is proportional to the degree of connectivity. Larger nodes are highly connected with other nodes and may play a more important role in the whole network. Overall, microbial co-occurrence is present within individual groups, and microbial mutual exclusion is present between control- and COPD-enriched groups.
Figure 3 Interaction of OTUs enriched in controls and COPD patients.
Abbreviations: ANOVA, analysis of variance; OTU, operational taxonomic unit; SGRQ, St George’s Respiratory Questionnaire.
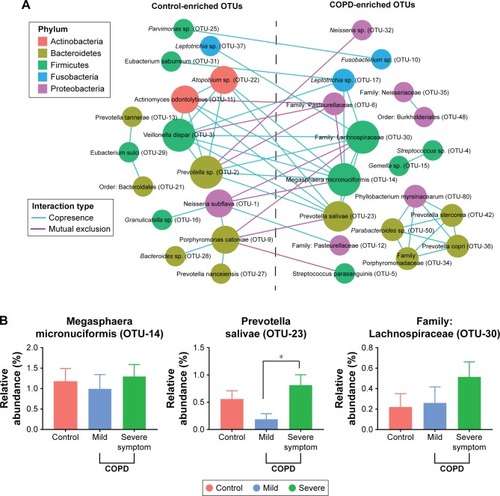
Most of the key microbiota enriched in controls were highly abundant bacteria, such as N. subflava (OTU-1), Prevotella sp. (OTU-2), and Veillonella dispar (OTU-3), which accounted for 42.2% of the total abundance. Additionally, Granulicatella sp. (OTU-16) was not a core bacterium but a commensal with OTU-1.
In contrast to the control-enriched OTUs, the pivotal bacteria enriched in COPD patients were low-abundance bacteria, including Megasphaera micronuciformis (OTU-14), Prevotella salivae (OTU-23), and the family Lachnospiraceae (OTU-30). Noticeably, the three OTUs had a higher abundance in patients with severe symptoms than in patients with mild symptoms, although a significant difference was identified only for P. salivae (OTU-23), as shown in . These results suggested that the core bacteria enriched in COPD patients may influence symptoms.
Relationship between the sputum flora and the clinical phenotypes
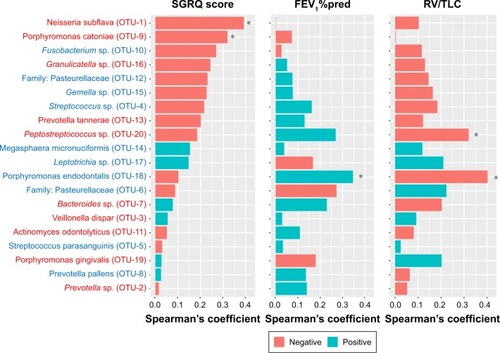
To investigate the association between specific bacteria with lung function and symptoms in COPD patients, we calculated Spearman’s coefficient for the 20 most abundant OTUs, as illustrated in . A higher SGRQ score, a lower FEV1%pred, and a higher RV/TLV denoted worse symptoms, airflow limitation, and emphysema, respectively. The association pattern of symptoms with the microbiota was obviously different from the association patterns of FEV1%pred and RV/TLC, and the association patterns of the latter two parameters were very similar.
Figure 4 Relationship between the sputum flora and the clinical phenotypes in COPD patients.
Abbreviations: OTU, operational taxonomic unit; SGRQ, St George’s Respiratory Questionnaire; FEV1%pred, predicted percent of forced expiratory volume in 1 second; RV/TLC, ratio of residual volume to total lung capacity.
Discussion
To the best of our knowledge, this investigation is the first study to explore the relationship between symptoms and the sputum microbiome in clinically stable COPD patients. The key findings are the identification of alterations in community composition and core bacterial taxa such as N. subflava in stable COPD patients with more severe symptoms.
FEV1%pred, RV/TLC, history of frequent exacerbation, and comorbidities (diabetes and hypertension) were very similar between symptomatic (≥25) and asymptomatic (<25) patients in our study. The inconsistency of symptoms may be related to disease heterogeneity. Previous studies on large cohorts have revealed that symptom reports are highly variable, even in patients with the same GOLD stage.Citation29,Citation30 Another possible explanation is that only 22.2% of symptomatic patients in the present study previously used ICS and the proportion seems to be lower than that of asymptomatic patients (38.4%), although statistical difference is not significant. The low usage rate of ICS caused an increase in current symptoms in these patients.
A common view is that the airway microbiota composition is altered in patients with very severe lung function and with AE, although considerable heterogeneity of the airway microbiota exists between patients.Citation10,Citation20 A huge microbial variation between patients was also observed in the present study. Our key finding is the identification of symptom-related sputum microbial alterations, which are not associated with lung function. Compared with previous cohorts, the patients in this study had relatively mild pulmonary function deficits and included only two patients staged GOLD IV. Moreover, the use of ICS did not differ significantly between patients with mild and severe symptoms. It was reported that patients with more severe symptoms may have higher inflammation levels.Citation31 Therefore, the shift in the sputum microbiome in symptomatic patients may represent an adaptation to the inflammatory airway environment.
Previous studies have reported that Neisseria is a highly abundant genus in the sputum and is not significantly altered in COPD patients.Citation12,Citation18 In this study, N. subflava (OTU-1) was also not shifted in COPD patients, but it was decreased in patients with severe symptoms and negatively correlated with SGRQ scores, which implied that N. subflava may be associated with COPD symptoms. In addition, N. subflava played an important role in the co-occurrence network, and the reduction of this species may drive the observed shift at the community level. The genus Granulicatella was reported to decrease in COPD patients,Citation32 which was verified in our study. We also found that Granulicatella sp. was commensal with N. subflava (OTU-1) and was reduced more significantly in patients with severe symptoms. Accordingly, several low-abundance COPD-enriched core microbiota, such as M. micronuciformis (OTU-14), P. salivae (OTU-23), and the family Lachnospiraceae (OTU-30), showed an increasing trend in patients with severe symptoms, and these taxa were mutually exclusive from the key control-enriched taxa. Thus, the three OTUs may represent potentially pathogenic microorganisms (PPM) in COPD. In addition, these OTUs also present higher expression in patients with severe symptoms, suggesting that PPMs may be related to symptoms. These results imply that common sputum bacteria may be replaced by other low-abundance taxa, causing increased COPD symptoms.
In this study, we also found that the association pattern of the sputum microbiota with symptoms was obviously different from that of lung function in COPD patients. Therefore, symptomology should also be addressed independent of lung function in future microbiome studies.
Limitations
This study has several limitations. First, nonsmokers and females were not included because COPD patients living in cities in China are almost male smokers. Second, this investigation was a small cross-sectional study, which restricts the dynamic observations for these results. Third, we used only the more comprehensive SGRQ questionnaire to evaluate symptomatology instead of the CAT, which was not collected during enrollment. Fourth, information regarding the environmental and occupational exposure of the subjects was not collected in this study. Finally, the causality between key bacteria and symptoms has not been determined using animal models.
Conclusion
This preliminary study highlighted the potential link between the microbiota and symptomology in COPD patients, emphasizing the role of symptoms in the airway microbiome independent of lung function. Because both the airway microbial environment and the patient symptoms undergo dynamic changes and are treatable, understanding the interplay between these factors could facilitate individualized treatment.
Author contributions
All authors declared their personal contributions to this manuscript: BH conducted the study design and critically revised the article; WD conducted bioinformatics analyses and interpretation and wrote the manuscript; NS and YD were involved in statistical analyses and enrolled subjects; XS and CG collected throat samples and performed lung function tests for the subjects; QK gathered clinical information from the subjects; and JRE-D, GBH, and MRG were involved in the study design. All authors contributed toward data analysis, drafting and revising the paper and agree to be accountable for all aspects of the work.
Acknowledgments
The authors thank Jie Li (BGI, Shenzhen, China) for advice on bioinformatics and statistical analyses in this study. The present study was funded by the National Natural Science Foundation of China (grant nos: 81270097, 81470235, and 81670034) and Beijing Medical University (grant nos: 20110176 and 20160529).
Supplementary materials
Figure S1 Community composition was not altered between controls and patients with different severity of lung function.
Notes: Unsupervised PCoA and PERMANOVA were used to determine the discrepancy of community level between controls, patients with different severity of lung function using Bray–Curtis distance. No statistical difference was identified between groups (control vs GOLD I, II, P=0.162; control vs GOLD III, IV, P=0.105; GOLD I, II vs GOLD III, IV, P=0.723).
Abbreviations: GOLD, Global Initiative for Obstructive Lung Disease; PCoA, principal coordinate analysis; PERMANOVA, permutational multivariate analysis of variance.
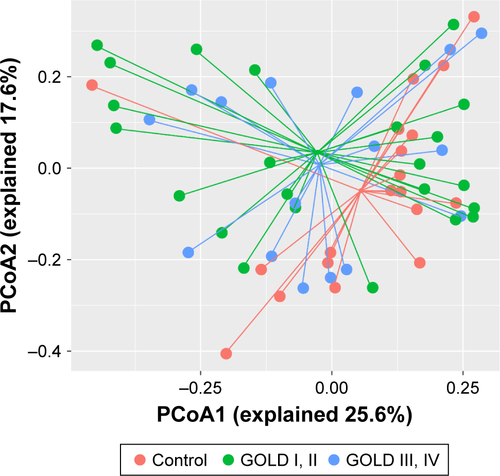
Figure S2 Community composition was not affected by the use of inhaled corticosteroid.
Notes: Unsupervised PCoA and PERMANOVA were used to determine the discrepancy of community level between controls and patients with or without the use of ICS using Bray–Curtis distance. No statistical difference was identified between groups (control vs ICS, P=0.221; control vs non-ICS, P=0.145; ICS vs non-ICS, P=0.957).
Abbreviations: ICS, inhaled corticosteroid; PCoA, principal coordinate analysis; PERMANOVA, permutational multivariate analysis of variance.
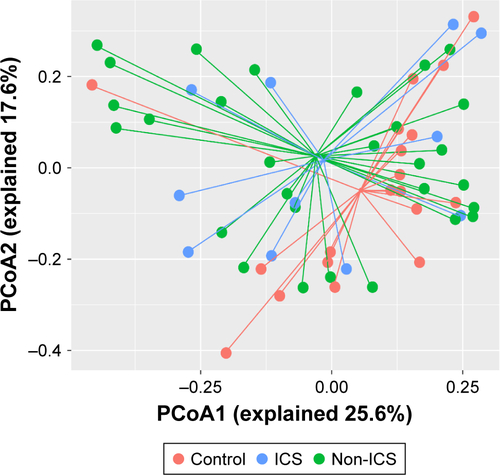
Figure S3 Potential contaminated OTUs in negative control.
Note: The potentially contaminated OTUs in sterile water and AE buffer were present, which showed extremely low abundance in experimental samples and did not include the previously identified core microbiota (Neisseria subflava, etc.).
Abbreviations: AE, acute exacerbation; OTU, operational taxonomic unit.
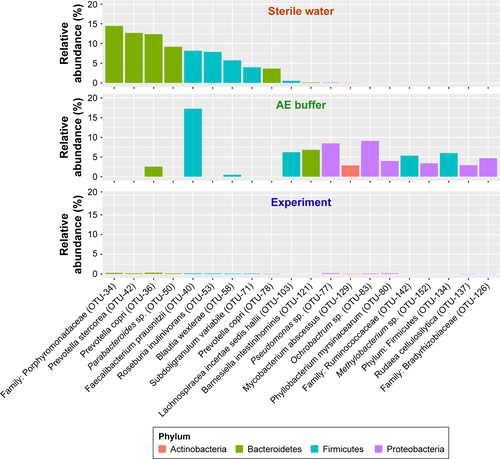
Table S1 Relationship between clinical index and sputum microbiome by PERMANOVA
Disclosure
The authors report no conflicts of interest in this work.
References
- VogelmeierCFCrinerGJMartinezFJGlobal Strategy for the Diagnosis, Management, and Prevention of Chronic Obstructive Lung Disease 2017 Report. GOLD Executive SummaryAm J Respir Crit Care Med2017195555758228128970
- FletcherCPetoRThe natural history of chronic airflow obstructionBr Med J19771607716451648871704
- FranklinWLowellFCMichelsonALSchillerIWChronic obstructive pulmonary emphysema; a disease of smokersAnn Intern Med195645226827413355150
- SethiSInfection as a comorbidity of COPDEur Respir J20103561209121520513910
- PapiABellettatoCMBraccioniFInfections and airway inflammation in chronic obstructive pulmonary disease severe exacerbationsAm J Respir Crit Care Med2006173101114112116484677
- RosellAMonsóESolerNMicrobiologic determinants of exacerbation in chronic obstructive pulmonary diseaseArch Intern Med2005165889189715851640
- LiebermanDLiebermanDBen-YaakovMInfectious etiologies in acute exacerbation of COPDDiagn Microbiol Infect Dis20014039510211502375
- MatkovicZMiravitllesMChronic bronchial infection in COPD. Is there an infective phenotype?Respir Med20131071102223218452
- Erb-DownwardJRThompsonDLHanMKAnalysis of the lung microbiome in the “healthy” smoker and in COPDPLoS One201162e1638421364979
- SzeMADimitriuPAHayashiSThe lung tissue microbiome in chronic obstructive pulmonary diseaseAm J Respir Crit Care Med2012185101073108022427533
- SzeMADimitriuPASuzukiMHost response to the lung microbiome in chronic obstructive pulmonary diseaseAm J Respir Crit Care Med2015192443844525945594
- CameronSJLewisKEHuwsSAMetagenomic sequencing of the chronic obstructive pulmonary disease upper bronchial tract microbiome reveals functional changes associated with disease severityPLoS One2016112e014909526872143
- PragmanAAKimHBReillyCSWendtCIsaacsonREThe lung microbiome in moderate and severe chronic obstructive pulmonary diseasePLoS One2012710e4730523071781
- GalianaAAguirreERodriguezJCSputum microbiota in moderate versus severe patients with COPDEur Respir J20144361787179024311775
- Garcia-NuñezMMillaresLPomaresXSeverity-related changes of bronchial microbiome in chronic obstructive pulmonary diseaseJ Clin Microbiol201452124217422325253795
- HuangYJSethiSMurphyTNariyaSBousheyHALynchSVAirway microbiome dynamics in exacerbations of chronic obstructive pulmonary diseaseJ Clin Microbiol20145282813282324850358
- MillaresLFerrariRGallegoMBronchial microbiome of severe COPD patients colonised by Pseudomonas aeruginosaEur J Clin Microbiol Infect Dis20143371101111124449346
- SuJLiuHYTanXLSputum bacterial and fungal dynamics during exacerbations of severe COPDPLoS One2015107e013073626147303
- WangZBafadhelMHaldarKLung microbiome dynamics in COPD exacerbationsEur Respir J20164741082109226917613
- HuangYJErb-DownwardJRDicksonRPCurtisJLHuffnagleGBHanMKUnderstanding the role of the microbiome in chronic obstructive pulmonary disease: principles, challenges, and future directionsTransl Res2017179718327392936
- EinarssonGGComerDMMcilreaveyLCommunity dynamics and the lower airway microbiota in stable chronic obstructive pulmonary disease, smokers and healthy non-smokersThorax201671979580327146202
- HuffnagleGBAnother piece in the ‘research mosaic’ that describes the role of the lung microbiome in COPDThorax201671977777827435609
- DiaoWShenNDuYIdentification of thyroxine-binding globulin as a candidate plasma marker of chronic obstructive pulmonary diseaseInt J Chron Obstruct Pulmon Dis2017121549156428579773
- DiaoWQShenNDuYPYpDFetuin-B (FETUB): a plasma biomarker candidate related to the severity of lung function in COPDSci Rep201663004527443820
- VestboJHurdSSAgustíAGGlobal strategy for the diagnosis, management, and prevention of chronic obstructive pulmonary disease: GOLD executive summaryAm J Respir Crit Care Med2013187434736522878278
- JonesPWTabbererMChenWHCreating scenarios of the impact of COPD and their relationship to COPD Assessment Test (CAT™) scoresBMC Pulm Med2011114221835018
- MasonKLErb DownwardJRMasonKDCandida albicans and bacterial microbiota interactions in the cecum during recolonization following broad-spectrum antibiotic therapyInfect Immun201280103371338022778094
- SchlossPDWestcottSLRyabinTIntroducing mothur: open-source, platform-independent, community-supported software for describing and comparing microbial communitiesAppl Environ Microbiol200975237537754119801464
- AgustiACalverleyPMCelliBCharacterisation of COPD heterogeneity in the ECLIPSE cohortRespir Res20101112220831787
- WeatherallMMarshSShirtcliffePWilliamsMTraversJBeasleyRQuality of life measured by the St George’s Respiratory Questionnaire and spirometryEur Respir J20093351025103019164350
- GuptaNPintoLBenedettiAThe COPD assessment test: can it discriminate across COPD subpopulations?Chest201615051069107927364603
- OgorodovaLMFedosenkoSVPopenkoAS[Comparison study of oropharyngeal microbiota in case of bronchial asthma and chronic obstructive pulmonary disease in different severity levels]Vestnik Rossiiskoi Akademii Meditsinskikh Nauk2015706669678 Russian