
Abstract
Background
Spirometry confers limited value for identifying small-airway disorders (SADs) in early-stage COPD, which can be detected with impulse oscillometry (IOS) and endobronchial optical coherence tomography (EB-OCT). Whether IOS is useful for reflecting small-airway morphological abnormalities in COPD remains unclear.
Objectives
To compare the diagnostic value of spirometry and IOS for identifying SADs in heavy-smokers and COPD based on the objective assessment with EB-OCT.
Methods
We recruited 59 COPD patients (stage I, n=17; stage II, n=18; stage III–IV, n=24), 26 heavy-smokers and 21 never-smokers. Assessments of clinical characteristics, spirometry, IOS and EB-OCT were performed. Receiver operation characteristic curve was employed to demonstrate the diagnostic value of IOS and spirometric parameters.
Results
More advanced staging of COPD was associated with greater abnormality of IOS and spirometric parameters. Resonant frequency (Fres) and peripheral airway resistance (R5–R20) conferred greater diagnostic values than forced expiratory volume in one second (FEV1%) and maximal (mid-)expiratory flow (MMEF%) predicted in discriminating SADs in never-smokers from heavy-smokers (area under curve [AUC]: 0.771 and 0.753 vs 0.570 and 0.558, respectively), and heavy-smokers from patients with stage I COPD (AUC: 0.726 and 0.633 vs 0.548 and 0.567, respectively). The combination of IOS (Fres and R5–R20) and spirometric parameters (FEV1% and MMEF% predicted) contributed to a further increase in the diagnostic value for identifying SADs in early-stage COPD. Small airway wall area percentage (Aw% 7–9), an EB-OCT parameter, correlated significantly with Fres and R5–R20 in COPD and heavy-smokers, whereas EB-OCT parameters correlated with FEV1% and MMEF% in advanced, rather than early-stage, COPD.
Conclusions
IOS parameters correlated with the degree of morphologic abnormalities of small airways assessed with EB-OCT in COPD and heavy-smokers. Fres and R5–R20 might be sensitive parameters that reliably reflect SADs in heavy-smokers and early-stage COPD.
Introduction
Chronic obstructive pulmonary disease (COPD) is characterized by airway chronic inflammation and incompletely reversible airflow limitation. Airway structural changes in COPD are characterized by airway luminal narrowing, mucus gland hypertrophy, airway wall fibrosis and collagen deposition, which are more evident in small airways than in large and medium-sized airways.Citation1,Citation2 Small airways (diameter <2 mm) are major sites contributing to airway resistance and the disorders are frequently implicated in early-stage COPD.Citation2 Small-airway resistance only comprises 10%–25% of the total airway resistance in healthy subjects,Citation3,Citation4 but can be markedly increased in COPDCitation5,Citation6 due to airway wall thickening and luminal obstruction. To date, few diagnostic approaches are available for assessing small-airway disorders (SADs) in COPD.
Impulse oscillometry (IOS) is an effort-independent non-invasive measurement which, during spontaneous breathing, simultaneously assesses airway resistance at different sites and with various physical properties. IOS parameters were reportedly more sensitive than spirometry in detecting SADs in early-stage COPD.Citation7–Citation10 In patients with obstructive airway diseases, resonant frequency (Fres) and peripheral airway resistance (R5–R20) correlated positively with airflow limitation.Citation6,Citation11,Citation12 However, the interpretation of IOS findings has been based on inference from physiologic perspectives,Citation12,Citation13 therefore the lack of morphological or imaging evidence has made it challenging to verify their usefulness for assessing SADs.
Endobronchial optical coherence tomography (EB-OCT) provides objective high-resolution images and accurate measurements of small airways (from seventh to ninth generation bronchi the diameter of which was less than 2 mm3,Citation14–Citation16) structure in vivo, which correlates well with computed tomographic images and histopathology.Citation17,Citation18 We have previously confirmed the diagnostic value of EB-OCT in assessing SADs in heavy-smokers and patients with different stages of COPD.Citation15
We further hypothesized that spirometry has limited diagnostic value for detecting SADs which can be readily assessed with EB-OCT, and that IOS parameters may complement spirometry in identifying SADs in heavy-smokers and patients with early-stage COPD. Therefore, the aim of this study was to compare the diagnostic value of spirometry and IOS parameters in evaluating SADs (validated with EB-OCT), and determine whether and which IOS parameters are more sensitive than spirometry for assessing SADs in heavy-smokers and patients with early-stage COPD.
Methods
Subjects
We recruited 106 consecutive subjects from the outpatient clinic of The First Affiliated Hospital of Guangzhou Medical University between April 2014 and January 2017.
We defined COPD as a post-bronchodilator FEV1/FVC ratio less than 0.70, according to 2017 Global Initiative for Chronic Obstructive Lung Disease (GOLD) guidelines.Citation19 The severity of airflow limitation categories was defined according to GOLD 2017 criteria: I (mild): FEV1 ≥80% predicted; II (moderate): FEV1 50%–79% predicted; III (severe): FEV1 30%–49% predicted; and IV (very severe): FEV1 <30% predicted. This cohort consisted of 59 COPD patients (GOLD stage I, n=17; stage II, n=18; stage III–IV, n=24), 26 heavy-smokers with normal lung function (FEV1 ≥80% predicted and FEV1/FVC ≥0.7) and 21 never-smokers. We excluded patients with exacerbations within 4 weeks and concomitant pulmonary diseases.
This study was approved by the Ethics Committee of The First Affiliated Hospital of Guangzhou Medical University (Medical Ethics [Year 2014] No 51). All subjects gave written informed consent.
Study design
In this cross-sectional study, we performed IOS, and subsequently, spirometry (Masterscreen IOS, Jaeger, Hoechberg, Germany) according to the international guidelines.Citation20 Short-and long-acting bronchodilators were withheld for at least 8 and 24 hours, respectively. For IOS, we recorded respiratory impedance at 5 Hz (Z5), resonant frequency (Fres), airway resistance at 5 Hz (R5) and 20 Hz (R20), the difference in airway resistance at 5 Hz and 20 Hz (R5–R20), reactance at 5 Hz (X5) and area of reactance (AX).Citation12,Citation21 For spirometry, maximal mid-expiratory flow (MMEF) were selected from the maneuver with the highest sum of FVC and FEV1.Citation20 Chest CT images were analyzed using lung computer-aided graphic software. Total low attenuation areas (TLAAs) were defined as lung voxels with attenuation ≤950 Hounsfield units (HU).Citation22
EB-OCT analysis
We performed EB-OCT scans, which is an objective assessment of airway morphological changes, by using Lightlabs C7XR OCT system (St Jude Medical, St Paul, MN, USA), with the probe’s outer diameter of 0.9 mmCitation15. The EB-OCT probe was advanced to the right lower lobe bronchus (RB9) segment under the guidance of ultrafine flexible bronchoscope (B260F, Olympus, Tokyo, Japan). Patients held their breath following full inspiration. The generation of bronchi was determined based on the airway branch-points in longitudinal section.Citation23 EB-OCT parameters included mean luminal diameter (Dmean), inner airway area (Ai) and airway wall area (Aw) from the seventh to ninth generation. The airway wall area percentage (Aw%) was calculated as [Aw/(Ai + Aw)]×100%, and Ai was corrected for the body surface area (BSA).Citation24–Citation28 Each EB-OCT parameter from the seventh to ninth generation of bronchi was averaged to reflect the magnitude of morphological changes of the small airways.
Statistical analysis
Statistical analysis was performed using SPSS, version 20.0 (IBM Corporation, Armonk, NY, USA). The sample size calculation was based on the two-sided significance level (α) of 5%, and power (1-β) of 80%, with the effect size and SD of Aw% 7–9 adopted from our previous study.Citation15 The minimal sample size for each group was 12 (N=60 for all groups). We determined quality of study using the Standards for Reporting Diagnostic Accuracy Studies (STARD) checklist.Citation29 The Bland-Altman plot was applied to compare the difference and the limits of agreement between two observers’ measurements of EB-OCT to assess reproducibility (see Supplementary data). Chi-squared and Fisher’s exact test were used in the analysis of categorical data. Comparison among different groups was made by using one-way analysis of variance for normally distributed variables and by using the Kruskal-Wallis test for non-normally distributed variables. The association between EB-OCT and IOS and spirometry was determined with correlation analysis. Receiver operation characteristic curve (ROC) (MedCalc Software, Mariakerke, Belgium) was constructed to compare the diagnostic performances. No imputation was made to the missing data. P<0.05 was deemed statistically significant for all analyses unless otherwise stated.
Results
Baseline characteristics
There were no significant among-group differences in terms of age, height, weight, and BSA (all P>0.05, ). Smoking pack-years were not significantly different among heavy-smokers and patients with different stages of COPD (P>0.05). Patients with stages III–IV COPD demonstrated more severe pulmonary emphysema (TLAA%) than did heavy-smokers or never-smokers (both P<0.001). Patients with COPD had significantly lower levels of spirometric parameters than heavy-smokers and never-smokers (all P<0.05), whereas spirometric parameters in heavy-smokers were comparable to those in never-smokers (P>0.05). The information regarding symptoms, treatment and comorbidities of COPD patients is described in Table S1.
Table 1 Baseline characteristics
EB-OCT small-airway parameters among COPD patients, never-smokers and heavy-smokers
The Bland-Altman analysis demonstrated a high degree of concordance of EB-OCT measurement (D7–9, Ai7–9 and Aw7–9) and a negligible bias between two observers’ measurements (Figure S1).
Compared with never-smokers, Aw% 7–9 was significantly greater whereas Ai7–9/BSA was markedly lower in COPD patients (both P<0.05, ). More advanced COPD was associated with greater magnitudes of small-airway obstruction (progressively decreasing Ai7–9/BSA) and airway wall thickening (progressively greater Aw% 7–9) (all P<0.05, and ). Compared with never-smokers, Ai7–9/BSA was markedly lower whereas Aw% 7–9 was significantly higher in heavy-smokers (both P<0.05). The degree of morphological/structural changes was more evident in the eighth and ninth generation of bronchi (). Ai7–9/BSA and Aw% 7–9 were comparable between heavy-smokers and patients with stage I COPD (P>0.05).
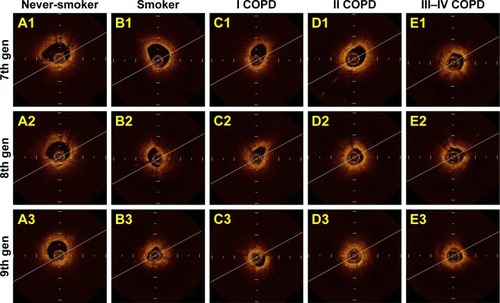
Figure 1 Comparisons of endobronchial optical coherence tomography (EB-OCT) parameters of the seventh to ninth generation of bronchi among never-smokers, heavy-smokers and patients with stages I–IV COPD.
Notes: The comparisons of airway inner area (A), and airway wall area percentage (B), average value (C), average value (D), from 7 to 9 generation of bronchi among five groups. Multiple-group comparisons were made by using one-way ANOVA. ✫Indicates a significant difference (P<0.05) between heavy-smokers and never-smokers. *Compared with never-smokers, P<0.05; ※Compared with heavy-smokers, P<0.05; §compared with stage I COPD, P<0.05; #compared with stage II COPD, P<0.05. Abbreviations: Gen 7–9, from the seventh to ninth generation bronchi; Ai, airway internal area; Aw, airway wall area; Aw%, airway wall area percentage, calculated with the formula of [Aw/(Aw + Ai)×100%]; BSA, body surface area; NS, never-smokers; SNL, heavy-smokers with normal lung function.
![Figure 1 Comparisons of endobronchial optical coherence tomography (EB-OCT) parameters of the seventh to ninth generation of bronchi among never-smokers, heavy-smokers and patients with stages I–IV COPD.Notes: The comparisons of airway inner area (A), and airway wall area percentage (B), average value (C), average value (D), from 7 to 9 generation of bronchi among five groups. Multiple-group comparisons were made by using one-way ANOVA. ✫Indicates a significant difference (P<0.05) between heavy-smokers and never-smokers. *Compared with never-smokers, P<0.05; ※Compared with heavy-smokers, P<0.05; §compared with stage I COPD, P<0.05; #compared with stage II COPD, P<0.05. Abbreviations: Gen 7–9, from the seventh to ninth generation bronchi; Ai, airway internal area; Aw, airway wall area; Aw%, airway wall area percentage, calculated with the formula of [Aw/(Aw + Ai)×100%]; BSA, body surface area; NS, never-smokers; SNL, heavy-smokers with normal lung function.](/cms/asset/70a09528-be53-4084-9805-5f29f8c72d80/dcop_a_172639_f0001_c.jpg)
Figure 2 Cross-sectional endobronchial optical coherence tomography (EB-OCT) images of the seventh, eighth, and ninth generation of bronchi.
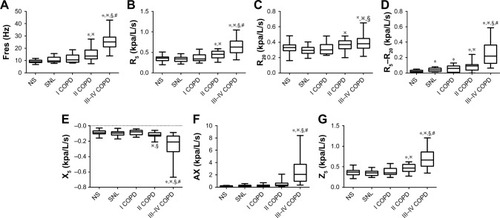
IOS parameters among never-smokers, heavy-smokers and COPD patients
The magnitude of abnormality of IOS parameters was greater in patients with COPD than in never-smokers (). The magnitudes of abnormality of R5–R20 were notably higher in heavy-smokers and stage I COPD than those in never-smokers (both P<0.05), whereas Fres, R5, R20, Z5 X5 and AX were comparable among never-smokers, heavy-smokers and stage I COPD.
Figure 3 Comparison of impulse oscillometry (IOS) parameters in never-smokers, heavy-smokers and patients with stages I–IV COPD.
Abbreviations: Fres, resonance frequency; R5, airway resistance at 5 Hz; R20, airway resistance at 20 Hz; R5–R20, the difference between airway resistance at 5 Hz and 20 Hz; X5, pulmonary reactance at 5 Hz; AX, reactance area; Z, impedance; NS, never-smokers; SNL, smokers with normal lung function.
Diagnostic performances of spirometric and IOS parameters in assessing small-airway disorders among never-smokers, heavy-smokers and COPD patients
COPD has been conventionally diagnosed based on spirometry, the “gold standard” as recommended by the previous version of international guidelines. To minimize the bias towards equivocal or inferior diagnostic value of IOS parameters compared with FEV1 and MMEF predicted% in differentiating the presence from the absence of SADs, we explored the cut-off value for Aw% 7–9 for ROC analysis. According to our previous study,Citation15 ROC analysis was performed to differentiate never-smokers from COPD patients, and the cut-off value was 51.0% for Aw% 7–9 (AUC: 0.971, 95% CI: 0.895–0.997, sensitivity: 89.6%, specificity: 100.0%), which was comparable with the cut-off value of 50.5% derived from the current study (AUC: 0.995, 95% CI: 0.946–1.000, sensitivity: 98.3%, specificity: 95.2%), for discriminating the presence from the absence of SADs (Figure S2). By using this cut-off value, we have identified SADs in one out of 21 never-smokers (4.8%), 17 out of 26 heavy-smokers (65.4%), 15 out of 17 patients with stage I COPD (88.2%), and 17 out of 18 patients with stage II COPD (94.4%) (χ2=41.88, P<0.001, see Figure S3). Therefore, both Fres and R5–R20 had higher AUC compared with FEV1% and MMEF% predicted for identifying SADs in never-smokers and heavy-smokers (AUC: Fres: 0.771, R5–R20: 0.753, FEV1% predicted: 0.570, MMEF% predicted: 0.558). Fres presented with a significantly greater diagnostic value than that of MMEF% predicted (AUC: 0.771 vs 0.558, P<0.05) ( and Table S2). Furthermore, the combination of Fres, R5–R20, FEV1% and MMEF% predicted contributed to a further increase in the discriminative power for identifying SADs in never-smokers and heavy-smokers compared with FEV1% and MMEF% predicted alone, respectively (AUC: 0.825 vs 0.570 and 0.558, respectively, both P<0.05).
Figure 4 The diagnostic value of spirometric and impulse oscillometry (IOS) parameters in discriminating the presence from the absence of small-airway disorders in never-smokers, heavy-smokers, and patients with stage I COPD.
Abbreviations: MMEF, maximal mid-expiratory flow; Fres, resonant frequency; R5–R20, peripheral airway resistance; AUC, area under the curve; COMB, Combination of Fres, R5–R20, FEV1% and MMEF% predicted.
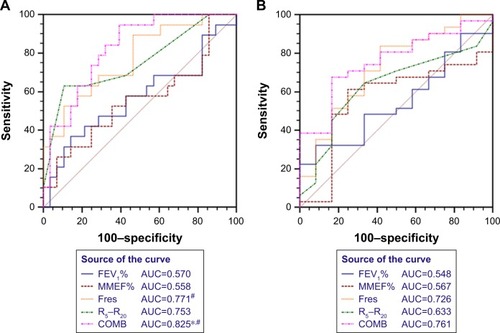
Establishment of the cut-off value for Aw% 7–9 would have contributed to the morphological diagnosis of SADs in early-stage COPD. To this end, ROC analysis with the cut-off of 51.0% for Aw% 7–9 was performed to identify SADs in heavy-smokers and patients with stage I COPD. Despite the lack of statistical significance, Fres and R5–R20 demonstrated numerically higher AUC than FEV1% and MMEF% predicted (AUC: 0.726 and 0.633 vs 0.548 and 0.567, respectively), whereas the combination of Fres, R5–R20, FEV1% and MMEF% predicted contributed to significantly improved diagnostic value compared with FEV1% and MMEF% predicted alone (AUC: 0.761 vs 0.548 and 0.567, respectively) in identifying SADs in heavy-smokers and patients with stage I COPD ( and Table S3).
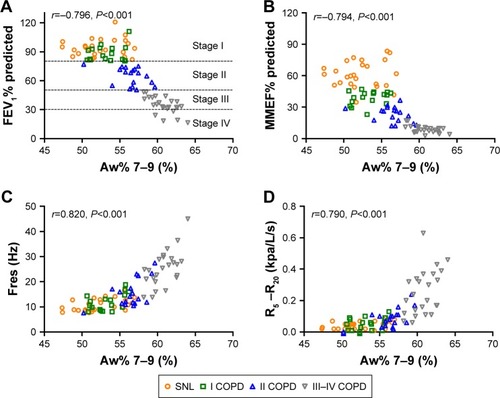
Correlation between EB-OCT, spirometric and IOS parameters
Fres and R5–R20 correlated negatively with D7–9 and Ai7–9, but positively with Aw7–9 and Aw% 7–9 in heavy-smokers and COPD patients (all P<0.05, Figure S4). Consistently, both Fres and R5–R20 correlated significantly with Aw% 7–9 in heavy-smokers and stage I COPD ( and Table S4), whereas the correlations between Aw% 7–9 and FEV1% predicted, and MMEF% predicted, were tempered in heavy-smokers and patients with stage I COPD ( and Table S4). The correlation coefficients between IOS and EB-OCT small-airway parameters were comparable with those between EB-OCT parameters and FEV1% and MMEF% predicted in stages II–IV COPD, except that R5–R20 correlated significantly with Aw% 7–9 in patients with stage II COPD (Table S4).
Figure 5 Correlation among FEV1% predicted, MMEF% predicted, Aw% 7–9, Fres and R5–R20 in COPD patients and heavy-smokers.
Abbreviations: MMEF, maximal mid-expiratory flow; Fres, resonant frequency; R5–R20, peripheral airway resistance; Aw%, airway wall area percentage.
Discussion
Although the clinical significance of IOS small-airway parameters has been deduced mostly from physiologic and/or mathematical models, no data have directly been derived from morphological investigations that lent support to the hypothesis. Since our previous report showed that small airways (inner diameter <2 mm) denoted the seventh generation of bronchi or more distal airways in never-smokers,Citation15 we selected and averaged the EB-OCT parameter from the seventh to ninth generation of bronchi to reflect small airway morphology. We have demonstrated a significant correlation between IOS small-airway parameters and the caliber and wall thickness of small airways detected with EB-OCT in COPD patients and heavy-smokers. Fres and R5–R20 had significantly greater diagnostic performance compared with FEV1% and MMEF% predicted in discriminating the presence from the absence of SADs. Therefore, Fres and R5–R20 might be sensitive markers for reflecting SADs in heavy-smokers and patients with early-stage COPD.
Structural changes of the airway in COPD is characterized by airway luminal narrowing, airway wall fibrosis and collagen deposition, which are more evident in small airways.Citation1,Citation2 The previous EB-OCT study indicated that more advanced stages of COPD were characterized by greater abnormality in airway architecture (tapering airway caliber and greater airway wall thickness); however, SADs were present in some heavy-smokers without airflow limitation.Citation15 Spirometry has been the “gold standard” for the diagnosis and severity grading of COPD, according to the previous version of international guidelines. FEV1 mainly reflects obstruction of large and medium-sized airways, and confers limited value for identifying SADs in early-stage COPD. Whilst not being recognized as a marker of peripheral airway obstruction, the changes of MMEF% predicted would be non-specific and vary considerably among different individuals. Hence, MMEF measurements can be misleading and unreliable to reflect the airway structural changes.Citation30–Citation32 By contrast, IOS offers a global measure of airway resistance and reactance at different frequencies and provides greater insights into regional heterogeneity and lung periphery.Citation13 Theoretically, Fres reflects the inertial properties of airways and the capacitance of lung periphery, whereas R5–R20 indicates small-airway caliber and ventilation heterogeneity.Citation33,Citation34 In this study, we noted that the greater magnitude of abnormality of IOS parameters reflected more severe COPD, Fres and R5–R20 significantly correlated with EB-OCT measurements of lumen and wall area even in stage I COPD and heavy-smokers. Consistently, respiratory resistance could detect airway obstruction in early-stage COPD,Citation11 and isolated abnormality in IOS parameters possibly reflected the latent chronic airway disease which is undiagnosed by spirometry.Citation35
Heavy smoking has been a risk factor for developing COPD, and there has been a significant lag starting from the development of SADs to the onset of clinically notable FEV1 decline. Because some heavy-smokers may have developed SADs which are reminiscent of COPD, proper identification of SADs in patients with early-stage COPD and heavy-smokers may be of clinical importance for ensuring early diagnosis. Some studiesCitation36,Citation37 have documented that IOS parameters had greater sensitivity in detecting SADs among subjects exposed to environmental hazards and asymptomatic heavy-smokers, therefore IOS presumably would be more sensitive in identifying early-stage COPD. However, since the diagnosis of COPD is largely based upon airflow limitation assessed primarily with spirometry, it is difficult to directly compare the discriminative power of IOS and spirometric parameters. The EB-OCT parameter Aw%, in which Ai and Aw have been taken into account, is a sensitive indicator of airway morphological changesCitation24–Citation26,Citation28 and may serve as a novel tool for assessing SADs in early-stage COPD. Our findings demonstrated that both spirometric parameters and IOS small-airway parameters correlated with small-airway morphological changes detected with EB-OCT in COPD. The magnitude of correlation between spirometric and EB-OCT small-airway parameters was greater in more advanced COPD but progressively tempered in early-stage COPD, whereas the correlation between IOS and EB-OCT small-airway parameters remained significant in stage I COPD and heavy-smokers. Hence, IOS parameters, rather than spirometry, may contribute to the great value for detecting small-airway morphological changes and predicting the development of early-stage COPD in some, if not all, of the heavy-smokers. Extra-fine ICS, which is capable of reaching to the small airways,Citation38 might provide greater therapeutic effect in terms of bronchodilation, improve lung function and reduce rate of exacerbations in patients with COPD.Citation39,Citation40 Based on the correlation with morphological changes detected by EB-OCT measurement, IOS small-airway parameters might serve as the surrogate markers for the assessment of therapeutic effects of inhaled corticosteroids, bronchodilators and anti-inflammatory agents in patients with COPD.
We believed that establishing the cut-off value of EB-OCT small-airway parameters, rather than spirometry, would help differentiate patients with from those without SADs. In this study, ROC curve analysis based on Aw% 7–9 was performed to assess the usefulness of spirometry and IOS parameters for identifying SADs. Our findings demonstrated that both Fres and R5–R20 conferred higher AUC than FEV1% and MMEF% predicted in never-smokers and heavy-smokers, as well as in heavy-smokers and patients with stage I COPD. Furthermore, the combination of IOS (Fres and R5–R20) and spirometric (FEV1% and MMEF% predicted) parameters contributed to a further increase in the diagnostic value for identifying SADs in early-stage COPD, as compared with FEV1% and MMEF% predicted alone. Hence, spirometry may have limited usefulness for detecting SADs in early-stage COPD, whereas IOS parameters might help predict, at least in some heavy-smokers, the development of early-stage COPD. Our findings suggested that heavy-smokers with small-airway disorders (either detected with spirometry, IOS or EB-OCT) would benefit from a regular follow-up in clinical practice.
Some limitations should be acknowledged. Our study was conducted in a tertiary medical center with small sample sizes, which limited the generalizability of our findings. The imbalanced sex ratio in healthy subjects may have biased the results. To minimize the bias of small-airway areas measurements, Ai was adjusted for BSA in this study. The EB-OCT probe could only reach the ninth-generation bronchi that made it impossible to demonstrate the morphological changes of the whole peripheral airways. IOS measurement still suffers from the lack of normal reference values, therefore we were unable to compare the usefulness of absolute vs percentage for IOS parameters. Finally, although this study demonstrated that 65.4% of the heavy-smokers presented with small-airway disorders, we were unable to confirm the predictive role of SADs of future development of COPD. Long-term follow-up studies are needed to confirm the correlation between small airway disorders and the development of COPD.
Conclusion
In summary, spirometry confers limited value for reflecting SADs in early-stage COPD. IOS small-airway parameters correlate better with SADs, as assessed with EB-OCT, in different stages of COPD and heavy-smokers. Both Fres and R5–R20 may sensitively detect small-airway morphological/structural change in early-stage COPD and heavy-smokers.
Author contributions
Z-QS and W-JG performed the literature search and drafted the manuscript; Z-QS, YC, C-HZ, C-LT and X-BC were responsible for patient recruitment; Z-QS, YC, X-BC contributed to the data collection, data analysis and data interpretation; Z-QS, W-JG and MJ performed statistical analyses; Z-QS, W-JG, S-YL and N-SZ contributed to study conception; S-YL and N-SZ provided critical review of the manuscript and approved the final submission. All authors contributed toward data analysis, drafting and critically revising the paper and agree to be accountable for all aspects of the work.
Acknowledgments
The authors thank Prof Jin-Ping Zheng (State Key Laboratory of Respiratory Disease, Guangzhou Institute for Respiratory Health, First Affiliated Hospital of Guangzhou Medical University, Guangzhou Medical University) for his recommendations and assistance in patient recruitment, Qing-Si Zeng and Xiao-Feng Lin (Department of Radiology, First Affiliated Hospital of Guangzhou Medical University, Guangzhou Medical University) for assistance with CT images analysis.
Disclosure
Prof. Li declared that he had received National Key R&D Program of China (Grant No. 2016YFC1304100) and Special Funds for Public Welfare Research and Capacity Building in Guangdong Province (No.: 2014A020215036). Dr. Guan declared that he had received Pearl River S&T Nova Program of Guangzhou No. 201710010097 and Guangdong Province Universities and Colleges Pearl River Scholar Funded Scheme 2017. All authors report no other conflicts of interest in this work. None of the funding sources had any role on the study.
Supplementary materials
Reproducibility of endobronchial optical coherence tomography (EB-OCT) measurement
The difference between observer A and observer B measurements of mean luminal diameter Dmean, inner airway area (Ai) and airway wall area (Aw) was calculated to assess the reproducibility. The Bland-Altman analysis demonstrated a high concordance of D7–9, Ai7–9, Aw7–9 and a negligible bias between two observers’ measurements (Figure S1).
Establishment of cut-off value for EB-OCT measurement in discriminating never-smokers from COPD patients
According to the data (Ai7–9 and Aw7–9) from our previous studyCitation1 and Aw% 7–9 was calculated as: [Aw7–9/(Ai7–9+Aw7–9)]×100%, ROC analysis was performed to explored the cut-off value of Aw% 7–9 for differentiating never-smokers from COPD patients. Herein, the cut-off value was 51.0% for Aw% 7–9 (AUC: 0.971, 95% CI: 0.895–0.997, sensitivity: 89.6%, specificity: 100.0%), which was comparable with the cut-off value of 50.5% derived from the current study (AUC: 0.995, 95% CI: 0.946–1.000, sensitivity: 98.3%, specificity: 95.2%), for discriminating the presence from the absence of SADs (Figure S2).
Figure S1 Bland-Altman analysis for endobronchial optical coherence tomography (EB-OCT) measurements by observer A and observer B (n=106).
Note: Bland-Altman analysis for D7–9 (A), Ai7–9 (B) and Aw7–9 (C) as measured by observer A and observer B.
Abbreviations: D7–9, mean diameter from 7th to 9th generation of bronchi; Ai7–9, airway internal area from 7th to 9th generation of bronchi; Aw7–9, airway wall area from 7th to 9th generation of bronchi.
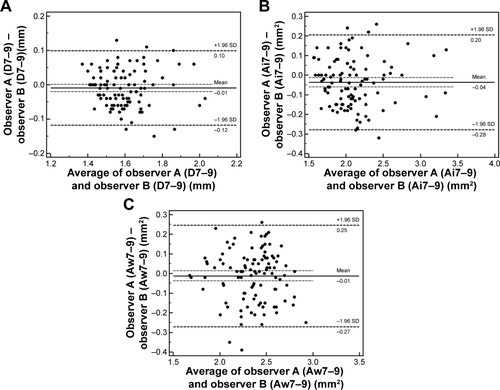
Figure S2 Receiver operating characteristic (ROC) curve analysis of endobronchial optical coherence tomography (EB-OCT) parameter for discriminating never-smokers from patients with COPD.
Notes: The diagnostic value of Aw% 7–9 for discriminating the presence from the absence of small-airway disorders in never-smokers and COPD patients (never-smokers, n=17; COPD patients, n=48) (Figure A. Data from the previous studyCitation1). The diagnostic value of Aw% 7–9 for discriminating the presence from the absence of small-airway disorders in never-smokers and COPD patients (never-smokers, n=21; COPD patients, n=59) (Figure B. Data from the current study).
Abbreviations: 7–9, from 7th to 9th generation of bronchi; Aw%, airway wall area percentage.
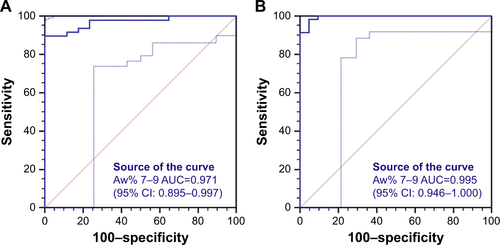
Figure S3 Incidences of small airway disorders (SADs) in never-smokers, heavy-smokers and patients with different stages of COPD.
Notes: By using cut-off value of 51% for Aw% 7–9, SADs were detected in 1/21 (4.8%) never-smokers, 17/26 (65.4%) heavy-smokers, 15/17 (88.2%) stage I, 17/18 (94.4%) stage II and 24/24 (100%) stages III–IV COPD patients.
Abbreviations: NS, never-smokers; SNL, heavy-smokers with normal lung function.
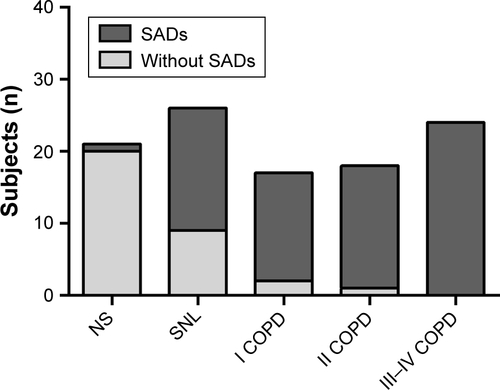
Figure S4 Partial correlation among spirometric, impulse oscillometry (IOS) and endobronchial optical coherence tomography (EB-OCT) parameters in heavy-smokers (A) and COPD patients (B).
Notes: Partial correlation analysis were performed with controlling for age and height. The color of individual boxes indicated the partial correlation coefficient of two parameters (red fillings indicated significantly positive correlation, whereas blue fillings indicated significantly negative correlation).
Abbreviations: MMEF, maximal mid-expiratory flow; 7–9, from 7th to 9th generation of bronchi; Ai, airway internal area; Aw, airway wall area; Aw%, airway wall area percentage; D, mean diameter; Fres, resonance frequency; R5, airway resistance at 5 Hz; R20, airway resistance at 20 Hz; R5–R20, the difference between airway resistance at 5 Hz and 20 Hz; X5, pulmonary reactance at 5 Hz; AX, reactance area; Z, impedance.
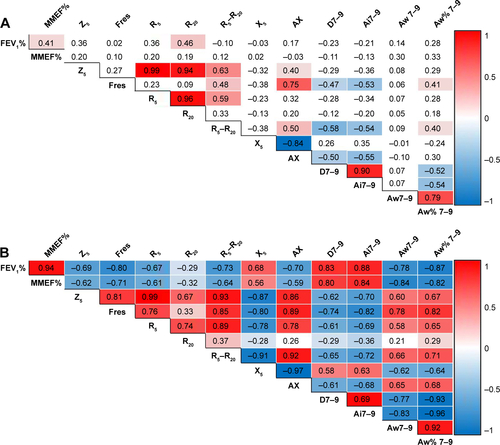
Table S1 Symptoms, treatment and comorbidities in patients with COPD
Table S2 Receiver operating characteristic curve of spirometric and IOS parameters in discriminating the presence or absence of small-airway disorders in never-smokers and heavy-smokers
Table S3 Receiver operating characteristic curve of spirometric and IOS parameters in discriminating the presence or absence of small-airway disorders in heavy-smokers and patients with stage I COPD
Table S4 Correlation between EB-OCT parameters and IOS and spirometric indices in never-smokers, heavy-smokers and different stages of COPD
References
- DingMChenYGuanWJMeasuring airway remodeling in patients with different COPD staging using endobronchial optical coherence tomographyChest201615061281129027522957
References
- JefferyPKRemodeling in asthma and chronic obstructive lung diseaseAm J Respir Crit Care Med200116410 Pt 2S28S3811734464
- RangaVKleinermanJStructure and function of small airways in health and diseaseArch Pathol Lab Med197810212609617363090
- HoggJCMacklemPTThurlbeckWMSite and nature of airway obstruction in chronic obstructive lung diseaseN Engl J Med196827825135513605650164
- MacklemPTMeadJResistance of central and peripheral airways measured by a retrograde catheterJ Appl Physiol19672233954014960137
- JarenbäckLAnkerstJBjermerLTufvessonEFlow-volume parameters in COPD related to extended measurements of lung volume, diffusion, and resistancePulm Med20132013110
- NakagawaMHattoriNHarutaYEffect of increasing respiratory rate on airway resistance and reactance in COPD patientsRespirology2015201879425251948
- TakedaTOgaTNiimiARelationship between small airway function and health status, dyspnea and disease control in asthmaRespiration201080212012619776554
- FrantzSNihlénUDenckerMEngströmGLöfdahlCGWollmerPImpulse oscillometry may be of value in detecting early manifestations of COPDRespir Med201210681116112322613172
- BrochardLPelleGde PalmasJDensity and frequency dependence of resistance in early airway obstructionAm Rev Respir Dis198713535795843826883
- BaillyCCrenesseDAlbertiniMEvaluation of impulse oscillometry during bronchial challenge testing in childrenPediatr Pulmonol201146121209121421634033
- di MangoAMLopesAJJansenJMMeloPLChanges in respiratory mechanics with increasing degrees of airway obstruction in COPD: detection by forced oscillation techniqueRespir Med2006100339941016115754
- OhishiJKurosawaHOgawaHIrokawaTHidaWKohzukiMApplication of impulse oscillometry for within-breath analysis in patients with chronic obstructive pulmonary disease: pilot studyBMJ Open201112e000184
- DuboisABBrodyAWLewisDHBurgessBFOscillation mechanics of lungs and chest in manJ Appl Physiol19568658759413331841
- AppEMZayasJGKingMRheology of mucus and transepithelial potential difference: small airways versus tracheaEur Respir J19936167758425597
- DingMChenYGuanWJMeasuring airway remodeling in patients with different COPD staging using endobronchial optical coherence tomographyChest201615061281129027522957
- TilleyAEO’ConnorTPHackettNRBiologic phenotyping of the human small airway epithelial response to cigarette smokingPLoS One201167e2279821829517
- CoxsonHOQuineyBSinDDAirway wall thickness assessed using computed tomography and optical coherence tomographyAm J Respir Crit Care Med2008177111201120618310475
- ChenYDingMGuanWJValidation of human small airway measurements using endobronchial optical coherence tomographyRespir Med2015109111446145326427628
- VogelmeierCFCrinerGJMartinezFJGlobal Strategy for the Diagnosis, Management, and Prevention of Chronic Obstructive Lung Disease 2017 Report. GOLD Executive SummaryAm J Respir Crit Care Med2017195555758228128970
- MillerMRHankinsonJBrusascoVStandardisation of spirometryEur Respir J200526231933816055882
- BickelSPoplerJLesnickBEidNImpulse oscillometry: interpretation and practical applicationsChest2014146384184725180727
- SchroederJDMcKenzieASZachJARelationships between airflow obstruction and quantitative CT measurements of emphysema, air trapping, and airways in subjects with and without chronic obstructive pulmonary diseaseAJR Am J Roentgenol20132013W460W47023971478
- KirbyMOhtaniKNickensTReproducibility of optical coherence tomography airway imagingBiomed Opt Express20156114365437726601002
- HasegawaMNasuharaYOnoderaYAirflow limitation and airway dimensions in chronic obstructive pulmonary diseaseAm J Respir Crit Care Med2006173121309131516556695
- HoggJCChuFUtokaparchSThe nature of small-airway obstruction in chronic obstructive pulmonary diseaseN Engl J Med2004350262645265315215480
- NakanoYWongJCde JongPAThe prediction of small airway dimensions using computed tomographyAm J Respir Crit Care Med2005171214214615516531
- OgumaTHiraiTFukuiMLongitudinal shape irregularity of airway lumen assessed by CT in patients with bronchial asthma and COPDThorax201570871972426024690
- TanabeNVasilescuDMMcDonoughJEMicro-computed tomography comparison of preterminal bronchioles in centrilobular and panlobular emphysemaAm J Respir Crit Care Med2017195563063827611890
- BossuytPMReitsmaJBBrunsDESTARD 2015: an updated list of essential items for reporting diagnostic accuracy studiesBMJ2015351h552726511519
- NewballHHThe unreliability of the maximal mid-expiratory flow as an index of acute airway changesChest19756733113141112126
- HansenJESunXGWassermanKDiscriminating measures and normal values for expiratory obstructionChest2006129236937716478854
- GelbAFWilliamsAJSpirometryZNFEV1 vs FEF25-75 percentChest19838444734746617285
- Al-MutairiSSSharmaPNAl-AlawiAAl-DeenJSImpulse oscillometry: an alternative modality to the conventional pulmonary function test to categorise obstructive pulmonary disordersClin Exp Med200772566417609877
- van NoordJAClémentJvan de WoestijneKPDemedtsMTotal respiratory resistance and reactance in patients with asthma, chronic bronchitis, and emphysemaAm Rev Respir Dis19911435 Pt 19229272024844
- CrimCCelliBEdwardsLDRespiratory system impedance with impulse oscillometry in healthy and COPD subjects: ECLIPSE baseline resultsRespir Med201110571069107821481577
- SklootGGoldmanMFischlerDRespiratory symptoms and physiologic assessment of ironworkers at the World Trade Center disaster siteChest200412541248125515078731
- OppenheimerBWGoldringRMHerbergMEDistal airway function in symptomatic subjects with normal spirometry following World Trade Center dust exposureChest200713241275128217890470
- de BackerWDevolderAPoliGLung deposition of BDP/formoterol HFA pMDI in healthy volunteers, asthmatic, and COPD patientsJ Aerosol Med Pulm Drug Deliv201023313714820109122
- WedzichaJASinghDVestboJExtrafine beclomethasone/formoterol in severe COPD patients with history of exacerbationsRespir Med201410881153116224953015
- SinghDPapiACorradiMSingle inhaler triple therapy versus inhaled corticosteroid plus long-acting β2-agonist therapy for chronic obstructive pulmonary disease (TRILOGY): a double-blind, parallel group, randomised controlled trialLancet20163881004896397327598678