
Abstract
Background
Heterogeneity of COPD results in different therapeutic effects for different patients receiving the same treatment. COPD patients need to be individually treated according to their own characteristics. The purpose of this study was to explore the differences in different CT phenotypic COPD by molecular metabolites through the use of metabolomics.
Methods
According to the characteristics of CT imaging, 42 COPD patients were grouped into phenotype E (n=20) or phenotype M (n=24). Each COPD patient received tiotropium bromide powder for inhalation for a therapeutic period of 3 months. All subjects were assigned into phenotype E in pre-therapy (EB, n=20), phenotype E in post-therapy (EA, n=20), phenotype M in pre-therapy (MB, n=22), phenotype M in post-therapy (MA, n=22), or normal control (N, n=24). The method of metabolomics based on 1H nuclear magnetic resonance (1H-NMR) was used to compare the changes in serum metabolites between COPD patients and normal controls and between different phenotypes of COPD patients in pre- and post-therapy.
Results
Patients with COPD phenotype E responded better to tiotropium bromide than patients with COPD phenotype M in terms of pulmonary function and COPD assessment test scores. There were differences in metabolites in COPD patients vs normal control people. Differences were also observed between different COPD phenotypic patients receiving the treatment in comparison with those who did not receive treatment. The changes of metabolites involved lactate, phenylalanine, fructose, glycine, asparagine, citric acid, pyruvic acid, proline, acetone, ornithine, lipid, pyridoxine, maltose, betaine, lipoprotein, and so on. These identified metabolites covered the metabolic pathways of amino acids, carbohydrates, lipids, genetic materials, and vitamin.
Conclusion
The efficacy of tiotropium bromide on COPD phenotype E is better than that of phenotype M. Metabolites detected by 1H-NMR metabolomics have potentialities of differentiation of COPD and healthy people, discrimination of different COPD phenotypes, and giving insight into the individualized treatment of COPD.
Introduction
COPD is the fourth leading cause of death in the world and is projected to be the third leading cause of death by 2020. Many people suffer from the disease or its complications for many years and die prematurely.Citation1 Public health challenges brought by COPD are of vital importance. COPD is a heterogeneous disease with different subtypes that have entirely different clinical presentations and disease progression. The definition of “phenotype” proposed of “a single or combination of disease attributes that describe differences between individuals with COPD as they relate to clinically meaningful outcomes (symptoms, exacerbations, response to therapy, rate of disease progression, or death).”Citation2 Therefore, studies aiming at different phenotypes of COPD are the current areas of research interest. This study aimed to make a breakthrough in this area.
High-resolution computed tomography (HRCT) scan provides an objective method for the quantitative evaluation of emphysema, which has a good correlation with the pathological changes and can predict the degree of expiratory airflow obstruction. Classifying COPD into morphological phenotypes by HRCT might help in differentiating patients who would respond to individualized treatment and in determining different pathophysiological phenotypes.Citation3 HRCT measurement of emphysema and small airway disease is advantageous in reflecting pulmonary physiology and functional status.Citation4 A combination of CT density with clinical parameter such as FEV1 is a more appropriate measurement in the studies of emphysema.Citation5 Whether or not the existence of particular pulmonary structural abnormalities such as emphysema, airway wall thickening, and/or bronchiectasis predicts significant clinical meaning is of current research interest. The treatment and prognosis of COPD patients with different CT phenotypes are different, but the underlying molecular mechanism remains unclear. In recent years, with the development of metabolomics, finding molecular biomarkers from metabolites to identify the risk factors and prognoses of diseases has become the hottest research.
Metabolomics is the scientific study of chemical processes involving metabolites. Metabolomics is well-known as a competent and reproducible technology, capable of catching relevant metabolic changes of diseases and bio-markers of disease progression.6 1H nuclear magnetic resonance (1H-NMR) is an attractive technology, as it not only provides qualitative and quantitative measurements but can also simultaneously study multiple compounds in the same biological fluid samples. 1H-NMR has already presented considerable potential as an auxiliary diagnostic technique for the identification of respiratory phenotypes of asthma,Citation7 and discrimination of patients with cystic fibrosis (CF) from healthy people and between patients with unstable and stable CF.Citation8 At present, there are few experiments on the study of COPD patients with different CT phenotypes using 1H-NMR metabolomics.
Therefore, in the present study, we aimed to investigate whether differences exist in molecular metabolites of different phenotypes of COPD which are classified by HRCT and treated with tiotropium bromide, whether different COPD phenotypes have different therapeutic efficacy of tiotropium bromide, and whether the method of metabolomics could discriminate well between the phenotypes of COPD. Our previous study showed that bronchial wall thickening in COPD may be an indicator for better response to the treatment with budesonide–formoterol.Citation9 Nevertheless, the present study explains how the metabolites have changed in COPD patients with different phenotypes undergoing treatment with tiotropium bromide from a completely brand-new perspective. We expect that our study will be an investigation to provide information and understanding in discrimination of phenotypes and personal optimized treatment in COPD.
Materials and methods
Study subjects
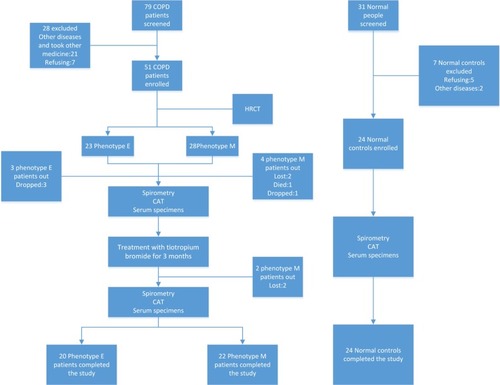
Diagnostic criteria for patients with COPD were based on the Global Initiative for Chronic Obstructive Lung Disease (GOLD 2016). COPD should be considered in any patients who have a medical history, appropriate symptoms, and exposure history (≥40 years old). Spirometry was required for diagnosis, the presence of a post-bronchodilator FEV1/FVC <0.70 confirmed the presence of irreversible airflow limitation. Seventy-nine patients with stable COPD with post-bronchodilator FEV1/FVC <70% (moderate-to-severe COPD) and FEV1 30%–80% predicted, who visited the Department of Respiratory and Critical Care Medicine of the First Affiliated Hospital of Kunming Medical University as outpatients or inpatients between September 2016 and November 2017, were selected. Thirty-one healthy subjects whose age, gender, and body mass index matched the cases of COPD were chosen by the Physical Examination Center of the First Affiliated Hospital of Kunming Medical University at the same time. Forty-four patients and 24 healthy subjects were finally enrolled to this study. COPD patients with exacerbation of an airway disease or an infection of respiratory tract in the previous 4 weeks were excluded. Use of inhaled corticosteroids (ICSs) in fixed combination with long-acting beta2-agonists, ICS/short-acting beta2-agonists (SABA), short-acting antimuscarinic antagonists/SABA, or phosphodiesterase type 4 inhibitors, injected and oral steroids, 4 weeks before study and during the study was not permitted. Antileukotrienes, antihistamines, theophyl-lines, and mucolytics were allowed. Exclusion criteria also include metabolic diseases, systemic diseases, desmosis, tumor, psychiatric disorders, cognitive dysfunction, and other chronic bronchial or pulmonary diseases (such as pulmonary tuberculosis, bronchiectasis, bronchial asthma, and sleep apnea hypopnea syndrome). Seven controls were excluded due to systemic and/or respiratory infection in the past four weeks, psychiatric disorders and participant withdrawal (). This protocol was approved by the medical ethics committee of Kunming Medical University, and all the participants have signed the informed consents.
Figure 1 Flowchart for the recruited patients.
Study design
According to the imaging features of HRCT in the chest, patients with COPD were divided into phenotype E and phenotype M. They were further grouped into phenotype E pre-therapy (EB, n=20), phenotype M pre-therapy (MB, n=22), phenotype E post-therapy (EA, n=20), phenotype M post-therapy (MA, n=22), and normal control (N, n=24). Tiotropium bromide powder for inhalation (18 µg × 10 capsule + 1 hand inhaler, Spiriva; Boehringer Ingelheim, Ingelheim am Rhein, Germany), one inhalation once daily, was used by the patients with COPD for a therapeutic period of 3 months. Fasting serum specimens of COPD patients from EB, EA, MB, MA, and normal control groups were collected before and after treatment. Information was collected and compared among groups: lung function (FEV1/FVC%, FEV1 predicted), serum samples, medical history, age, sex, smoking, physical examination, and scores of COPD assessment test (CAT).
HRCT examination and classification of COPD patients
All the selected patients were scanned with SOMATOM Definition Flash CT (Siemens Healthcare, Forchheim, Germany) in the CT Department of the First Affiliated Hospital of Kunming Medical University. Workstation of Picture Archiving and Communication Systems was used to review the CT images by two radiologists independently. The three slices were observed and measured at the upper (close to the upper edge of 1 cm of aortic arch), middle (1 cm under the carina), and lower lung field (3 cm superior right diaphragm) to determine the extent of emphysema and the thickness of bronchial tube wall. Severity of emphysema was scored visually through low attenuation areas in each bilateral lung field by the method of Geddard.Citation10 The extent of emphysema was graded, and the scores in every level are calculated in . Assessment of bronchial wall thickness (observing the morphology of the small bronchi of 2–4 mm in diameter of the pulmonary subsegments outside the hilus pulmonis) and the results of CT classification of COPD patient are as shown in .
Table 1 HRCT classification of COPD
Investigation of CAT assessment questionnaire
CAT is a simple instrument for use in everyday clinical practice, and it is possible to relate its scores to scenarios descriptive of impaired health status in COPD.Citation11 CAT questionnaire was applied to score the untreated COPD patients and normal subjects, meanwhile ensuring that all subjects were not affected by the opinions of their families, friends, and also the staffs. After 3 months of treatment, the patients were evaluated by CAT survey again at the follow-up visit.
Sample preparation and 1H-NMR experiment
A sample of 5 mL of fasting venous blood for each person was collected and centrifuged at 3,000 rpm for 10 minutes. The supernatant (≥300 µL) was transferred to another tube and then stored and frozen at −80°C. For the NMR experiment, blood samples were thawed and centrifuged at 13,000 rpm for 10 minutes at 4°C. About 100 µL of deuterium oxide of 2,2,3,3-D4-3-(trimethylsilyl)propionic acid sodium salt (1 mg/mL), 200 µL of phosphate buffer solution (0.2 M), and 300 µL of serum were added sequentially to tubes and mixed thoroughly, then centrifuged at 13,000 rpm for 10 minutes again. Finally, 550 µL of supernatant for every sample was extracted into a 5 mm NMR tube. Using Carr– Purcell–Meiboom–Gill pulse sequence to collect the serum samples, small molecular metabolites in the samples were observed. The detention period of relaxation is 2 seconds, during which the low-power pulse was used to presaturate the peak of water. The data of free induction decay signal were filled with zero, designating δ1.33 for the left peak of the hydroxyisobutyric acid signal doublet. The 1H-NMR spectra were then obtained by Fourier transform after the linewidth broadening enhancement factor of 0.5 Hz was added.
NMR data processing and pattern recognition analysis
The phase and baseline of 1H-NMR spectra were modulated and corrected by the software of Mest Re Nova (version 9.0.1.13255; Mestrelab Research, Santiago de Compostela, Spain). The spectra in the range of δ0.4–4.4 were integration segmented according to 0.01 ppm per section and the spectra between δ4.6–5.0 were excluded. Obtained data were collected and converted to Microsoft Excel 2010 after normalizing the integral based on the total integrated intensity of each spectrum. The data in the Excel format were submitted to SIMCA-Package software package (version 11.0; Umetrics, Umea, Sweden) for multivariate analysis. After the data were preprocessed with Pareto scaling, the method of principal component analysis (PCA) was applied to analyze the separation trend between the groups. If the PCA is not good enough to separate the metabolic profiles between different groups, the method of partial least square discriminant analysis (PLS-DA) and/or orthogonal partial least square discriminant analysis (OPLS-DA) could be used to further analyze the differences between groups. PLS-DA analysis was carried out to maximize this observed difference between the groups. On the basis of PLS-DA, OPLS-DA could be performed to filter out signals that were irrelevant to the model. Modeling parameters of R2X, R2Y, and Q2 were used to evaluate the validity of the model. Using variable importance for projection (VIP) for analysis, the variables with VIP >1.0 were considered the metabolites contributing the most to the group difference. Further screening of metabolites was performed by univariate analysis. First, Student’s t-test was carried out first, then the metabolites with a concentration difference of more than twofold were analyzed and screened by fold change (FC). Finally, metabolites of statistical significance and FC ≥2 were screened. The chemical shifts corresponding to the metabolites were finally obtained. The chemical compounds were identified by chenomx NMR suite software (http://www.chenomx.com/software/), and the metabolic markers were finally obtained.
Statistical analysis
Statistical analyses were performed with SPSS software (version 22.0; IBM Corporation, Armonk, NY, USA). It was divided into normal distribution and abnormal distribution after normal testing of measurement data. Independent-sample t-test and paired-sample t-test were applied when data satisfied normal distribution; otherwise, non-parametric test (Mann–Whitney U analysis or Wilcoxon analysis) would be used. Data are presented as mean ± SD. A P-value of <0.05 was considered statistically significant.
Results
Characteristics of all subjects
The clinical characteristics of the study population are presented in . There was only one set of data of the normal control group in FEV1/FVC%, FEV1/predicted %, and CAT scores respectively because the drug (tiotropium bromide powder for inhalation) was not used in the normal control group. The three groups were statistically similar with respect to gender, age, and body mass index (P>0.05). Smoking history of packs per year in phenotype E and phenotype M was more than normal control (P<0.05), but no statistical difference was found between phenotype E and phenotype M (P>0.05). The data of phenotype E and phenotype M in FEV1/FVC% and FEV1/predicted % were both increased significantly post-therapy than in pre-therapy (P<0.05). The CAT scores of phenotype E and phenotype M were obviously decreased in post-therapy than in pre-therapy (P<0.05). FEV1/FVC%, FEV1/predicted %, and CAT scores of both phenotype E and phenotype M were statistically different compared with the normal control in pre- and post-therapy (P<0.05). FEV1/FVC% in pre- and post-therapy, FEV1/predicted % in pre-therapy, and CAT scores in pre-therapy of phenotype E had no significant difference compared with phenotype M (P>0.05), but FEV1/predicted % in post-therapy of phenotype E was higher than that of phenotype M (P<0.05). CAT scores of COPD phenotype E in post-therapy were lower than phenotype M in post-therapy (P<0.05). The change of FEV1/FVC%, FEV1/predicted %, and CAT scores of phenotype E in pre- vs post-therapy was significantly higher than that in phenotype M (P<0.05).
Table 2 Characteristics of all subjects
NMR experimental spectra
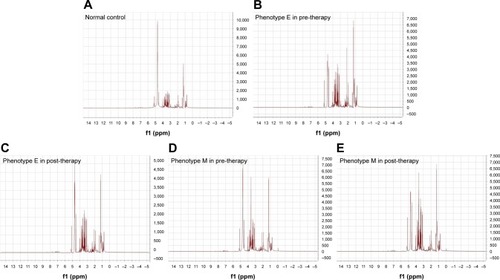
The 1H-NMR spectra were obtained by Fourier transform after the processing of the original NMR signal data. Different peak heights and peak areas in the 1H-NMR spectra of the five groups were found. It is indicated that the metabolites of serum molecules have changed in these five states, so they had different metabolic profiles (different 1H-NMR spectra are shown in ).
Figure 2 We chose one spectrum from each experimental group.
Abbreviations: EB, phenotype E in pre-therapy; EA, phenotype E in post-therapy; MB, phenotype M in pre-therapy; MA, phenotype M in post-therapy; N, normal control.
Results of data processing
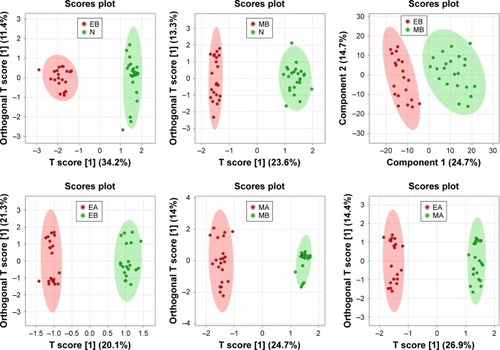
Data were preprocessed with Pareto scaling and then imported into MetaboAnalyst 4.0 software (http://www.metaboanalyst.ca/) for PCA, PLS-DA, and OPLS-DA analysis. The graphic presentation of the quality of separation between groups in the model is shown by their respective OPLS-DA scores plots (). The quality of the model is tested by cross-validation, and the obtained parameters R2X, R2Y, and Q2 () which respectively represent explanatory variables of model X, interpretable variables of Y, and predictable variables of model were used to evaluate the validity of the model. Using VIP for analysis, the variables with VIP >1.0 were considered the metabolites contributing the most to the group difference. Further operation of metabolites was performed by univariate analysis, and t-test (P<0.05) and FC ≥2 were used to screen metabolites.
Table 3 Parameters for the evaluation of OPLS-DA model
Figure 3 Six OPLS-DA score plots are selected from six comparative groups.
Concentration changes of metabolites COPD phenotypes vs healthy control In , we could see the changing trends of 30 identified metabolites. In the group of EB and N, the concentration of COPD patients of phenotype E with pre-therapy had increased levels of lactate, fructose, glycine, creatine, citric acid, pyruvic acid, pyruvate, proline, acetone, l-glutamine, l-proline, ornithine, lipid CH2CH2CO, 2-hydroxyisobutyrate, threonine, isopropyl alcohol, maltose, l-threonine, l-valine, glutamic acid, beta-alanine, cyclopentane, and 2-aminoisobutyric acid compared to the normal control group, whereas the levels of asparagine and pyridoxine were decreased. Between groups of MB and N, the concentration of COPD patients with phenotype M in pre-therapy had increased levels of fructose, glycine, pyruvic acid, pyruvate, proline, acetone, l-proline, lipid CH2CH2CO, threonine, isopropyl alcohol, betaine and N-acetylcysteine (NAC) compared to normal controls, but the levels of ornithine, guanosine, and lipoprotein were decreased. In groups of phenotype E and phenotype M both in pre-therapy, l-glutamine and l-alanine were increased in EB compared to MB.
Table 4 Variation trend of the metabolites of COPD and normal controls
COPD phenotypes pretreatment vs posttreatment
Eight metabolites were identified as seen in . Between phenotype E COPD patients, the levels of glycine, asparagine, and citric acid were downregulated in posttreatment compared to pretreatment, whereas the level of choline was upregulated. In the groups of COPD patients of phenotype M, the level of creatinine was upregulated in posttreatment compared to pretreatment. After treatment of inhaling tiotropium bromide for 3 months, the concentrations of phenylalanine, pyruvic acid, and proline were downregulated in phenotype E compared to phenotype M.
Table 5 Variation trend of the metabolites of COPD phenotypes
Analysis of metabolic pathways
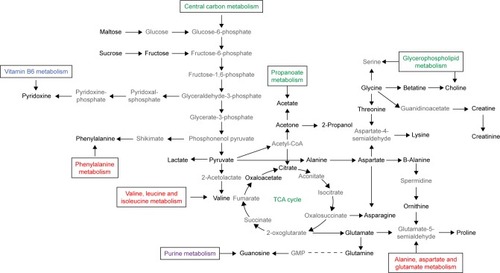
Analysis of metabolic pathways in which all the metabolites may be involved in is shown in .
Figure 4 Analysis of metabolic pathways.
Abbreviations: TCA cycle, tricarboxylic acid cycle; GMP, guanosine monophosphate.
Discussion
Our experiment is the first to classify COPD patients into new phenotypes by using HRCT. Our study is also the first in treating different phenotypes of COPD with tiotropium bromide powder for inhalation, using the method of metabolomics to compare the serum metabolites between different CT phenotypes and evaluating therapeutic efficacy through lung function and CAT scores.
Phenotype E and phenotype M could be distinguished through pulmonary function and CAT scores after treatment with tiotropium bromide. The visible difference between phenotype E and phenotype M patients is the extent of the thickness of bronchial tube wall. The M phenotype group with increased airway wall thickening in the small airway, but not in the large airway, mainly results in airflow limitation in COPD. On the other hand, the E phenotype group’s airway wall thickening in the small airway may be mild and the airflow limitation may be caused by the decreased elastic recoil. However, the pathological changes of both the types of airways ultimately contribute to airflow limitation; therefore, it is difficult to discriminate between the two types from the measured values of lung function. Only after using drugs we can see that there are certain changes between the two types. The subtle difference between phenotype E and phenotype M is the airway remodeling. We speculated that the difference in efficacy of tiotropium bromide might be due to the differences in muscarinic receptors between two phenotypes of COPD patients. It seems likely that patients with emphysema but without bronchial wall thickening (or with mild bronchial wall thickening) may be more sensitive to tiotropium bromide. The most widespread disease-specific health status questionnaires such as St George’s Respiratory QuestionnaireCitation12 and Chronic Respiratory QuestionnaireCitation13 are too complicated to perform. As such, simpler measures such as The COPD Control Questionnaire (The CCQ) and CAT have been applied. In China, the CAT scores correlated well with the measurements of quantitative CT. Not only can it assess status of health and disease, but it can also associate with the extent of emphysema and thickness of bronchial tube wall in Chinese COPD patients.Citation14 In any subtypes of patients, the CAT scores after treatment were significantly lower than that before the treatment, but phenotype E was lower than that of phenotype M. This shows that symptomatic improvement of patients with phenotype E with treatment of tiotropium bromide is superior to that of phenotype M. Fujimoto et alCitation15 also obtained similar result in 2011. In addition to emphysema, phenotype M shows more severe airway remodeling of tube wall thickening in pathological morphology and increased airway inflammation; after using the same medicine, phenotype E may have better improvement of pulmonary function and symptom than phenotype M. Interestingly, our previous studyCitation9 found that phenotype M in response to therapeutic effects of budesonide–formoterol were significantly greater compared with phenotype E, and bronchial wall thickening may be a better predictor for the response to treatment with bronchodilator and corticosteroid. However, further experiments will be needed to study the reason why different phenotypes of COPD have different therapeutic efficacy to tiotropium bromide and what the mechanism is. It could guide better and individualized treatment of COPD in the future. Metabolomics is a comprehensive assessment of endogenic metabolites and aims to methodically quantify and identify metabolites from specimens in a global and targeted way. We chose NMR-based metabolomics because NMR requires little specimen. It is also fast, non-invasive and nondestructive. At present, samples of metabolomics in COPD are limited to blood, urine, and exhaled breath condensate (EBC). Urinary metabolic profiling may correlate with lung functionCitation16 and could become a useful clinical assessment to distinguish asthma from COPD.Citation17 The metabolic fingerprint of EBC could be used to discriminate the α1-antitrypsin-deficient patients from healthy people,Citation18 and serum metabolic changes have also been detected in COPD and normal people.Citation19 We chose to analyze the blood of the subjects by the 1H-NMR spectroscopy because the blood sample is more accurate and less affected.
Increased energy consumption, increased catabolism, reduced intake of nutrients, impaired gastrointestinal function, and altered endocrine hormones led to malnutrition in COPD. COPD patients are accompanied by energy metabolism disorders, which are characterized by abnormal glucose metabolism, increased lipid oxidation, and reduced protein supply. Glucose and fructose are the most important monosaccharides to the human body. Like glucose, maltose is a reducing sugar, which can be broken down to glucose by maltase. In COPD patients, the concentration of all carbohydrate metabolites was increased. When the energy supply to the body is insufficient, the body will decompose the glycogen in the form of energy storage and increase the concentration of the sugar in the blood for metabolism. The increased carbohydrate metabolism indicates increased uptake and utilization of glucose in the COPD patients.Citation20 These results suggest that patients with COPD produce more glucose that enter glycolytic pathways and form more pyruvate. Hence, we found higher levels of pyruvate in COPD patients than normal controls. Pyruvate can also be converted to fatty acids through a reaction with acetyl-CoA and can be used to construct alanine and be converted into ethanol or lactate through fermentation. Increased lactate and alanine suggest that pyruvate is non-oxidized to lactate and alanine rather than being oxidized through the citric acid cycle. Hypoxia and respiratory muscle fatigue are the causes of lactic acidosis in patients with COPD.Citation21 Lipids exert multiple effects in the body, many of which may be related to the pathogenesis of COPD. Different species of lipids have dynamic balance conditions in the course of disease development. Change in lipids indicates the presence of its catabolism in COPD patients. The resting energy expenditure (REE) of COPD patients was higher than that of the same-age normal people due to airway obstruction, increased working load of respiratory muscles, and decreased blood oxygen saturation. The abnormality of lipid metabolism in COPD patients is mainly caused by a decrease in dietary intake and increase in REE. Related studiesCitation22,Citation23 have shown that fatty acid residues extracted from lipids could serve as energy substrates for glycolysis and upregulation of oxidation. Elevated levels of acetate, acetone, and pyruvate have been found in urine samples of COPD patients compared to normal controls.Citation19 Acetate is catalyzed by lipometabolism, and its increase may indicate the accelerated lipid catabolism to fulfill the energy requirements caused by poor nutritional status related to COPD patients. Acetone is produced from acetyl-CoA when energy is acquired from decomposed fatty acids because of the insufficient carbohydrate. Increased acetone can interpret the utilization of stored lipids as an alternative energy resource for patients with COPD. Amino acids are another large category of energy metabolism in human body. Valine is one of the branched-chain amino acids (BCAAs). Pouw et al reported that BCAAs in plasma do not differ between COPD patients and healthy individuals.Citation24 However, more studies found that the concentration of BCAAs is reduced in COPD patientsCitation19 and models.Citation25 The elevated level of valine in our experiment is consistent with the previous phenotyping study.Citation26 The reason for the different results is that previous metabolomics experiments did not use CT classification as a criterion for screening patients with COPD. Proline is a significant metabolite related to environmental stress, and under stress, proline accumulation may increase cell viability by scavenging reactive oxygen species and stabilizing proteins and the cell membrane.Citation27 It is well known that the pathogenesis of COPD is related to oxidative stress, and the elevated proline just demonstrates this. Glycine can act on inflammatory cells, inhibiting the activation of transcription factors and the formation of free radicals and inflammatory
Limitations
As all the selected COPD patients and normal subjects came from the Southwest of China, the low number of subjects was limited. There are geographical limitations in these samples. The influence of race, lifestyle, living environment, and eating habits could not be excluded. In the process of filling out the CAT questionnaires, the subjects might have subjective bias due to the degree of education and the difference of understanding. We need further multicenter, multi-area, large-sample, long-term, and dynamic research for the identification of different CT phenotypes of COPD patients, 1H-NMR analysis, and their therapeutic response of anticholinergic drugs in the future.
Conclusion
COPD patients and healthy subjects before and after treatment can be distinguished well by the method of metabolomics based on 1H-NMR. Simultaneously, the differences in serum metabolites can also result in different diagnoses between the two phenotypes of COPD patients before and after treatment. COPD patients with different phenotypes who were classified through HRCT have different therapeutic efficacy on tiotropium bromide. Changes in amino acids, carbohydrates, lipids, genetic materials, and vitamin metabolic pathways were involved in the classification of COPD and its treatment with tiotropium bromide. Combined with CAT scores and results of lung function, the therapeutic efficacy of tiotropium bromide on phenotype E was better than that of phenotype M. The present study found that these metabolites have potentialities of differentiation of COPD and healthy people, COPD phenotyping, and therapeutic efficacy evaluation. Thus, it could scientifically guide the individualized and optimized treatment of COPD.
Acknowledgments
This study was supported by grants of National Natural Science Foundation of China (grant no. 81160006) and Doctoral Foundation of the First Affiliated Hospital of Kunming Medical University (grant no. 2017BS013). The authors appreciate Daniel Ta, Chao Zhou, and Jia-Qiang Zhang for their excellent technical assistance.
Disclosure
The authors report no conflicts of interest in this work.
References
- Gold-Copd.orgGlobal Initiative for Chronic Obstructive Lung DiseaseGlobal Strategy for the Diagnosis, Management, and Prevention of Chronic Obstructive Pulmonary Disease 2018 Report2017 Available from: http://www.goldcopd.orgAccessed November 13, 2017
- HanMKAgustiACalverleyPMChronic obstructive pulmonary disease phenotypes: the future of COPDAm J Respir Crit Care Med2010182559860420522794
- FujimotoKKitaguchiYKuboKHondaTClinical analysis of chronic obstructive pulmonary disease phenotypes classified using high-resolution computed tomographyRespirology200611673174017052301
- OstridgeKWilliamsNPKimVRelationship of CT-quantified emphysema, small airways disease and bronchial wall dimensions with physiological, inflammatory and infective measures in COPDRespir Res20181913129458372
- CrossleyDRentonMKhanMLowEVTurnerAMCT densitometry in emphysema: a systematic review of its clinical utilityInt J Chron Obstruct Pulmon Dis20181354756329445272
- GaoLWenZWuCWenTOngCNMetabolic profiling of plasma from benign and malignant pulmonary nodules patients using mass spectrometry-based metabolomicsMetabolites20133353955124958138
- ManiscalcoMParisDMelckDJCoexistence of obesity and asthma determines a distinct respiratory metabolic phenotypeJ Allergy Clin Immunol201713951536154727746236
- MontuschiPParisDMelckDNMR spectroscopy metabolomic profiling of exhaled breath condensate in patients with stable and unstable cystic fibrosisThorax201267322222822106016
- WangCLiJXTangDMetabolic changes of different high-resolution computed tomography phenotypes of COPD after budesonide-formoterol treatmentInt J Chron Obstruct Pulmon Dis2017123511352129255358
- GoddardPRNicholsonEMLaszloGWattIComputed tomography in pulmonary emphysemaClin Radiol19823343793877083738
- JonesPWTabbererMChenWHCreating scenarios of the impact of COPD and their relationship to COPD Assessment Test (CAT™) scoresBMC Pulm Med2011114221835018
- JonesPWQuirkFHBaveystockCMLittlejohnsPA self-complete measure of health status for chronic airflow limitation. The St. George’s Respiratory QuestionnaireAm Rev Respir Dis19921456132113271595997
- GuyattGHBermanLBTownsendMPugsleySOChambersLWA measure of quality of life for clinical trials in chronic lung diseaseThorax198742107737783321537
- ZhangYTuYHFeiGHThe COPD assessment test correlates well with the computed tomography measurements in COPD patients in ChinaInt J Chron Obstruct Pulmon Dis20151050751425784797
- FujimotoKKitaguchiYKandaSUrushihataKHanaokaMKuboKComparison of efficacy of long-acting bronchodilators in emphysema dominant and emphysema nondominant chronic obstructive pulmonary diseaseInt J Chron Obstruct Pulmon Dis2011621922721660299
- McclayJLAdkinsDEIsernNG(1)H nuclear magnetic resonance metabolomics analysis identifies novel urinary biomarkers for lung functionJ Proteome Res2010963083309020408573
- AdamkoDJNairPMayersITsuyukiRTRegushSRoweBHMetabolomic profiling of asthma and chronic obstructive pulmonary disease: A pilot study differentiating diseasesJ Allergy Clin Immunol20151365803571.e3580.e3
- AiroldiCCiaramelliCFumagalliM1H NMR To Explore the Metabolome of Exhaled Breath Condensate in α1-Antitrypsin Deficient Patients: A Pilot StudyJ Proteome Res201615124569457827646345
- WangLTangYLiuSMetabonomic profiling of serum and urine by (1)H NMR-based spectroscopy discriminates patients with chronic obstructive pulmonary disease and healthy individualsPLoS One201386e6567523755267
- KaoCCHsuJWBandiVHananiaNAKheradmandFJahoorFGlucose and pyruvate metabolism in severe chronic obstructive pulmonary diseaseJ Appl Physiol20121121424722016370
- LauEMazerJCarinoGInhaled β-agonist therapy and respiratory muscle fatigue as under-recognised causes of lactic acidosisBMJ Case Rep20132013bcr2013201015
- AgarwalARYinFCadenasEShort-term cigarette smoke exposure leads to metabolic alterations in lung alveolar cellsAm J Respir Cell Mol Biol201451228429324625219
- AgarwalARYinFCadenasEMetabolic shift in lung alveolar cell mitochondria following acrolein exposureAm J Physiol Lung Cell Mol Physiol201330510L764L77324056970
- PouwEMScholsAMDeutzNEWoutersEFPlasma and muscle amino acid levels in relation to resting energy expenditure and inflammation in stable chronic obstructive pulmonary diseaseAm J Respir Crit Care Med199815837978019731007
- RenXMaSWangJComparative effects of dexamethasone and bergenin on chronic bronchitis and their anti-inflammatory mechanisms based on NMR metabolomicsMol Biosyst20161261938194727098339
- KilkKAugAOttasASoometsUAltrajaSAltrajaAPhenotyping of Chronic Obstructive Pulmonary Disease Based on the Integration of Metabolomes and Clinical CharacteristicsInt J Mol Sci2018193666
- TakagiHTakaokaMKawaguchiAKuboYEffect of L-proline on sake brewing and ethanol stress in Saccharomyces cerevisiaeAppl Environ Microbiol200571128656866216332860
- Effenberger-NeidnichtKJägersJVerhaeghRde GrootHGlycine selectively reduces intestinal injury during endotoxemiaJ Surg Res2014192259259825012270
- Kumor-KisielewskaAKierszniewska-StępieńDPietrasTAssessment of leptin and resistin levels in patients with chronic obstructive pulmonary diseasePol Arch Med Wewn2013123521522023611920
- YonedaTYoshikawaMFuATsukaguchiKOkamotoYTakenakaHPlasma levels of amino acids and hypermetabolism in patients with chronic obstructive pulmonary diseaseNutrition2001172959911240335
- LeverMSlowSThe clinical significance of betaine, an osmolyte with a key role in methyl group metabolismClin Biochem201043973274420346934
- JungJKimSHLeeHSSerum metabolomics reveals pathways and biomarkers associated with asthma pathogenesisClin Exp Allergy201343442543323517038
- HanYYBlatterJBrehmJMFornoELitonjuaAACeledónJCDiet and asthma: vitamins and methyl donorsLancet Respir Med201311081382224461761
- SharmaSLitonjuaAAsthma, allergy, and responses to methyl donor supplements and nutrientsJ Allergy Clin Immunol201413351246125424360248
- FimognariFLLoffredoLdi SimoneSHyperhomocysteinaemia and poor vitamin B status in chronic obstructive pulmonary diseaseNutr Metab Cardiovasc Dis200919965465919282159
- ChambaneauAFilaireMJubertLBremondMFilaireENutritional Intake, Physical Activity and Quality of Life in COPD PatientsInt J Sports Med201637973073727286177
- ZhangJQZhangJQFangLZLiuLFuWPDaiLMEffect of oral N-acetylcysteine on COPD patients with microsatellite polymorphism in the heme oxygenase-1 gene promoterDrug Des Devel Ther2015963796387
- ZhangJQZhangJQLiuHEffect of N-acetylcysteine in COPD patients with different microsomal epoxide hydrolase genotypesInt J Chron Obstruct Pulmon Dis20151091792325999707
- CazzolaMCalzettaLPageCInfluence of N-acetylcysteine on chronic bronchitis or COPD exacerbations: a meta-analysisEur Respir Rev20152413745146126324807
- PoolePChongJCatesCJMucolytic agents versus placebo for chronic bronchitis or chronic obstructive pulmonary diseaseCochrane Database Syst Rev20157CD001287
- BrosnanJTInterorgan amino acid transport and its regulationJ Nutr20031336 Suppl 120682072
- van ThoNOgawaETrang leTHA mixed phenotype of airway wall thickening and emphysema is associated with dyspnea and hospitalization for chronic obstructive pulmonary diseaseAnn Am Thorac Soc201512798899625844673
- KuhnKSMuscaritoliMWischmeyerPStehlePGlutamine as indispensable nutrient in oncology: experimental and clinical evidenceEur J Nutr201049419721019936817
- UbhiBKRileyJHShawPAMetabolic profiling detects biomarkers of protein degradation in COPD patientsEur Respir J201240234535522183483
- LaurentMRicardJ-LBahainJ-JVoinchetPRousseauLDatation du site Paléolithique moyen de la Butte d’Arvigny (Moissy-Cramayel, Seine-et-Marne)Comptes Rendus de l’Académie des Sciences – Series IIA – Earth and Planetary Science20003308581583
- DasUNPyruvate is an endogenous anti-inflammatory and anti-oxidant moleculeMed Sci Monit2006125Ra79Ra8416641887