
 ?Mathematical formulae have been encoded as MathML and are displayed in this HTML version using MathJax in order to improve their display. Uncheck the box to turn MathJax off. This feature requires Javascript. Click on a formula to zoom.
Abstract
Purpose
The aim of the present study was to evaluate the performance of the forced oscillation technique (FOT) for the early diagnosis of the effects of smoking and COPD. The contributions of the integer-order (InOr) and fractional-order (FrOr) models were also evaluated.
Patients and methods
In total, 120 subjects were analyzed: 40 controls, 40 smokers (20.3±9.3 pack-years) and 40 patients with mild COPD.
Results
Initially, it was observed that traditional FOT parameters and the InOr and FrOr models provided a consistent description of the COPD pathophysiology. Mild COPD introduced significant increases in the FrOr inertance, damping factor and hysteresivity (P<0.0001). These parameters were significantly correlated with the spirometric parameters of central and small airway obstruction (P<0.0001). The diagnostic accuracy analyses indicated that FOT parameters and InOr modeling may adequately identify these changes (area under the receiver operating characteristic curve – AUC >0.8). The use of FrOr modeling significantly improved this process (P<0.05), allowing the early diagnosis of smokers and patients with mild COPD with high accuracy (AUC >0.9).
Conclusion
FrOr modeling improves our knowledge of modifications that occur in the early stages of COPD. Additionally, the findings of the present study provide evidence that these models may play an important role in the early diagnosis of COPD, which is crucial for improving the clinical management of the disease.
Introduction
COPD is currently the fourth and will soon become the third most frequent cause of death.Citation1 This disease is responsible for 6% of all deaths worldwide.Citation1 The spirometry test is typically used to evaluate respiratory obstruction in COPD.Citation2,Citation3 Although considered the gold standard test, spirometry has the disadvantage of requiring great effort and great cooperation from patients, which can result in variation in the quality of test results, and performing the test on some patients can be difficult.Citation4–Citation6
There is a consensus in literature about the great importance of early COPD diagnosis, enabling the establishment of measures that may alter the course of the disease, including pharmacological and non-pharmacological interventions and smoking cessation.Citation7–Citation11 Assessment of respiratory obstruction in the early stages is critically dependent on the sensitivity of pulmonary function tests.Citation12 It has previously been observed that spirometric indices are not sensitive to small changes due to smoking.Citation13
The forced oscillation technique (FOT) is a non-invasive method that aims to evaluate the respiratory system resistance and reactance during spontaneous ventilation.Citation6 The method is based on the application of sinusoidal pressure variations in the opening of the airway through a mouthpiece during spontaneous ventilation.Citation2 Thus, the FOT only requires passive cooperation; forced expiratory maneuvers are not necessary. This method has reached a high level of sophistication currently representing the state-of-the-art in terms of the evaluation of pulmonary function.Citation14 FOT was successfully applied in our laboratory and in several other research groups to diagnose early respiratory changes in respiratory mechanics.Citation13,Citation15–Citation26
Fractional-order (FrOr) models were recently proposed, allowing a more detailed and accurate description of the dynamic behavior of living systems. In the particular case of the respiratory system, these models provide new insight into the mechanisms associated with peripheral changes in the diseased lung.Citation27 Recently, new FrOr models were introduced and have been found to be particularly useful for the analysis of patients with COPD.Citation28–Citation32 These models provide sensitive information about resistive properties and hysteresivity, which reflects changes in heterogeneity and lung structure, as well as parenchymal deformity and elastance.Citation27 However, these models were not evaluated for the early detection of the effects of smoking and COPD.
In this context, the main objectives of this study were 1) to evaluate the potential of the FOT combined with FrOr models in the early diagnosis of the adverse effects of smoking and COPD; and 2) to determine the best parameters for the previously mentioned diagnoses.
Patients and methods
Study design
The FOT and spirometry assessments were performed at the Biomedical Instrumentation Laboratory of the State University of Rio de Janeiro (LIB/UERJ) and at the Pedro Ernesto University Hospital (Hospital Universitário Pedro Ernesto – HUPE) and were approved by the Research Ethics Committee of HUPE. Prior to the tests, the individuals signed a free and informed consent form. Forty healthy volunteers with no history of smoking or pulmonary disease (the control group), 40 smoking volunteers and 40 volunteers with mild COPD were studied.
Patients with COPD were stable and classified according to the GOLD criteria as having mild airway obstruction.Citation1 The eligibility criteria for COPD included a history of smoking >10 packs of cigarettes per year, an FEV1/FVC ratio <0.7, no respiratory infections in the previous 3 weeks and an absence of other respiratory diseases or other thoracic comorbidities, including cardiovascular disease, malignant disease and chest deformities. Before the study, all patients were taking their usual medication as recommended by the GOLD, but medication that could interfere with the assessment of the BD response was suspended, as established by the American Thoracic Society/European Respiratory Society (ATS/ERS).Citation1,Citation33
The control group was composed of healthy individuals without any previous history of pulmonary or cardiac disease or smoking. Using a closed-circuit spirometer (Vitrace VT-139; Pro-médico, Rio de Janeiro, Brazil), the following measurements were obtained for all subjects while they were in a sitting position: forced expiratory volume in the first second (FEV1), FVC, forced expiratory flow (FEF) between 25% and 75% of the FVC, the FEF/FVC ratio and the FEV1/FVC ratio. The best of the three repeatable maneuvers was recorded.
Interpretation of respiratory impedance measurements
The interested reader may find details of the FOT instrumentation in the supplement. Traditional FOT parameters were initially used to interpret the results. The resistive component was evaluated using linear regression in the frequency range between 4 and 16 Hz, which allowed us to obtain the intercept resistance (R0) and the slope of the resistive impedance values (S). In the frequency range of the present study (4–32 Hz), resistances are related to the airway and tissue Newtonian resistance in addition to the delayed airway resistance resulting from gas redistribution. Therefore, R0 estimates how the cited properties work at low frequencies.Citation34 S reflects the frequency-dependent alteration in the distribution of gas flow within the system, ie, both spatial and temporal inhomogeneities.Citation34,Citation35 The resistance of the respiratory system at 4 Hz (R4) and the average resistance between 4 and 16 Hz (Rm), which is associated with airway caliber, were also examined.Citation36
The mean reactance (Xm) and the resonance frequency (fr) were used to interpret the results related to the reactive properties. These parameters reflect changes in airway heterogeneity, as well as tissue changes associated with the presence of fibrosis, for example.Citation34,Citation37 The area of Xrs(f) from 4 Hz to fr, designated as the reactance area (AX), is related to respiratory compliance and is believed to be sensitive to the degree of peripheral airway obstruction.Citation38 The respiratory system dynamic compliance (Cdyn) was obtained using the respiratory reactance at 4 Hz (Cdyn=−1/(2πfX4 Hz)).Citation39 The same frequency was used to estimate the respiratory impedance module (Z4), which is related to the work done by respiratory muscles to overcome the resistive and elastic properties of the respiratory system in order to generate airflow.Citation36,Citation40
Respiratory modeling
The extended RIC model (eRIC, ) was suggested as a model that has been improved when compared to the basic RIC model. In these models, R is the variable representing central airway resistance, Rp describes the peripheral resistance and I and C are associated with pulmonary inertance and compliance, respectively. The eRIC model can also be used to evaluate the total resistance (Rt=R+Rp).
Figure 1 Two-compartment integer-order model used to analyze respiratory impedance.
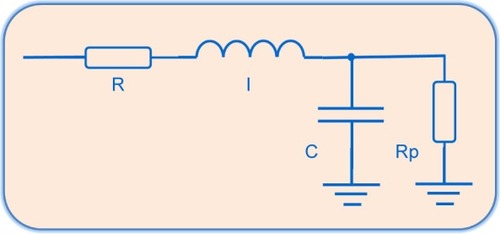
A two-compartment integer-order model (InOr) was used to analyze respiratory impedance. The resistance (R), inductance (I) and capacitance (C) are the variables representing respiratory resistance, inertance and compliance, respectively. Rp represents the peripheral resistance.
The FrOr proposed for evaluation in this study (EquationEquation 1(1) , ) is physiologically interpreted as a frequency-dependent fractional inertia (FrL) which takes into account the capacity of the fractional terms to approximate the resistive properties being 0≤α≤1, and a component relative to more peripheral airways described as a constant-phase impedance, where 0≤β≤1, and frequency-dependent fractional compliance (FrC) is a fractional compliance.Citation30
Figure 2 Two-compartment fractional-order model evaluated in this study.
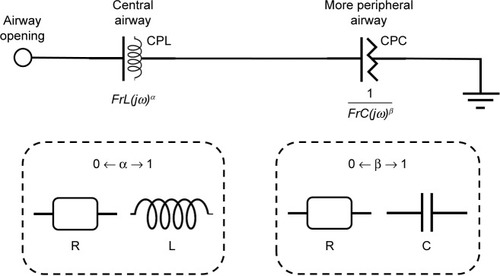
These results were interpreted physiologically using the damping (G), elastance (H) and hysteresivity coefficient (η) values, as described by the following equations:
Hysteresivity describes the heterogeneity of the lung, with greater values often associated with more heterogeneity. Damping is associated with energy dissipation in the respiratory system, while H reflects the potential elastic energy storage (elastance).Citation30 Curves fitting of the IrOr and FrOr models was performed using the ModeLIB program, which was also developed in our laboratory. This program employs the Levenberg-Marquardt algorithm to determine the set of parameters of the model that best represent the input dataset in terms of least squares. Together with the model estimates, this analysis also provides the calculated total error value (MSEt), an overall measure of the “goodness of fit” of the model. The square root of the sum of the real (MSEr) and imaginary (MSEx) impedance estimation errors is used for this purpose.
Statistical analysis
The results are presented as the means ± SDs. The Shapiro– Wilk normality test was performed first. One-way ANOVA corrected by Tukey’s test was used when the data exhibited a normal distribution. When the data were not normally distributed, a non-parametric test (Kruskal–Wallis) combined with the Mann–Whitney U test was used. The results were considered significant at P<0.05.
To calculate the sample size, we used preliminary results obtained from 31 controls, 26 smokers and 22 patients with mild COPD.Citation41 The criterion was the comparison of areas under the curve (AUCs), with the aim of showing that an AUC of 0.8 (adequate diagnostic accuracy) was significantly different from the null hypothesis value of 0.5 (meaning no discriminating power). A type I error of 0.01 and a type II error of 0.01 were considered, which resulted in a minimum of 36 volunteers per group. This analysis was performed using MedCalc 13 (MedCalc Software, Mariakerke, Belgium).
The study follows the STARD requirements for reporting studies of diagnostic accuracy.Citation42 The values of sensitivity and specificity were obtained based on the optimal cut-off point, as determined from the Receiver Operating Characteristic (ROC) curve analysis.Citation43 ROC curves with AUCs ≥0.80 were considered adequate for diagnostic use, while AUCs between 0.90 and 1.00 were considered indicative of a high diagnostic accuracy.Citation43,Citation44 Comparisons of the AUC among the best parameters obtained from traditional FOT analysis and from eRIC and FrOr modeling were done using MedCalc 13, according to the theory described by Hanley and McNeil.Citation45
The associations among the FOT and spirometric parameters were evaluated using Spearman’s correlation coefficients. These analyses were performed using GraphPad Prism 7, and the interpretation of these results was based on the classification proposed by Dawson et al:Citation46
Small or no correlation: between 0 and 0.25 (or −0.25);
Reasonable correlation: between 0.25 and 0.50 (or −0.25 to −0.50);
Moderate to good correlation: between 0.50 and 0.75 (or −0.50 to −0.75);
Very good to excellent correlation: greater than 0.75 (or −0.75).
Results
The anthropometric and spirometric characteristics of the studied groups are described in .
Table 1 Anthropometric, spirometric and traditional FOT measurements of the groups studied
Respiratory modeling
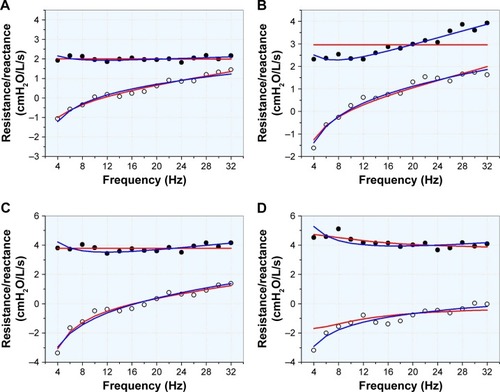
shows typical respiratory impedance measurements and the associated model adjustments that were obtained in normal subjects with constant (A) and slightly increasing resistance values (B), the smokers (C) and the mild COPD patients (D).
Figure 3 Typical results obtained during the eRIC (red) and FrOr (blue) models adjustment in the resistance (closed circles) and reactance (open circles) of normal subjects (A) normal subjects with increasing resistance (B), smokers (C) and mild COPD patients (D).
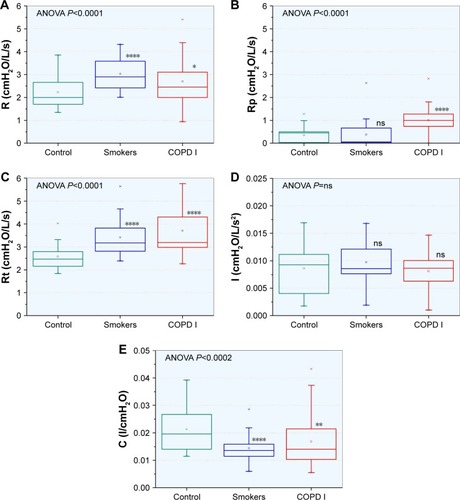
describes the results obtained using the eRIC model in the studied groups. The Rt values increased significantly in the smokers and mild COPD patients, while C was reduced in the mentioned groups.
Figure 4 Changes in the eRIC model parameters in the studied groups.
Abbreviations: COPD I, mild COPD; ns, not significant.
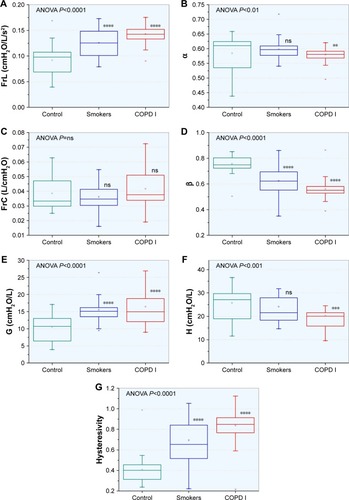
On examining the parameters obtained with the FrOr model, significant increases in FrL, damping factor and hysteresivity were observed. The changes in α and FrC were not significant, while β and elastance showed significant decreases ().
Figure 5 Changes in the fractional order model parameters in the studied groups.
Abbreviations: COPD I, mild COPD; ns, not significant.
presents the error values observed in the adjustments in the real and imaginary parts of the impedance, as well as the mean relative distances for the studied models.
Table 2 Errors in the integer and FrOr models used for control individuals, smokers and patients with mild COPD
Correlation of traditional FOT, eRIC and FrOr model parameters with spirometry
These analyses are described in –, respectively. In general, the degree of the associations among traditional FOT and spirometric parameters were reasonable to good. Considering the traditional parameters, the strongest correlations were presented by Xm, showing good and direct (positive) correlations with FEV1 (L) and FVC (L).
Table 3 Correlation analysis among traditional forced oscillation parameters and spirometric results
Table 4 Correlation analysis among eRIC model parameters and spirometric results
Table 5 Correlation analysis among FrOr model parameters and spirometric results
Smaller correlations were observed among the eRIC model and spirometric parameters (). R was not correlated with the spirometric parameters. The strongest correlations were found between Rp and FEV1 (%) and between C and FEV1 (L).
For the FrOr parameters, it was observed that FrC and H were almost not correlated with the spirometric parameters (). The strongest correlations were presented by β and η, which showed good direct and inverse correlations, respectively, with FEF25–75 (%).
Diagnostic accuracy of traditional FOT, eRIC and FrOr parameters
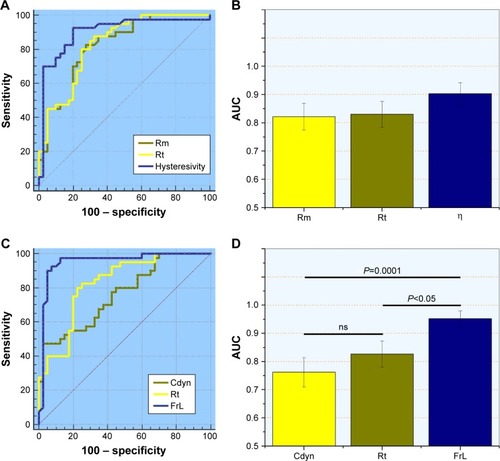
ROC analysis of the studied groups revealed that Rm was the best traditional forced oscillation parameter in smokers [; AUC=0.821 (95% CI: 0.719–0.897), Se=77.5 (61.5–89.2), Sp=75.0 (61.5–89.2)]. Similarly, Rt was the more discriminative parameter when the eRIC model was used [AUC=0.830 (0.750–0.905), Se=80.0 (64.4–90.9), Sp=75.0 (61.5–89.2)]. For the use of the FrOr model, shows that β and η were the more accurate parameters for smokers [AUC=0.903 (0.816–0.958), Se=82.5 (67.2–92.7), Sp=85.0 (70.2–94.3)]. Traditional FOT and eRIC modeling achieved appropriate values for clinical use (AUC >0.80), while the FrOr modeling AUC value was considered of high diagnostic accuracy (AUC >0.90).Citation43,Citation44
Table 6 Diagnostic accuracy, sensitivity, specificity and cut-off point for the traditional, eRIC and FrOr parameters in detecting respiratory alterations in smokers
A similar analysis performed in patients with mild COPD revealed that Cdyn was the best traditional forced oscillation parameter [; AUC=0.763 (0.654–0.851), Se=67.5 (50.9–81.4), Sp=65.0 (48.3–79.4)].
For the eRIC model, similar to the results for smokers (), Rt was the more discriminative parameter [AUC=0.827 (0.726–0.902), Se=80.0 (64.4–90.9), Sp=72.5 (61.5–89.2)]. This model achieved an appropriate value for clinical use (AUC >0.80).Citation43 The evaluation of the fractional-order parameters showed that FrL was the more accurate parameter in mild COPD, achieving a high diagnostic accuracy (; AUC >0.90) [AUC=0.953 (0.881–0.988), Se=92.5 (79.6–98.4), Sp=92.5 (79.6–98.4)].Citation43,Citation44
A detailed description of the ROC curves for the most accurate parameters for the traditional analysis and the studied eRIC and FrOr models in smokers and mild COPD is provided in . The comparative analysis among the AUCs showed that, despite the visually observed difference, the accuracy obtained using traditional parameters and eRIC and FrOr model parameters in smokers was statistically similar (). In contrast, the diagnostic accuracy obtained by the fractional inertance was significantly higher than that observed for the best traditional FOT parameter (Cdyn; P=0.0001) and the eRIC model parameter (Rt; P<0.05) in patients with mild COPD ().
Figure 6 ROC curves for the most accurate traditional FOT, eRIC and FrOr parameter in smokers (A) and mild COPD patients (C). Associated comparative analysis of these AUCs and the standard errors in smokers (B) and mild COPD patients (D) are also described.
Discussion
This study evaluated the hypothesis that FrOr respiratory system modeling may improve the diagnostic accuracy of FOT in smokers and mild COPD patients. Four major findings were obtained: 1) Initially, the traditional FOT parameters, the eRIC model, and the studied FrOr model provided a consistent description of the COPD pathophysiology; 2) these parameters were correlated with spirometry results; 3) the FOT parameters and eRIC modeling may adequately identify early abnormal changes; and 4) the use of FrOr modeling further improved this process, allowing the early diagnosis of smokers and mild COPD patients with high accuracy.
There were no significant changes between the weight and height in the studied groups, and age exhibited a small significant increase among the investigated groups (). However, the analyzed groups can be considered homogeneous because aging does not significantly change the FOT parameters. Height was the most influential parameter in this analysis.Citation47 The observed reductions in the spirometric parameters were consistent with the classification values for the severity of airflow limitation in COPD.Citation48
In line with previous FOT results in smokers and mild COPD patients, and in contrast with the study of Di Marco et al, the resistive parameters presented a highly significant increase (R0, R4, Rm; ).Citation6,Citation13,Citation49–Citation51 In the study of Shinke et al approximately 60% of the studied smokers showed elevated resistance.Citation52 Using an impulse-oscillation system, Frantz et al and Elbehairy et al showed that pulmonary resistance can indicate abnormalities earlier than conventional spirometric parameters, while Crim et al found increased resistance values in subjects with mild COPD.Citation9,Citation53,Citation54 Reasonable relationships were observed among the resistive parameters and the spirometric indices (), mainly the indices associated with airway obstruction. These observations are consistent with the results of previous studies.Citation55 The resistive changes in reflect the worsening airway obstruction in COPD, which further supports this interpretation as a deterioration of the pathophysiological process.
In the present study, the mean values of S, Xm and fr did not change significantly in smokers and mild COPD (). These findings are consistent with previous results in smokers and mild COPD patients, providing additional evidence that these parameters are not useful as an index for the initial effects of COPD.Citation5,Citation13,Citation51 In contrast, studies using impulse oscillometry described significant changes in the frequency dependency of the resistive values and the fr in mild COPD.Citation53 The presence of smoking and mild COPD resulted in lower average values of Cdyn and increased values of Ax and Z4 (). These results are in close agreement with those described in previous studies in smokers and mild COPD patients, and suggest that these parameters might be useful in detecting early changes in COPD.Citation6,Citation13,Citation50,Citation51 The increase in Z4 is in close agreement with previous works showing that smokers with small airway dysfunction may be faced with combined increases in resistive and elastic loading, and that subjects with mild airflow limitation due to COPD require a significantly higher total amount of work to breathe.Citation26,Citation54 Statistically significant correlations were observed between reactive and spirometric parameters (). It is interesting to note that in general, these correlations were higher than that observed in resistive parameters (), in agreement with previous results.Citation55
The changes in the parameters of the eRIC model are described in . Similar increases in R were observed in the smoking and mild COPD groups relative to control (). This parameter is related to increased secretion and changes in the pulmonary parenchyma.Citation48 Similarly, Rt increased with disease severity (). This resistance corresponds to the amount of obstruction in the entire respiratory system, that is, the sum of the factors R and Rp.Citation56 Considering that Rp is associated with peripheral airways, these results are consistent with the presence of smoking.Citation57 It is known that the dysfunction of small airways is a nonspecific disorder often related to smoking. In line with these interpretations, the resistive parameters obtained from the eRIC model (Rp and Rt) were significantly associated with the spirometric indices of central and peripheral airway obstruction ().
While the changes observed in I were not significant in any of the studied groups (), C presented similar reductions in smokers and mild COPD (). In line with these results, shows that I and C were related to the airway obstruction and lung volumes and that higher associations were observed for C. This behavior could be associated with a reduction in the respiratory system compliance or with an increase in the peripheral airway resistance.Citation58
shows that tobacco use and the presence of mild COPD in the studied groups were associated with an increase in FrL. This increase is related to the resistive properties, which are captured in this model from the real part of the fractional inertance. The significant inverse correlations of FrL and α with FEV1 and FEF25%–75% () link these parameters to airway obstruction. This result is consistent with the pathophysiology because during disease progression, airway resistance increases due to increased secretion and changes in the pulmonary parenchyma.Citation59 In line with this proposition, we found that α decreased in subjects with mild COPD (). This finding reflects an increased influence of FrL in the resistive properties of the respiratory system (), which is necessary, to adequately describe the underlying abnormal physiological process.
The comparative analysis showed that the FrC values were similar in the controls, smokers and mild COPD patients (). Interestingly, the associated fractional increase in respiratory resistance at lower frequencies mild COPD patients (). Another finding supporting this interpretation was the association of α with spirometric parameters of small airway obstruction (; FEF25%–75%).
G reflects the energy dissipation in the respiratory system. In agreement with previous findings in patients with asthma, increased values were found with smoking and mild COPD ().Citation27 We can suppose that this increase may be explained, at least in part, by the proportional increase in airflow heterogeneity throughout the lung, due to changes in peripheral compliance and resistance. In line with this interpretation, extensive small airway (<2 mm in diameter) inflammation has been described in smokers who do not fit the conventional diagnostic criteria for COPD; this inflammation resulted in increased airflow resistance, which was associated with delayed mechanical time constants.Citation54 Another possible explanation is related to the increase in parenchymal deformity.Citation27 In agreement with these interpretations, inverse associations between G and spirometric indices were observed, including those related to peripheral obstruction [, FEV1 (L) and FEF25%–75%].
The reduction in H, described in , may also be explained by the increase in parenchymal deformity.Citation27 Ionescu et al showed decreased H values in patients with severe COPD, which may be associated with decreased elastance of lung parenchyma.Citation28 The results described in clearly provide additional support to this hypothesis, extending these findings to patients with mild COPD and smokers. It is interesting to note that the decrease in H in is in contrast with the increase in H observed in a recent study of Faria et al, in which the effect of increased values of airway obstruction in asthmatic subjects was investigated.Citation27
The increase in hysteresivity in smokers () reflects the increase in heterogeneity and changes in pulmonary structure. As pointed out previously, smokers with a relatively preserved FEV1 value and conventional spirometric parameters within normal limits may have extensive small-airway impairment related to hypersecretion and inflammation.Citation26,Citation54 The increase in hysteresivity is even more evident in the presence of mild COPD. This result is in close agreement with typical COPD pathology and may also be associated with a proportional increase in airflow heterogeneity throughout the lung with increasing tobacco use ().Citation1 As seen in , η was associated with several spirometric parameters, mainly parameters associated with central and peripheral airway obstruction. In close agreement with our results in smokers and mild COPD patients, Ionescu et al observed increased damping, elastance and hysteresivity using fractional-order models in patients with more advanced COPD [FEV1(%)=43±9].Citation29
A recent document from the scientific societies of five European countries thoroughly discussed COPD with “mild” airflow limitation, and directed the attention of the scientific community to this condition.Citation26 It was pointed out that for patients with mild airflow limitation, exclusive reliance on spirometry may result in underestimation of clinically important physiologic impairments. The results of the present study are in line with this proposition, and with previous works showing that marked impairments were observed in subjects with mild airway obstruction and symptomatic smokers with borderline spirometry.Citation8,Citation49
The current study shows that FOT can adequately detect abnormal changes in the respiratory mechanics of smokers and patients with mild COPD ( and ). Previous studies suggested that measurement of impedance with FOT has the potential to assess mild COPD; these studies also provided clear evidence suggesting that FOT may detect changes in distal airway function earlier than conventional spirometry, even in the setting of normal spirometric parameters.Citation9,Citation26,Citation60,Citation61 These findings are, therefore, providing a further step towards diagnostic validation of FOT in the analysis of the early effects of COPD. To the best of our knowledge, this is the first study directly examining the use of FrOr modeling to perform this important task. Notably, we observed a nearly complete discrimination when this methodology was used (). In smoker subjects, a high diagnostic accuracy was obtained (AUC >0.9) using the best FrOr parameter, while traditional FOT and eRIC modeling achieved only adequate diagnostic accuracy (AUC >0.8) (). The comparative analysis of the AUCs, however, showed no significant differences. For patients with mild COPD, the best FrOr parameter was significantly more accurate than traditional FOT and eRIC modeling parameters (). This finding represents an important improvement in the diagnostic accuracy of early changes due to smoking and COPD. The finding that the highest accuracy values were obtained with the FrOr model is consistent with previous results in subjects with mild asthma and in workers exposed to asbestos.Citation27,Citation62 This finding can be explained by the capacity of the FrOr models to adjust to fractional values of 20 dB/dec; in contrast, integer-order models are limited to integer multiples of 20 dB/dec. The inclusion of a real part that is dependent on frequency may have contributed to a more accurate description of the dynamic response of the respiratory system and to the consequent increase in the diagnostic accuracy. This improved accuracy is described in , mainly when increasing resistance is observed ().
Table 7 Diagnostic accuracy, sensitivity, specificity and cut-off point for the traditional, eRIC and FrOr parameters in detecting respiratory alterations in patients with mild COPD
Since the first studies in the 1960s, FOT has emerged as a powerful method not only to provide insight into the mechanisms responsible for smoking-induced respiratory diseases but also to provide clinically relevant information.Citation63 Several recent improvements in the areas of sensors and signal processing have allowed FOT to achieve a high level of sophistication. A recent meta-analysis suggested a potential role for FOT in the diagnosis of COPD but indicated that further studies in large groups of patients and subjects were required to confirm these findings.Citation64 This method is particularly attractive for CPOD from a clinical point of view since FOT is measured during normal tidal breathing. Plethysmography is cumbersome and requires significant coordination and cooperation from the patient. FOT may therefore be an appropriate alternative for the management of COPD since these patients are often older and may find plethysmography difficult to perform. In this sense, a recent study concluded that FOT was useful as a simple and accurate tool in patients with geriatric COPD who have difficulties performing conventional lung function tests.Citation65 Given the high clinical relevance of the identification of the silent but destructive progression of the airway disease in COPD in vulnerable populations, this paper provides evidence that changes in impedance parameters might indicate early pathophysiological changes in the airways of smokers and mild COPD.
Conclusion
We hypothesized that modeling the respiratory impedance measurements using a FrOr model may offer a more sensitive indicator of the initial changes in respiratory mechanics, providing an additional tool to diagnose early COPD. Initially, it was observed that the pathophysiology of COPD was adequately described by the traditional FOT parameters, the eRIC model, and the studied FrOr model. These results provide physiological insight into the initial effects of smoking on lung mechanics. The diagnostic accuracy analyses indicate that FOT parameters and eRIC modeling may adequately identify these changes. More importantly, the use of FrOr modeling significantly improved this process, allowing the early diagnosis of smokers and patients with mild COPD with high accuracy. This result indicates that FrOr parameters may play an important role in the early diagnosis of COPD, which is crucial in improving the clinical management of the disease.
Acknowledgments
The Brazilian Council for Scientific and Technological Development (CNPq) and Rio de Janeiro State Research Supporting Foundation (FAPERJ) supported this study. This study was financed in part by the Coordenação de Aperfeiçoamento de Pessoal de Nível Superior – Brasil (CAPES) – Finance Code 001.
Supplementary material
Supplementary data S1
Instrumentation
FOT measurements were performed using an instrument developed in our laboratory and were characterized by low pressure oscillations in the frequency range between 4 and 32 Hz with an amplitude of 1 cm H2O.Citation1 This signal was produced by a speaker and transmitted to the respiratory system by a mouthpiece. The resulting flow and pressure signals were measured near the mouth by a pneumotachometer and a pressure transducer, respectively. After amplification, these signals were processed using the Fourier transform (F) to estimate the respiratory impedance (Zrs) by the ratio between the pressure (P) and respiratory flow (V´) signals [Zrs=F(P)/F(V´)]. During the FOT tests, three trials of approximately 16 seconds were performed with the individuals sitting with their trunk and their head in the neutral position and using a nasal clip. The subjects breathed quietly through a silicone mouthpiece and held their cheeks with their hands.
Reference
- de MeloPLWerneckMMGiannella-NetoANew impedance spectrometer for scientific and clinical studies of the respiratory systemReview of Scientific Instruments200071728672872
Disclosure
The authors report no conflicts of interest in this work.
References
- AgustiAVogelmeierCFGlobal Strategy for the Diagnosis, Management, and Prevention of Chronic Obstructive Lung Disease 2018 ReportGOLD Executive Summary2018 Available from: http://www.ncbi.nlm.nih.gov/pubmed/28128970Accessed March 21, 2018
- SilvaKKLopesAJJansenJMde MeloPLTotal inspiratory and expiratory impedance in patients with severe chronic obstructive pulmonary diseaseClinics201166122085209122189734
- WesselingGMostertRWoutersEFA comparison of the effects of anticholinergic and beta 2-agonist and combination therapy on respiratory impedance in COPDChest199210111661731530836
- AlmagroPSorianoJBUnderdiagnosis in COPD: a battle worth fightingLancet Respir Med20175536736828389226
- AmaralJLLopesAJJansenJMFariaACMeloPLMachine learning algorithms and forced oscillation measurements applied to the automatic identification of chronic obstructive pulmonary diseaseComput Methods Programs Biomed2012105318319322018532
- di MangoAMLopesAJJansenJMMeloPLChanges in respiratory mechanics with increasing degrees of airway obstruction in COPD: detection by forced oscillation techniqueRespir Med2006100339941016115754
- BaiJWChenXXLiuSYuLXuJFJfXSmoking cessation affects the natural history of COPDInt J Chron Obstruct Pulmon Dis2017123323332829180862
- JonesPWBrusselleGdal NegroRWHealth-related quality of life in patients by COPD severity within primary care in EuropeRespir Med20111051576620932736
- FrantzSNihlénUDenckerMEngströmGLöfdahlCGWollmerPImpulse oscillometry may be of value in detecting early manifestations of COPDRespir Med201210681116112322613172
- SansoresRHVelázquez-UncalMPérez-BautistaOVillalba-CalocaJFalfán-ValenciaRRamírez-VenegasAPrevalence of chronic obstructive pulmonary disease in asymptomatic smokersInt J Chron Obstruct Pulmon Dis2015102357236326586941
- SuiCFMingLCNeohCFIbrahimBVitalQPlus: a potential screening tool for early diagnosis of COPDInt J Chron Obstruct Pulmon Dis2015101613162226316735
- LopesAJde MeloPLBrazilian studies on pulmonary function in COPD patients: what are the gaps?Int J Chron Obstruct Pulmon Dis2016111553156727468230
- FariaACLopesAJJansenJMMeloPLEvaluating the forced oscillation technique in the detection of early smoking-induced respiratory changesBiomed Eng Online200982219781078
- BatesJHIrvinCGFarréRHantosZOscillation mechanics of the respiratory systemCompr Physiol2011131233127223733641
- FariaACDLopesAJJansenJMMeloPLAssessment of respiratory mechanics in patients with sarcoidosis using forced oscillation: correlations with spirometric and volumetric measurements and diagnostic accuracyRespiration20097819310419372637
- MirandaIADias FariaACLopesAJJansenJMLopes de MeloPOn the Respiratory Mechanics Measured by Forced Oscillation Technique in Patients with Systemic Sclerosis8PLoS One2013
- de Sa PmLAJJansenJMde MeloPLOscillation mechanics of the respiratory system in never-smoking patients with silicosis: pathophysiological study and evaluation of diagnostic accuracyClinics201368564465123778400
- de SáPMCastroHALopes Melo PldeAJEarly diagnosis of respiratory abnormalities in asbestos-exposed workers by the forced oscillation techniquePLoS One2016119e016198127612198
- QiGSZhouZCGuWCDetection of the airway obstruction stage in asthma using impulse oscillometry systemJ Asthma2013501455123189951
- NilssonAMTheanderEHesselstrandRPiitulainenEWollmerPMandlTThe forced oscillation technique is a sensitive method for detecting obstructive airway disease in patients with primary Sjögren’s syndromeScand J Rheumatol201443432432824392743
- PetersUHernandezPDechmanGEllsmereJMaksymGEarly detection of changes in lung mechanics with oscillometry following bariatric surgery in severe obesityAppl Physiol Nutr Metab201641553854727109263
- ReischSSchneiderMTimmerJGeigerKGuttmannJEvaluation of forced oscillation technique for early detection of airway obstruction in sleep apnea: a model studyTechnol Health Care1998642452579924952
- ReischSSteltnerHTimmerJRenotteCGuttmannJEarly detection of upper airway obstructions by analysis of acoustical respiratory input impedanceBiol Cybern1999811253710434389
- FrantzSNihlénUDenckerMEngströmGLöfdahlCGWollmerPImpulse oscillometry may be of value in detecting early manifestations of COPDRespir Med201210681116112322613172
- BrusascoVBarisioneGCrimiEPulmonary physiology: Future directions for lung function testing in COPDRespirology201520220921825257934
- RossiAButorac PetanjekBChilosiMChronic obstructive pulmonary disease with mild airflow limitation: current knowledge and proposal for future research – a consensus document from six scientific societiesInt J Chron Obstruct Pulmon Dis2017122593261028919728
- FariaACDVeigaJLopesAJMeloPLForced oscillation, integer and fractional-order modeling in asthmaComput Methods Programs Biomed20161281122627040828
- IonescuCMde KeyserRRelations between fractional-order model parameters and lung pathology in chronic obstructive pulmonary diseaseIEEE Trans Biomed Eng200956497898719272937
- IonescuCDeromEde KeyserRAssessment of respiratory mechanical properties with constant-phase models in healthy and COPD lungsComput Methods Programs Biomed2010971788519628290
- IonescuCMThe Human Respiratory System: an Analysis of the Interplay Between Anatomy, Structure, Breathing and Fractal DynamicsLondonSpringer-Verlag2013
- IonescuCDesagerKde KeyserRFractional order model parameters for the respiratory input impedance in healthy and in asthmatic childrenComput Methods Programs Biomed2011101331532321145613
- IonescuCMDesagerKVandersteenGde KeyserRRespiratory mechanics in children with cystic fibrosisBiomed Signal Process Control2014117479
- MillerMRStandardisation of spirometryEur Respir J200526231933816055882
- PeslinRMethods for measuring total respiratory impedance by forced oscillationsBulletin Europeen de Physiopathologie Respiratoire19862266216313828554
- LutchenKRGreensteinJLSukiBHow inhomogeneities and airway walls affect frequency dependence and separation of airway and tissue propertiesJ Appl Physiol1996805169617078727557
- MacleodDBirchMRespiratory input impedance measurement: Forced oscillation methodsMed Biol Eng Comput200139550551611712646
- CavalcantiJVLopesAJJansenJMMeloPLDetection of changes in respiratory mechanics due to increasing degrees of airway obstruction in asthma by the forced oscillation techniqueRespir Med2006100122207221916713226
- MerazEGNazeranHRamosCDAnalysis of impulse oscillometric measures of lung function and respiratory system model parameters in small airway-impaired and healthy children over a 2-year periodBiomed Eng Online20111012121439045
- NagelsJLandserFJvan der LindenLClementJvan de WoestijneKPMechanical properties of lungs and chest wall during spontaneous breathingJ Appl Physiol19804934084167204163
- LapradASLutchenKRRespiratory impedance measurements for assessment of lung mechanics: Focus on asthmaRespir Physiol Neurobiol20081631–3647318579455
- RibeiroCOFariaACDLopesAJMeloPLEarly Diagnosis of the Effects of Smoking and Chronic Obstructive Pulmonary Disease based on Forced Oscillations and Fractional-order ModellingXXVI Congresso Brasileiro de Engenharia Biomédica – CBEB 2018Rio de JaneiroBúzios2018 Available from: http://www.cbeb.org.br/Accessed January 1, 2018
- BossuytPMReitsmaJBBrunsDESTARD 2015: an updated list of essential items for reporting diagnostic accuracy studiesBmj2015351h552726511519
- SwetsJMeasuring the accuracy of diagnostic systemsScience19882404857128512933287615
- GolpeRJimenezACarpizoRCifrianJMUtility of home oximetry as a screening test for patients with moderate to severe symptoms of obstructive sleep apneaSleep199922793293710566911
- HanleyJAMcneilBJThe meaning and use of the area under a receiver operating characteristic (ROC) curveRadiology1982143129367063747
- DawsonBTrappRGBasic & Clinical Biostatistics4th edNew YorkLange Medical Books - McGraw-Hill Medical Pub. Division2004
- OostveenEPeslinRDuvivierCRotgerMMeadJAirways impedance during single breaths of foreign gasesJ Appl Physiol1991715181318211761478
- VogelmeierCFCrinerGJMartinezFJGlobal Strategy for the Diagnosis, Management, and Prevention of Chronic Obstructive Lung Disease 2017 Report. GOLD Executive SummaryAm J Respir Crit Care Med2017195555758228128970
- di MarcoFTerraneoSJobSCardiopulmonary exercise testing and second-line pulmonary function tests to detect obstructive pattern in symptomatic smokers with borderline spirometryRespir Med201712771328502420
- da CostaGMFariaACDdi MangoAMGTLopesAJLopes de MeloPRespiratory impedance and response to salbutamol in healthy individuals and patients with COPDRespiration201488210111124992904
- FariaACDCostaAadaLopesAJJansenJMMeloPLForced oscillation technique in the detection of smoking-induced respiratory alterations: diagnostic accuracy and comparison with spirometryClinics201065121295130421340218
- ShinkeHYamamotoMHazekiNKotaniYKobayashiKNishimuraYVisualized changes in respiratory resistance and reactance along a time axis in smokers: A cross-sectional studyRespir Investig2013513166174
- CrimCCelliBEdwardsLDRespiratory system impedance with impulse oscillometry in healthy and COPD subjects: ECLIPSE baseline resultsRespir Med201110571069107821481577
- ElbehairyAFGuenetteJAFaisalAMechanisms of exertional dyspnoea in symptomatic smokers without COPDEur Respir J201648369470527492828
- YamamotoSMiyoshiSKatayamaHUse of the forced-oscillation technique to estimate spirometry valuesInt J Chron Obstruct Pulmon Dis2017122859286829042766
- BohadanaATeculescuDMartinetYMechanisms of chronic airway obstruction in smokersRespir Med200498213915114971877
- LimaANFariaACDLopesAJJansenJMMeloPLForced oscillations and respiratory system modeling in adults with cystic fibrosisBiomed Eng Online20151411125889005
- HyattREScanlonPDNakamuraMStatic (absolute) lung volumesHyattREScanlonPDNakamuraMInterpretation of Pulmonary Function TestsPhiladelphiaLippincott-Raven19972740
- KaczkaDWDellacáRLOscillation mechanics of the respiratory system: applications to lung diseaseCrit Rev Biomed Eng201139433735922011237
- OppenheimerBWGoldringRMBergerKIDistal airway function assessed by oscillometry at varying respiratory rate: comparison with dynamic complianceCOPD20096316217019811371
- ShiYAlediaASTatavoosianAVVijayalakshmiSGalantSPGeorgeSCRelating small airways to asthma control by using impulse oscillometry in childrenJ Allergy Clin Immunol2012129367167822178635
- MarinhoCLMaioliMCPLopesAJMeloPLForced oscillation, fractional-order modeling and functional exercise capacity in adults with sickle cell anemiaPLoS One2017 Submitted
- FariaACDDames da SilvaKKCostaGMLopesAJMeloPLForced oscillation technique in the detection of smoking-induced respiratory changesHudakRPenhakerMMajernikJBiomedical Engineering – Technical Applications in Medicine1 Chapter 13RijekaInTech2012
- PangC-SChenMHuJWenF-QPangCMCHuJFWDiagnostic value of oscillation technique for chronic obstructive pulmonary disease: a meta-analysisCurr Sci2015109916971703
- TseHNTsengCZSWongKYYeeKSNgLYLyNAccuracy of forced oscillation technique to assess lung function in geriatric COPD populationInt J Chron Obstruct Pulmon Dis2016111105111827307726