
 ?Mathematical formulae have been encoded as MathML and are displayed in this HTML version using MathJax in order to improve their display. Uncheck the box to turn MathJax off. This feature requires Javascript. Click on a formula to zoom.
Abstract
This study was aimed at developing a controlled-release cetirizine hydrochloride (CTZ)-loaded polymethacrylate microsphere by optimization technique using software-based response surface methodology. The emulsion solvent evaporation method was utilized in the preparation of microspheres. Four process variables were selected, namely, Eudragit RLPO loading percentage in total polymer, the emulsifier hydrophilic lipophilic balance (HLB), the antitacking percentage, and the dispersed phase volume. The desired responses were particle size, angle of repose, production yield, encapsulation efficiency, loading capacity, initial drug release, and the time for 85% of drug release from the microspheres. Optimization was carried out by fitting the experimental data to the software program (Statgraphics Centurion XV). Moreover, 18 batches were subjected to various characterization tests required for the production of dosage form. The pharmacokinetic parameters were evaluated after the oral administration of 10 mg CTZ in both optimized formulation and commercial product on healthy human volunteers using a double-blind, randomized, cross-over design. The optimized formulation showed satisfactory yield (84.43%) and drug encapsulation efficiency (87.1%). Microspheres were of spherical shape, smooth surface, and good flowability with an average size of 142.3 μm. The developed optimized batch of microspheres ensured 28.87% initial release after 2 hours, and the release of CTZ extended for >12 hours. In addition, the relative bioavailability of the optimized formulation was 165.5% with respect to the marketed CTZ tablets indicating a significant enhancement of CTZ bioavailability. Thus, there is an expectation to decrease the administered dose and the frequency of administration, and subsequently minimize the adverse effects that are faced by the patient during the treatment.
Introduction
In comparison with the conventional unit dosage form, polymeric multiunit microparticulate dosage forms have received massive scientific and industrial interest as they are distributed more uniformly throughout the gastrointestinal tract, which facilitates a uniform reliable sustained drug release pattern.Citation1 Thus, these dosage forms are mostly suggested by health care professionals and ideal for patient compliance where drug safety is a main concern.Citation2
For instance, emulsion solvent evaporation (ESE) process is a capable technique for the production of microspheres with controlled-release profile using different bio-compatible water-insoluble polymers.Citation3,Citation4 Many formulation and processing variables could be involved in the preparation of microspheres by the ESE method, eg, the molecular weight of the polymers and the viscosity of the polymeric solution,Citation5 solvent mixture composition, and stirring speed.Citation6 Also, the drug to polymer ratio affects the properties of the prepared microspheres,Citation7,Citation8 while the concentration of polymer, drug to polymer ratio, percentage of the surfactant, and pore inducing agent affect the release and properties of microcapsules.Citation9 In a different study, the yield, the size of microspheres, and the release rate were increased by the addition of a nonsolvent.Citation10 Hariharan and PriceCitation11 reported that the properties of polylactic acid microparticles containing hexamethylamine were affected by the surfactant and cosolvent concentration. Moreover, the effect of drug loading, the concentration of emulsifier and polymer as formulation factors, and stirring speed as a process parameter were investigated on the characteristics of microparticles.Citation12 In another study, the effects of the rate of temperature increase on dextran release profile were evaluated.Citation13
Although the ESE technique is a complex process, it depends mainly on the efficient emulsification and the rate of solvent evaporation. The major challenge remains in the encapsulation of water-soluble drugs within microspheres to extend their release. This challenge arises from the escaping or degradation of drug during the preparation. To achieve this goal, the optimization of the process variables using Draper–Lin small composite experimental design has been made. Draper–Lin small composite design (D-LSCD) is a highly efficient optimization tool that is used to develop mathematical models for the estimation of relationships between the responses and key variables.
Cetirizine hydrochloride (CTZ) is one of the second-generation histamine H1 receptor antagonists, with a rapid onset of action that is used in the treatment of seasonal allergic rhinitis, hay fever, angioedema, and chronic urticaria.Citation14
In this study, we report the influence of Eudragit RLPO loading percentage in total polymer (X1), the emulsifier hydrophilic lipophilic balance (HLB) (X2), the antitacking percentage (X3), and the dispersed phase volume (X4) on the quality attributes of CTZ-loaded polymethacrylate microspheres. These are the mean particle size, angle of repose, production yield percentage, encapsulation efficiency, loading capacity, and release pattern of CTZ as a model of water-soluble drugs from the prepared microspheres. So, the objective of this study was to develop innovative erodible microspheres for the delivery of CTZ and understand the effect of processing factors on the newly developed formula, in an attempt to maximize the encapsulation efficiency and retard the release of CTZ from the microspheres.
Materials and methods
Materials
CTZ was kindly gifted from Deef Pharmaceutical Industries Co. (Al Badayea, KSA). Eudragit RSPO and RLPO were kindly supplied by Evonik Industries (Essen, Germany). Talc powder from Whittaker Clark & Daniels (South Plainfield, NJ, USA); dichloromethane and acetone from Prolabo (Paris, France); n-hexane 95% from Honil Limited (London, UK); acetonitrile high-performance liquid chromatography (HPLC) grade from EMD Millipore (Billerica, MA, USA); potassium dihydrogen orthophosphate from BDH Chemicals Ltd. (England); light liquid paraffin from WINLAB (Leicestershire, UK); and sorbitan monooleate, NF, Span 80 from Sigma Chemicals (Perth, Australia) were purchased. All other materials were of analytical grade and used without any further purification.
Methods
The design of experiment
A full randomized rotatable D-LSCD was adopted to explore the impact of four important process factors on the quality attributes of CTZ-loaded polymethacrylate microspheres and analyze the interaction of each level of factors on the desired responses. The design of experiment was generated within the domain of levels using Statgraphics Centurion XV, version 15.2.05, software (StatPoint, Inc., Warrenton, VA, USA). As listed in , 18 different batches of CTZ-loaded polymethacrylate microspheres were prepared (eight batches as the cube portion, eight batches as the star points, and two batches as the center points). To make this design rotatable, for each factor, two axial points were chosen to be 1.68 at the lower and higher extreme levels, and the runs were randomized in order to exclude the block effects.Citation15 Besides that, the process factors were Eudragit RLPO loading percentage in total polymer (X1), the emulsifier HLB (X2), the antitacking percentage (X3), and the dispersed phase volume (X4). The selected responses were the mean particle size of the microspheres (Y1), angle of repose for the prepared batches (Y2), production yield percentage (Y3), encapsulation efficiency percentage (Y4), loading capacity (Y5), initial CTZ release from microspheres (Y6), and time for 85% of drug release (Y7). The design matrix including investigated process variables along with their levels is shown in .
Table 1 Design matrix including investigated process variables with their levels
Preparation of the required HLB from the emulsifier blend
To prepare the emulsifier with HLB of 2.83, 58.8% of Span 85 was mixed with 41.2% of Span 80, while 46.07% of Span 80 and 53.93% of Tween 80 would produce an emulsifier with HLB value=10.07. Also, the emulsifier with HLB of 6.45 was prepared by blending 50% of both Span 80 and Span 20.
Preparation of microspheres
Each batch of CTZ-loaded polymethacrylate microspheres was prepared by loading fixed quantity of pure CTZ (500 mg). Furthermore, accurately weighed amount of drug, talc, and the mixture of Eudragit RSPO (ERS) and Eudragit RLPO (ERL) polymers, at drug to polymer ratio of 1:7, were dispersed in the specified volume of mixed solvent system of dichloromethane and acetone (1:1, v/v) forming the dispersed phase. The obtained dispersion was stirred at 1,000 rpm (Steady stir Digital, 855; Thermo Fisher Scientific, Waltham, MA, USA) in mineral oil (light liquid paraffin, 100 mL) to form oil-in-oil emulsion using the specified emulsifiers with different hydrophilic lipophilic balance (2%, w/w). Also, the emulsion was continuously stirred for a period of 6 hours till complete evaporation of solvent from the dispersed phase. The hardened microspheres were filtered off and washed with n-hexane (50 mL, four times) and dried under vacuum for a period of 24 hours and stored in a desiccator for further use.
Micromeritics evaluation of microspheres
The mean particle size of the prepared batches was evaluated by sieving method as previously reported,Citation16 whereby the arithmetic mean diameter of the microspheres was calculated using EquationEquation 1(1) . Also, the flowability of the microspheres expressed as the angle of repose was assessed. The standard procedures for these determinations were followed as described earlier.Citation16–Citation19
Production yield
On calculation of the weight of the raw materials used in the preparation and the final weight of the produced microspheres, the production yield percentage of the microspheres was calculated (EquationEquation 2(2) ).
Encapsulation efficiency and loading capacity
A total of 50 mg of each formulation was dissolved in freshly prepared phosphate buffer (50 mL/pH 7.4) and maintained on a mechanical shaker for 24 hours, filtered and suitably diluted, then determined using HPLC (Agilent 1200 series, equipped with an ultraviolet diode array detector and an automatic sampling system, Agilent, CA, USA) at 229 nm (n=3). The encapsulation efficiency and the actual loading capacity expressed in percentage were calculated according to EquationEquations 3(3) and Equation4
(4) .
In vitro release study
In this section, United State Pharmacopoeia dissolution tester apparatus II (Erweka GmbH DT 700; Heusenstamm, Germany) was applied for evaluating the in vitro release of CTZ from the prepared microspheres. A hard gelatin capsule of suitable size was filled with the prepared microspheres equivalent to 10 mg of CTZ. Besides that, the experiment was carried out using 900 mL of freshly prepared phosphate buffer (pH 7.4), at 37°C±0.5°C and 50 rpm. Sample aliquots were withdrawn and replenished with fresh media at time intervals of 0.5 hours, 1 hour, 2 hours, 4 hours, 6 hours, 9 hours, 12 hours, 16 hours, 20 hours, and 24 hours. The CTZ content in the filtered samples was analyzed using HPLC (Agilant 1200 series) using reversed-phase column 25 cm ×4.6 mm (id) C18, 5 mm – Inertsil® ODS-3 (GL Sciences Inc., Tokyo, Japan). The mobile phase consisted of a mixture of (28:72) acetonitrile/0.05 M potassium dihydrogen orthophosphate (pH 3.5), and the flow rate was 1 mL/min. In addition, the CTZ content was determined at 229 nm after injecting a volume of 10 L, in which CTZ was detected at a retention time of 3.5 minutes. Assay performance was further evaluated through determination of specificity, recovery, linearity, the limit of quantification, the limit of detection, precision, and accuracy as reported in the International Conference on Harmonisation guidelines. The release experiments were done in triplicate.
Kinetic treatment of CTZ release data
The release data of CTZ were mathematically fitted to different kinetic models: zero-order,Citation20 first-order,Citation21 Higuchi,Citation22 and Korsmeyer–Peppas models that are often utilized to designate the drug release mechanism from the microspheres.Citation23,Citation24
Scanning electron microscopy
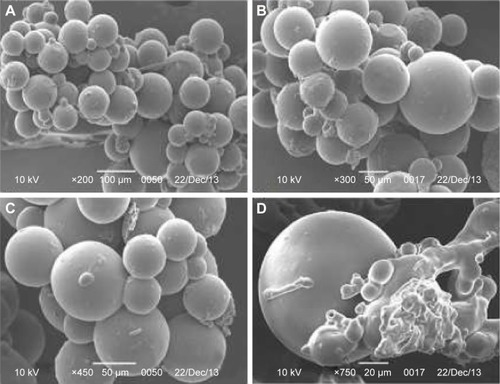
The morphology of CTZ-loaded polymethacrylate microspheres, including shape and surface, was examined using scanning electron microscope (Philips XL30; FEI, Hillsboro, OR, USA). At this stage, the samples were mounted onto stubs covered with clean glass and coated with gold palladium film (thickness 2 nm) for 120 seconds at 10 mA, under argon at low pressure and investigated at 4–25 kV. The obtained photomicrographs of the formulation with suitable magnification are given in .
Figure 1 Scanning electron photomicrographs of the optimized CTZ microspheres at (A) ×200 magnification, (B) ×300 magnification, (C) ×450 magnification, and (D) ×750 magnification.
In vivo study on human volunteers
The pharmacokinetic parameters of the optimized CTZ microspheres (test) were evaluated in comparison with those of Zyrtec® tablet (reference; GlaxoSmithKline plc, London, UK) after the oral administration of 10 mg single dose to healthy adult, male and nonpregnant female volunteers by means of noncompartmental analysis.
Study design and conduct
The study used single-center, open-label, randomized, single dose with a two-way cross-over design. Two weeks of screening preceded two 36-hour study periods, which were separated by a washout period of at least 1 week. During these study periods, the subjects were given a single oral dose of the optimized CTZ microspheres equivalent to 10 mg (test) or the marketed tablets (reference) with 250 mL of tap water in each period of the study. Also, the subjects were confined in-house for 36 hours prior to and after drug administration, so that regular blood sampling could be done at predetermined times (as described in the “Blood sampling” section).
The study was conducted at the Institutional Review Board of the Egyptian Research and Development Company (ERDC), Cairo, Egypt, that has been endorsed for the ethical conduct of the study and had approved the protocol on its expedited meeting on October 19, 2014. Also, the study was performed in compliance with the Declaration of Helsinki and the International Conference on Harmonisation of Good Clinical Practices and with the approval from the study site’s Independent Ethics Committee.
Subjects
Six healthy Egyptian male and nonpregnant female volunteers with a mean age of 27±1.9 years, median weight of 69.5±5.9 kg, and median height of 168.2±4.7 cm participated in the study after understanding and signing an informed written consent about the nature and consequences of the study. The ERDC staff informed the subjects, in nontechnical terms, of the objectives, dates, drugs, diet, potential risks, and general activities during the clinical part of the study. Also, the subjects had been asked to read the consent forms carefully before signing. Upon examination and from results of clinical laboratory tests of all volunteers, the data revealed that all volunteers had normal results and they were advised to stay away from any medications at least 2 weeks prior to and during the study period.
Blood sampling
A total of 5 mL of blood was drawn just before and at 0.5 hours, 1 hour, 1.5 hours, 2 hours, 2.5 hours, 3 hours, 4 hours, 6 hours, 8 hours, 10 hours, 12 hours, 18 hours, 24 hours, and 36 hours after the oral administration of both the test and reference and collected in heparinized tubes. Samples were centrifuged at 3,000 rpm for 5 minutes, and plasma samples were collected and stored at −20°C until analysis.
Chromatographic conditions
Plasma CTZ concentrations were analyzed by liquid chromatography-mass spectrometry (LC-MS)/MS method applying the procedure reported by Tan et al.Citation25 An HPLC method coupled with mass spectrometric detection (LC-MS/MS) was developed, optimized, and validated at ERDC laboratories for the determination of CTZ in human plasma. Moreover, the method was fully validated according to the US Food and Drug Administration Bioanalytical Method Validation Guidelines 2003. HPLC Agilent 6420 LC-MS Technologies (Deutschland GmbH, Waldbronn, Germany) system was used with a mass spectrometer detector, Agilent 6420, Triple Quad with G1311A quaternary pump, G1329 autosampler, and G1322A vacuum degasser, whereby the separation was performed on Inertsil ODS-3 column (4.6 mm ×50 cm, dp =5.0 μm). The mobile phase consisted of methanol:water in a volume ratio of 60:40, containing 0.5% triethylamine, and was adjusted to pH 3 using 0.1 N HCl. The components of the mobile phase were mixed and filtered through 0.45 mm nylon Millipore filter and the flow rate of the mobile phase was 1.2 mL/min. Also, the linearity of the assay method was verified within the concentration range of 0.1–30 ng/mL with a regression coefficient (R2) =0.9997±0.0002 for CTZ. All the results were within the acceptance criteria as stated in the recommended guidelines. The mean recovery of CTZ was 94.97% at 0.3 ng/mL and 103.92% at 30 ng/mL.
Plasma analysis
Plasma sample was mixed with acetonitrile and the internal standard (erythromycin), having the mixture vortexed, and then centrifuged at 3,000 rpm. The upper layer was separated and transferred to another tube, then filtered through 0.45 mm Millipore® filter for analysis with HPLC. In all, 20 mL of each sample was injected to the column for analysis.
Pharmacokinetic analysis
Pharmacokinetic parameters from plasma data following the oral administration of the two formulations were estimated using Kinetica® (version 4; Thermo Electron Corp., Waltham, MA, USA). Two-way analysis of variance (ANOVA) followed by Sidak’s multicomparison test using GraphPad Prism 6 (GraphPad Software, Inc., San Diego, CA, USA) were used to verify the differences in drug bioavailability between the two investigated groups. The level of statistical significance was chosen as P<0.05. Maximum plasma concentration (Cmax) (ng/mL), time to reach maximum plasma concentration (tmax) (hours), area under the time-concentration curve from time zero to infinity (AUC0–∞) (ng h/mL), and mean residence time (hours) were calculated from which the relative bioavailability (AUCtest/AUCstandard ×100) was determined.
Results and discussion
The proficient encapsulation of water-soluble drugs in controlling their release from the microspheres is considered as a major challenge for the researchers in this field. In our previous work, we have succeeded in encapsulating CTZ, a model water-soluble drug, in a reasonable percent; however, the control of drug release did not exceed 8 hours.Citation19 Therefore, the prime features of this study were the use of mixed solvent system as a dispersed phase and light liquid paraffin as an immiscible continuous phase to form an oil-in-oil emulsion.Citation26,Citation27 Moreover, the use of mixed polymethacrylate polymer as a retardant polymer by increasing the drug to polymer ratio to 1:7 and incorporating ERLPO with different percentages in the total polymers were aimed at extending the release of drug from the microspheres as well as to maximize its encapsulation efficiency. Besides that, the highly efficient D-LSCD was utilized to explore the effect of the four process factors on the quality attributes of CTZ-loaded polymethacrylate microspheres.
Draper–Lin small composite design
It is known that, typical response surface methodologies are Box–Behnken design and central composite design.Citation28 According to the data listed in , the study deals with four factors, namely, central level of Eudragit RLPO (ERL) loading, emulsifier HLB, talc percentage, and dispersed phase volume, which were 20% w/w, 6.45, 5% w/v, and 10 mL, respectively. In this case, central composite design and Box–Behnken design required 30 runs and 27 runs, respectively. To reduce the number of runs and increase the efficiency, D-LSCD was developed and considered as a highly efficient statistical design.Citation29 In our article, for four independent variables, the quadratic equations (EquationEquations 5(5) –Equation11
(11) ) included 15 coefficients (ie, an independent term, four linear terms, four quadratic terms, and six interaction terms), and the total design runs were only 18 ().
Emulsification and formation of microspheres
The oil-in-oil (O/O) ESE technique was used to prepare CTZ-loaded polymethacrylate microspheres. The technique is correctly referred to as O/O instead of water-in-oil (W/O) as the organic solvent that contains a polymeric solution is considered as oil in microencapsulation terminology.Citation30 This method was established to be the most common, effective, and robust in the encapsulation of drugs with different properties.Citation12 Furthermore, the insolubility of the drug and polymers in liquid paraffin makes it a good candidate as an external phase in the emulsification process. Different emulsifiers with different HLB were used to prevent aggregation of droplets during emulsification and solvent evaporation by reducing the interfacial tension between the droplets and the external phase.Citation31 Besides that, talc powder was added as an antitacking agent to stabilize the droplet and prevent its sticking behavior. Applying 1,000 rpm stirring speed during the microencapsulation process was intended to decrease the size of microspheres. Finally, the prepared microspheres were washed with n-hexane several times to clean their surfaces from residual liquid paraffin without disturbing the integrity of the microspheres.Citation32
Evaluation of CTZ-loaded polymethacrylate microspheres
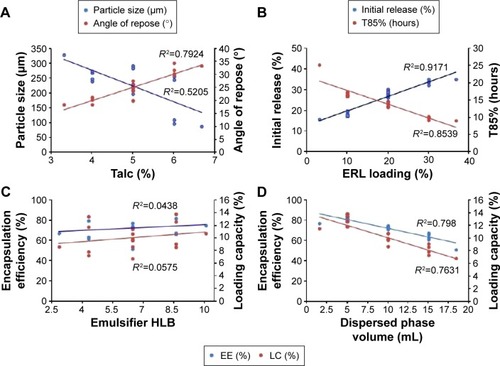
summarizes the observed values of the response parameters studied (Y1–Y7) from the 18 formulations. As listed in , the ESE technique employed in this study produced spherical microspheres with smooth surfaces with different sizes ranging from 87 μm to 330 μm. This variation in particle size changed the angle of repose from 18.5° to 34.5° as an indication of the flow behavior of the microspheres. The size and flowability of the prepared microspheres depended mainly on the percentage of antitacking agent and the volume of the dispersed phase. The particle size of the microspheres can be decreased by the increase in dispersed phase volume, which could be attributed to the increase in volume that lowers the polymer concentration, which produces less viscous dispersion and maximizes the shearing action leading to smaller droplets and subsequently smaller microspheres.Citation33 We can also infer that lower polymer concentration reduces the tendency of collision between the droplets producing smaller microspheres.Citation3 In addition, the dispersed phase volume and the emulsifier HLB significantly (P<0.05) improved the production yield, encapsulation efficiency, and the loading capacity to 97.5%, 86.7%, and 13.9%, respectively. This finding may be due to the increase of the viscosity of the dispersed phase by decreasing its volume, which permits faster solidification and reduces the leaching of CTZ to the continuous phase. As a consequence, the increase in the production yield, encapsulation efficiency, and loading capacity were in agreement with the work reported by Pandit et al.Citation34 However, the release of CTZ from the prepared microspheres was significantly (P<0.05) affected by the ERL loading percentage and HLB of the emulsifier. With respect to different combinations of factors and factor levels, a substantial variation among drug release patterns was obtained. It is obvious from and that the initial release of CTZ after 2 hours increased from 15.57% in batch 17 to 35.19% in batch 2, while the time required for 85% of drug release decreased in the same batches from 25.35 hours to 9.14 hours reflecting the impact of ERL loading% on the release pattern. In general, the USP monographs for extended drug release dosage forms identify the percent of drug released after more than one time point (USP XXIII). An optimal extended-release dosage form must give a minimal initial release, whereas most of the drugs were released in a specific time period. As expected, when ERL was used in high percentage, CTZ was released at a faster rate as compared with the batch containing lower percentage of ERL. This is due to the fact that ERL is rich in the amount of quaternary ammonium groups, which renders it more permeable and hastens the liberation of drug from the microspheres.Citation35,Citation36 and depict that increasing HLB of the emulsifier increased the hydrophilicity and subsequently increased the drug release. Also, increasing the amount of talc decreased the particle size of the microspheres, which influenced CTZ release owing to the large surface area exposed to the dissolution medium.Citation37 Moreover, the correlations of the factors and the obtained responses are presented in .
Table 2 Observed values of responses (Y1–Y7) for 18 formulations of CTZ-loaded polymethacrylate microspheres
Figure 2 Release profiles of CTZ from the D-LSCD formulations; (A) release profiles for F1–F6, (B) release profiles for F7–F12, and (C) release profiles for F13–F18.
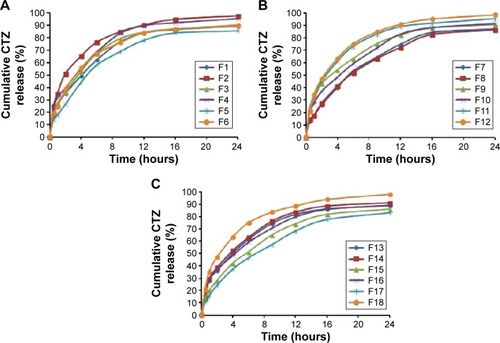
Figure 3 Pareto charts of standardized effects on the particle size (A), angle of repose (B), production yield (C), encapsulation efficiency (D), loading capacity (E), initial release (F), and time for 85% of drug release (G).
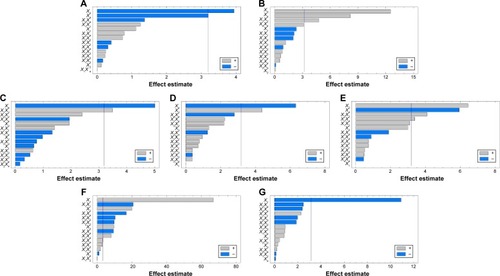
Figure 4 Three-dimensional response surfaces with contour plots below generated from the D-LSCD demonstrating the effect of ERL loading%, emulsifier HLB, talc percentage, and the dispersed phase volume on the particle size (A), angle of repose (B), production yield (C), encapsulation efficiency (D), loading capacity (E), initial release (F), and time for 85% of drug release (G).
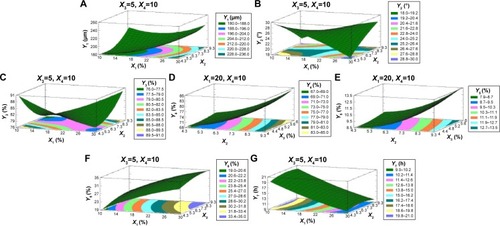
Figure 5 Correlations of the factors and responses.
Abbreviations: HLB, hydrophilic lipophilic balance; ERL, Eudragit RLPO; EE, encapsulation efficiency; LC, loading capacity; T85%, time for 85% of drug release.
Drug release kinetics
The release data of CTZ were fitted to various equations of release kinetics. Most formulations were fit better with Higuchi model (r=0.9563–0.9908) and Korsmeyer–Peppas (r=0.9756–0.9964) equations than other equations (zero order, first order). Moreover, the values of r for the rest of the formulations that fit the first order were very close to the Higuchi model that explains the diffusion control kinetic. Based on the Korsmeyer–Peppas equation, formulations (2–4, 9–12, 16, and 18) with exponent (n) values <0.43 indicated that the release mechanism followed the pure diffusion, Fickian or case I release. On the other hand, formulations (1, 5–8, 13–15, and 17) that have exponent value of 0.43<n<0.85 indicated pure case II, non-Fickian or anomalous release. In general, case II refers to erosion of the polymeric chain, while anomalous transport refers to a combination of both diffusion and erosion controlled-drug release.Citation38 Finally, the release behavior of CTZ from the optimized microspheres was best explained by the first-order equation (r=0.9909) and Korsmeyer–Peppas model (r=0.9874), which supports erosion mechanism. This erosion mechanism for the release is preferable as it sustains the release and may be helpful in avoiding release failure.
Statistical data analysis and model validation
Fitting of data to the model
Four variables with three levels are listed in . All the response variables were observed experimentally for 18 batches as proposed by the D-LSCD and are expressed as the mean ± standard deviation in . Here, the models for different responses were attained using Statgraphics Centurion XV software. Meanwhile, the statistical ANOVA for the measured responses (Y1–Y7) is listed in . The values of probability (P-value), F-ratio, R2, adjusted R2, standard error of estimate, and the mean absolute error values for each response are listed in along with their ANOVA results. After analysis of data, the following correlations for response variables were obtained in terms of coded factors. To quantify response values, model equations (EquationEquations 5(5) –Equation11
(11) ) that carry the variables along with coefficients were obtained. Positive sign of the coefficient indicates synergistic effects, while negative sign represents an antagonistic effect.Citation39
Table 3 Statistical ANOVA of the responses (Y1–Y7)
All the regression equations were found to be statistically significant (P<0.05), as determined using ANOVA ().
Three-dimensional response surface with two-dimensional contour plot analysis
Statgraphics software generated the three-dimensional response surface with two-dimensional contour plots, which visualized the effects of the process variables on the response variables: particle size (Y1), angle of repose (Y2), production yield (Y3), encapsulation efficiency (Y4), loading capacity (Y5), initial CTZ release (Y6), and the time for 85% of drug release (Y7). Mean particle size (Y1) was decreased with increasing levels of X3 and X4. The crystalline flat-shaped talc molecules might render the microsphere particle with high percentage that is a more compact matrix than with low percentage, leading to decrease in particle size of the microspheres, which is in good concordance with the previously published finding.Citation40 In contrast, the angle of repose (Y2) was decreased at higher levels of X3 and X4 as evidenced in the Pareto chart () and response surface plots (). Meanwhile, production yield (Y3), encapsulation efficiency (Y4), and loading capacity (Y5) were increased with the decrease of levels X4 from 15 mL to 5 mL and were decreased with decreasing HLB value of the emulsifier as observed in . On the other hand, both initial drug release (Y6) and the time for 85% of drug release (Y7) were significantly affected by X1 as depicted in . With the increase in levels of X1, the initial drug release and the time for 85% of drug release increased and decreased, respectively.
For instance, response surface optimization was performed to get the optimum levels of the process variables: Eudragit RLPO loading percentage in total polymer (X1), the emulsifier HLB (X2), the antitacking percentage (X3), and the dispersed phase volume (X4) and develop Cetirizine hydrochloride controlled release (CTZ-CR) microspheres with minimum particle size, highest possible encapsulation efficiency, and extended-release pattern. Upon “trading-off” various response variables, the following criteria were accepted: mean particle size <300 μm, entrapment efficiency >60%, and T85% >540 minutes.Citation41 Accordingly, formulation 13 was ranked as the best batch that achieved the maximum desirability.
Validation of optimized CTZ-CR formulation
To validate the reliability of the D-LSCD results, a new formulation was prepared according to the predicted model and evaluated for the responses as listed in . The observed values of the responses were compared with the predicted values that demonstrated no considerable residuals, and the predicted error percentage of the responses was <6%, indicating that the employed design was quite valuable for optimizing CTZ-CR microspheres.Citation42
Table 4 Optimum combination of factors, predicted values, observed values, the residuals, and the prediction error percentage for the optimized formulations of CTZ-loaded polymethacrylate microspheres
Surface morphology analysis
Scanning electron photomicrographs (SEM) of the optimized CTZ-loaded polymethacrylate microspheres were adapted at various magnification powers to display the surface morphology of microspheres (). SEM photographs exhibited spherical particles with smooth even surface, which indicated the absence of any drug crystal on the surface and confirmed the even distribution of drug in the polymeric matrix.
In vivo study and pharmacokinetics evaluation
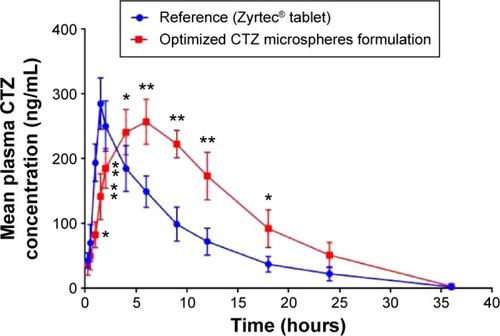
In this study, the mean plasma concentration–time profiles after the oral administration of 10 mg single dose of the optimized CTZ-loaded polymethacrylate microspheres formulation and the marketed CTZ tablets are displayed in . The relevant pharmacokinetic parameters were calculated using Kinetica version 5.0.11 software (Thermo Fisher Scientific) and listed in . The absorption from the marketed tablets was faster, reaching Cmax in 1.5 hours, whereas, the mean tmax was 6 hours following administration of the optimized formulation. The Cmax was lower following the administration of the optimized formulation of CTZ-loaded polymethacrylate microspheres (257.288 ng/mL) as compared with the marketed tablets (285.413 ng/mL). Besides that, statistical difference (P<0.05) was found between the two formulations at all time intervals of the study, which is depicted with respect to the AUC curve of the two treatments, indicating a comparable extent of absorption. Also, the absorption rate is considered as a good parameter for the assessment of extended-release formulations, which can be calculated by the division of Cmax by AUC.Citation43 Moreover, the absorption rate of CTZ from the optimized microspheres (0.0641 h−1) was slower than that obtained from the marketed tablet (0.1177 h−1), which was in good agreement with the study by El-Kamel et al.Citation44 The extended-release behavior of the microspheres was also reflected by the mean residence time, which had a higher value (11.098±0.93 hours) as compared with the marketed tablet (8.877±1.91 hours). Also, the relative bioavailability of the optimized formulation of CTZ-loaded polymethacrylate microspheres was 165.5% with respect to the marketed CTZ tablet indicating a significant enhancement of CTZ bioavailability. Thus, there is a 1.65-fold increase in the bioavailability of CTZ, with an expectation to decrease the administered dose and the frequency of administration, and subsequently minimize the adverse effects present with the administration of a large dose that maximizes patient compliance.
Table 5 Pharmacokinetic parameters of CTZ following the administration of a single oral dose (10 mg) of the marketed tablets, and the optimized formulation of CTZ microspheres equivalent to 10 mg
Figure 6 Mean plasma concentration–time profiles for CTZ after the oral administration of a single dose (10 mg) of the marketed tablet and the optimized CTZ-loaded polymethacrylate microspheres.
Abbreviation: CTZ, cetirizine hydrochloride.
Conclusion
The results of this study revealed that CTZ extended-release microspheres were prepared successfully using ESE method. Furthermore, the D-LSCD was a highly efficient tool in the optimization of the four process variables on the quality attributes of the prepared microspheres. The optimized formulation showed a mean particle size of 142.3 μm, production yield of 84.43%, encapsulation efficiency of 87.1%, sufficient initial release of 28.78%, and release of 85% of its drug content in >12 hours. Besides that, the surface morphology of microspheres was spherical with smooth surface that improves the flowability and ensures the uniformity of dosage amounts during capsule filling. In addition, the pharmacokinetic parameters of the developed formulation provide a longer period of residence time required for achieving once daily dosing and enhancing drug bioavailability relative to the marketed product that could improve patient compliance.
Acknowledgments
This work was supported by the Deanship of Scientific Research (DSR), King Abdulaziz University, Jeddah, under Grant No 166-670-D1435. Therefore, the authors gratefully acknowledge the DSR technical and financial support.
Disclosure
The authors report no conflicts of interest in this work.
References
- TayadePTKaleRDEncapsulation of water-insoluble drug by a cross-linking technique: effect of process and formulation variables on encapsulation efficiency, particle size, and in vitro dissolution rateAAPS PharmSci200461112119
- DeyNSMajumdarSRaoMEBMultiparticulate drug delivery systems for controlled releaseTrop J Pharm Res20087910671075
- KimBKHwangSJParkJBParkHJPreparation and characterization of drug-loaded polymethacrylate microspheres by an emulsion solvent evaporation methodJ Microencapsul200219681182212569029
- BeheraBSahooSDhalSBarikBBGuptaBKCharacterization of glipizide-loaded polymethacrylate microspheres prepared by an emulsion solvent evaporation methodTrop J Pharm Res200873879885
- ObeidatWPriceJViscosity of polymer solution phase and other factors controlling the dissolution of theophylline microspheres prepared by the emulsion solvent evaporation methodJ Microencapsul2003201576512519702
- SoppimathKKulkarniAAminabhaviTBhaskarCCellulose acetate microspheres prepared by o/w emulsification and solvent evaporation methodJ Microencapsul200118681181711695643
- PalmieriGGrifantiniRDi MartinoPMartelliSEmulsion/solvent evaporation as an alternative technique in pellet preparationDrug Dev Ind Pharm200026111151115811068688
- Abd El-BaryAAboelwafaAAAl SharabiIMInfluence of some formulation variables on the optimization of pH-dependent, colon-targeted, sustained-release mesalamine microspheresAAPS PharmSciTech2012131758422130789
- SongMLiNSunSTiedtLRLiebenbergWde VilliersMMEffect of viscosity and concentration of wall former, emulsifier and pore-inducer on the properties of amoxicillin microcapsules prepared by emulsion solvent evaporationFarmaco200560326126715784247
- YangCTsaySTsiangREncapsulating aspirin into a surfactant-free ethyl cellulose microsphere using non-toxic solvents by emulsion solvent-evaporation techniqueJ Microencapsul200118222323611253939
- HariharanMPriceJSolvent, emulsifier and drug concentration factors in poly(D,L-lactic acid) microspheres containing hexamethylmelamineJ Microencapsul20021919510911811763
- NilkumhangSBasitAWThe robustness and flexibility of an emulsion solvent evaporation method to prepare pH-responsive microparticlesInt J Pharm20093771–213514119515519
- MiyazakiYOnukiYYakouSTakayamaKEffect of temperature-increase rate on drug release characteristics of dextran microspheres prepared by emulsion solvent evaporation processInt J Pharm2006324214415116828994
- DouroumisDDGryczkeASchminkeSDevelopment and evaluation of cetirizine HCl taste-masked oral disintegrating tabletsAAPS PharmSciTech201112114115121181510
- MontgomeryDCDesign and Analysis of ExperimentsHoboken, NJJohn Wiley & Sons2008
- MartinABustamantePChunAHCMicromeriticsMundorffGHPhysical Pharmacy; Physical Chemical Principles in the Pharmaceutical SciencesPhiladelphia, PALippincott Williams & Wilkins1993423452
- MaitiSDeyPKaitySRaySMajiSSaBInvestigation on processing variables for the preparation of fluconazole-loaded ethyl cellulose microspheres by modified multiple emulsion techniqueAAPS Pharm-SciTech2009103703715
- PalanisamyMKhanamJCellulose-based matrix microspheres of prednisolone inclusion complex: preparation and characterizationAAPS PharmSciTech201112138840021359603
- El-SayKMEl-HelwARAhmedOAStatistical optimization of controlled release microspheres containing cetirizine hydrochloride as a model for water soluble drugsPharm Dev Technol201520673874624856961
- WagnerJGInterpretation of percent dissolved-time plots derived from in vitro testing of conventional tablets and capsulesJ Pharm Sci19695810125312575349114
- DesaiSSinghPSimonelliAHiguchiWIInvestigation of factors influencing release of solid drug dispersed in inert matrices III. Quantitative studies involving the polyethylene plastic matrixJ Pharm Sci19665511123012345969777
- HiguchiTMechanism of sustained-action medication. Theoretical analysis of rate of release of solid drugs dispersed in solid matricesJ Pharm Sci196352121145114914088963
- KorsmeyerRGurnyRDoelkerEBuriPPeppasNAMechanisms of potassium chloride release from compressed, hydrophilic, polymeric matrices: effect of entrapped airJ Pharm Sci1983151118911916644570
- RitgerPLPeppasNAA simple equation for description of solute release. II. Fickian and anomalous release from swellable devicesJ Control Release1987513742
- TanZ-ROuyangD-SZhouGSensitive bioassay for the simultaneous determination of pseudoephedrine and cetirizine in human plasma by liquid-chromatography-ion trap spectrometryJ Pharm Biomed Anal200642220721216713697
- ViswanathanNBThomasPPanditJKulkarniMGMashelkarRAPreparation of non-porous microspheres with high entrapment efficiency of proteins by a (water-in-oil)-in-oil emulsion techniqueJ Control Release199958192010021485
- DasSKYuvarajaKKhanamJNandaAFormulation development and statistical optimization of ibuprofen-loaded polymethacrylate microspheres using response surface methodologyChem Eng Res Des201596114
- MandeniusCBrundinAReview: biocatalysts and bioreactor design optimization, bioprocess methodology, using design-of-experimentsBiotechnol Progr20082411911203
- DraperNRLinDKSmall response-surface designsTechnometrics1990322187194
- MastiholimathVSDandagiPMJainSSGadadAPKulkarniARTime and pH dependent colon specific, pulsatile delivery of theophyl-line for nocturnal asthmaInt J Pharm20073281495616942847
- DinarvandRMirfattahiSAtyabiFPreparation, characterization and in vitro drug release of isosorbide dinitrate microspheresJ Microencapsul2002191738111811761
- DandagiPMMastiholimathVSGadadAPKulkarniARKonnurKpH-sensitive mebeverine microspheres for colon deliveryIndian J Pharm Sci200971446446820502560
- HaznedarSDortuncBPreparation and in vitro evaluation of Eudragit microspheres containing acetazolamideInt J Pharm2004269113114014698584
- PanditSSHaseDPBankarMMPatilATGaikwadNJKetoprofen-loaded Eudragit RSPO microspheres: an influence of sodium carbonate on in vitro drug release and surface topologyJ Microencapsul200926319520118608805
- DasSKDasNGPreparation and in vitro dissolution profile of dual polymer (Eudragit RS100 and RL100) microparticles of diltiazem hydrochlorideJ Microencapsul19981544454529651866
- PerumalDDangorCMAlcockRHurbansNMoopanarKREffect of formulation variables on in vitro drug release and micromeritic properties of modified release ibuprofen microspheresJ Microencapsul199916447548710420332
- LewisLBoniRAdeyeyeCMEffect of emulsifier blend on the characteristics of sustained release diclofenac microspheresJ Microencapsul19981532832989608393
- ShatoHMiyagawaYOkabeTMiyajimaMSunadaHDissolution mechanism of diclofenac sodium from wax matrix granulesJ Pharm Sci1997869299349269871
- MahajanHSTatiyaBVNerkarPPOndansetron loaded pectin based microspheres for nasal administration: in vitro and in vivo studiesPowder Technol2012221168176
- IslamSJalilREffects of release modifier and annealing on polyvinyl acetate-polyvinyl pyrrolidone microspheres containing diclofenac sodiumDhaka Univ J Pharm Sci20131214150
- DeySPramanikSMalgopeAFormulation and optimization of sustained release stavudine microspheres using response surface methodologyISRN Pharm2011201117
- MujtabaAAliMKohliKStatistical optimization and characterization of pH-independent extended-release drug delivery of cefpodoxime proxetil using Box–Behnken designChem Eng Res Des2014921156165
- GibaldiMCompartmental and noncompartmental pharmacokineticsBiopharmaceutices and Clinical Pharmacokinetics4th edPhiladelphia, PALea & Febiger19911423
- El-KamelAHAl-GoharyOMNHosnyEAAlginate-diltiazem hydrochloride beads: optimization of formulation factors, in vitro and in vivo availabilityJ Microencapsul200320221122512554376