
Abstract
Background
The intestinal cytochrome P450 3A (CYP 3A) and P-glycoprotein (P-gp) present a barrier to the oral absorption of saquinavir (SQV). Resveratrol (RESV) has been indicated to have modulatory effects on P-gp and CYP 3A. Therefore, this study was to investigate the effects of RESV on P-gp and CYP 3A activities in vitro and in vivo on oral SQV pharmacokinetics in rats.
Methods
In vitro, intestinal microsomes were used to evaluate RESV effect on CYP 3A-mediated metabolism of SQV; MDR1-expressing Madin–Darby canine kidney (MDCKII-MDR1) cells were employed to assess the impact of RESV on P-gp-mediated efflux of SQV. In vivo effects were studied using 10 rats randomly assigned to receive oral SQV (30 mg/kg) with or without RESV (20 mg/kg). Serial blood samples were obtained over the following 24 h. Concentrations of SQV in samples were ascertained using high-performance liquid chromatography-tandem mass spectrometry analysis.
Results
RESV (1–100 μM) enhanced residual SQV (% of control) in a dose-dependent manner after incubation with intestinal microsomes. RESV (1–100 μM) reduced the accumulation of SQV in MDCKII-MDR1 cells in a concentration-dependent manner. A double peaking phenomenon was observed in the plasma SQV profiles in rats. The first peak of plasma SQV concentration was increased, but the second peak was reduced by coadministration with RESV. The mean AUC0–∞ of SQV was slightly decreased, with no statistical significance probably due to the high individual variation.
Conclusion
RESV can alter the plasma SQV concentration profiles, shorten the Tmax of SQV. RESV might also cause a slight decrease tendency in the SQV bioavailability in rats.
Introduction
The standard treatment for the human immunodeficiency virus (HIV)/acquired immunodeficiency disease recommended by the World Health Organization includes at least three drugs in combination: two nucleoside reverse transcriptase inhibitors and one protease inhibitor (PI) or non-nucleoside reverse transcriptase inhibitor. This treatment is commonly termed highly active antiretroviral therapy.Citation1 Saquinavir (SQV), as with other PIs, exerts its pharmacological activities by binding to the active site of viral protease enzyme, leading to the formation of immature virus particles. Although SQV is highly effective in blocking HIV-1 infection, SQV efficacy in clinical practice is limited, mainly due to its low and highly variable oral bioavailability, which is ~4% with a coefficient of variation (CV) >100%.Citation2,Citation3 Multiple factors contribute to the low oral bioavailability of SQV, including poor solubility characteristics, extensive first pass metabolism and P-glycoprotein (P-gp) transport. After oral administration, SQV is extensively metabolized before systemic absorption by cytochrome P450 3A (CYP 3A) in the small intestine.Citation4 In addition, SQV is a substrate for P-glycoprotein (P-gp) transporters with high affinity.Citation5 The P-gp on intestine epithelia actively extrudes SQV from enterocytes back into the intestinal lumen, leading to a significant reduction in systematic plasma drug levels.Citation5 Thus, coadministration of SQV with drug or diet that may inhibit or induce CYP 3A or/and P-gp activities should be viewed with caution.
Resveratrol (RESV) is a kind of stilbenes mainly found in red grapes, berries, and peanuts.Citation6 RESV and its potential health benefits have attracted increasing interest since red wine consumption was found to be associated with low incidence of cardiovascular disease in the French despite a high-fat diet, which is popularly known as the “French paradox” phenomenon.Citation7,Citation8 During the past few years, RESV has been reported to exert various beneficial pharmacological effects, such as anti-inflammatory,Citation9 anti-atherogenic,Citation10 and anticarcinogenicCitation11 activities. In addition, RESV exhibits anti-HIV-1 activity.Citation12 Recent results suggest a synergistic inhibition of HIV-1 by the combination of RESV and decitabine.Citation13
Given its multiple beneficial pharmacological effects, introducing RESV as a supplemental agent into HIV-1 therapy seems reasonable. However, RESV has been indicated to modulate P-gp and CYP 3A activities,Citation14,Citation15 suggesting it may alter the pharmacokinetics (PK) or bioavailability of concomitant drugs that are P-gp or/and CYP 3A substrates, such as SQV. Whether, and to what extent, RESV influences intestinal P-gp-mediated efflux or CYP 3A-mediated metabolism of SQV remains unclear. To our knowledge, no data are available concerning the impacts of RESV on the PK of SQV. Therefore, we conducted this study to investigate the effects of RESV on P-gp and CYP 3A activities and its impacts on the PK of SQV in rats.
Materials and methods
Chemicals and reagents
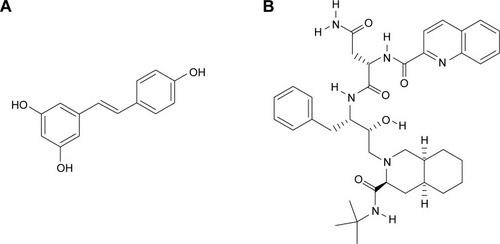
RESV (purity >98%) was purchased from FeiYu Biotechnology Corporation (Nantong, People’s Republic of China). SQV was purchased from USP (Rockville, MD, USA). Chemical structures of RESV and SQV are shown in . Pooled Sprague-Dawley rat (male) intestine microsomes were obtained from Xenotech LLC (Kansas City, KS, USA). Verapamil (VER) fluid injection (50 mL/branch) was obtained from HeFeng Pharmaceutical Co. Ltd (Shanghai, People’s Republic of China). BCA Protein Assay Kit was purchased from Solarbio (Beijing, People’s Republic of China). Ketoconazole (KET) (purity >99%) was purchased from the National Institutes for Food and Drug Control (Beijing, People’s Republic of China). Dulbecco’s Modified Eagle’s Medium was from Gibco (Shanghai, People’s Republic of China). Phosphate-buffered saline (PBS) and other reagents or solvents used were commercially available and of reagent grade.
Figure 1 Chemical structures of resveratrol (A) and saquinavir (B).
Animals
Male Sprague-Dawley rats were purchased from the Academy of Military Medical Sciences (Beijing, People’s Republic of China). Rats were housed in well-ventilated cages at room temperature (24°C±2°C) and 40%–60% relative humidity. Rats were kept on a 12 h night cycle (lights on from 6 am to 6 pm). The animals were housed with free access to laboratory food and water ad libitum. Rats weighing 300–350 g (8–9 weeks old) were used in the PK study.
In vitro metabolism experiment
An in vitro experiment was conducted to assess the effect of RESV on intestinal CYP 3A-mediated metabolism of SQV. The procedures used are similar to previously reported methods.Citation16,Citation17 All incubations were performed in triplicate in 100 μL of 100 mM PBS (pH 7.4) containing 1 mM nicotinamide adenine dinucleotide phosphate, 0.8 mg/mL intestinal microsomal protein and modulator (10 μM KET, or 1, 10, or 100 μM RESV). The microsomes (replaced with equal volume of buffer in the control group) and KET or RESV were mixed and incubated at 37°C for 5 min. Nicotinamide adenine dinucleotide phosphate was then added to initiate the reaction, and the mixture further incubated at 37°C for 15 min. The reaction was terminated by the addition of 100 μL ice-cold acetonitrile. Residual SQV was measured with the high-performance liquid chromatography tandem mass spectrometry (HPLC-MS/MS) analysis method described in the drug assay section below.
In vitro cell accumulation experiment
Cell accumulation experiment to assess the effect of RESV on P-gp mediated efflux of SQV. MDR1-expressing Madin–Darby canine kidney (MDCKII-MDR1) cells were kindly provided by Prof Su Zeng. MDCKII-MDR1 cells were cultured in Dulbecco’s Modified Eagle’s culture Medium supplemented with 10% fetal bovine serum (Gibco, USA), 100 units/mL penicillin, and 100 mg/mL streptomycin. Cells were incubated at 37°C and 5% CO2 atmosphere.
MDCKII-MDR1 cells were incubated with 50 μM SQV in the absence or presence of various concentrations (1, 10, 33, and 100 μM) of RESV, the vehicle (0.5% dimethylsul-foxide), or the positive control (50 μM VER) at 37°C for 4 h. Cell viability was assessed through a 3-(4,5-dimethyl-2-thiazolyl)-2,5-diphenyl-2H-tetrazolium bromide assay.Citation18 Results showed that agents at concentrations adopted in this study did not exert significant damage on MDCKII-MDR1 cell variability. After 4 h incubation, cells were washed with cold PBS, suspended in 1 mL distilled water, and then collected into a tube. Cells in each tube were broken using an ultrasonic cell disruption system at 0°C, and centrifuged (13,400× g for 5 min at 4°C). The supernatant fraction was then transferred into a tube and frozen at -20°C until analysis. The amount of protein in cells was measured using a BCA Protein Assay Kit (Solarbio). The intracellular accumulation of SQV was quantified as the concentration ratio (μg/mg protein), which was calculated by dividing the apparent uptake amount of SQV by protein content.
In vivo PK experiment
An in vivo experiment was conducted to assess the effects of RESV on SQV PK profiles in rats. The study protocol was approved, and adhered to the guidelines of the Animal Ethics Committee of Beijing Children’s Hospital. We designed the PK study based on previously reported SQV in vivo studies.Citation19,Citation20 Rats were fasted for 12 h prior to experiments with free access to water. They were then randomized into two groups: a control group (SQV 30 mg/kg, oral, aqueous suspension) and a RESV treatment group (SQV 30 mg/kg plus RESV 20 mg/kg, oral, aqueous suspension). SQV was suspended in solvent (20% ethanol, 30% propylene glycol, and 50% saline) at a concentration of 6 mg/mL; RESV was suspended in saline with 30% polyethylene glycol 400 at 20 mg/mL concentration. Each conscious animal was orally administrated an appropriate volume of suspension (30 mg/kg SQV or 30 mg/kg SQV +20 mg/kg RESV). Blood samples were taken from the posterior orbital venous plexus into heparinized Eppendorf tubes at 0, 0.25, 0.5, 1, 2, 4, 8, 12, and 24 h after drug administration. Rats were given food 4 h after blood samples were obtained. Blood samples were immediately centrifuged and the obtained plasma samples were stored at −20°C until the time for LC-MS/MS analysis.
Drug assay
We used a validated HPLC-MS/MS analysis methodCitation21 to measure the concentrations of SQV in samples from the metabolism study, cell accumulation study, and PK study. Briefly, ritonavir was selected as the internal standard. The internal standard (200 μL, 20 ng/mL) was first added into the 20 μL buffer sample or 50 μL plasma sample prior to further extraction with 3 mL methyl tert-butyl ether. The upper layer (2.8 mL) was carefully transferred into another clean tube and then evaporated to dryness at 40°C under a gentle stream of nitrogen. The dry residue was reconstituted with 200 μL mobile phase (CH3CN/H2O, 76.65:23.35 [v/v], containing 0.2 mM NH4COOH). After vortex mixing, the extracted samples were centrifuged (13,400× g for 5 min at 4°C) and the supernatant (10 μL) was injected into the HPLC/MS-MS system.
The HPLC/MS-MS analysis was carried out on a Restek C18 (150×2.1 mm ID) column (Bellefonte, PA, USA) with the mobile phase at a flow rate of 300 μL per minute. SQV (retention time, 3.63 min) and ritonavir (retention time, 2.67 min) were analyzed by fragmentation of the parent compound and quantification of resulting fragments. The monitoring ions of SQV and ritonavir were m/z 671.4/570.4 and m/z 721.4/296.2, respectively. The lower limit of quantification of SQV was 1 ng/mL in extracted samples. The precision and accuracy of the quality control samples at three concentration levels (low, middle, and high: 3, 50, and 150 ng/mL, respectively) were within 15% relative standard deviation and 15% relative error, respectively.
PK analysis
The PK parameters of SQV in plasma were determined by noncompartmental method using WinNonlin version 6.4 (Pharsight Corporation, Mountain View, CA, USA). The area under the plasma concentration–time curves (AUC) from time 0 to 24 h (AUC0–t) was determined using the linear trapezoidal rule. The terminal elimination half-life (t1/2) was calculated as ln2/λz using the slope (λz) from a linear regression analysis of the terminal phase of the plasma concentration–time curve on a semilog scale. The AUC from time zero to infinity (AUC0–∞) was calculated using the linear trapezoidal rule, formulated as AUC0–∞ = AUC0–t + Ct/λz, where Ct was the last measured concentration in plasma. The apparent systemic clearance (CL/F) was calculated as: CL/F = dose/AUC0–∞.
Statistical analysis
The data for analysis of variance and Student’s t-test were normally distributed as assessed by Shapiro–Wilk test. One-way analysis of variance with Duncan’s multiple range test was used for statistical comparisons for the in vitro studies. For the in vivo study, AUC0–∞, Cmax, t1/2, CL/F, and MRT0–∞ were transformed into a logarithmic form and analyzed with independent-samples Student’s t-test; the time to Cmax, Tmax, was analyzed with Wilcoxon rank sum test. Statistical analyses were done with IBM SPSS Statistics for Windows, version 20.0 (IBM Corp, Armonk, NY, USA). A P-value of <0.05 was considered significant.
Results
RESV inhibits intestinal CYP 3A-mediated metabolism of SQV
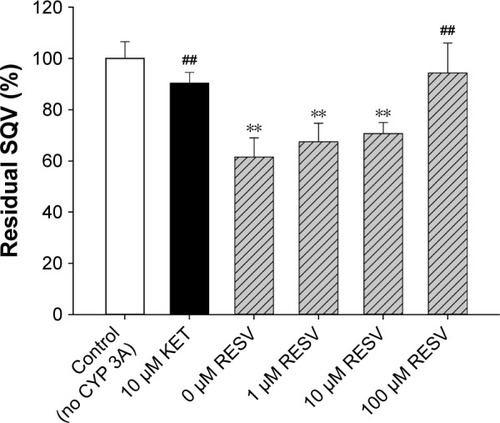
The effects of RESV at various concentrations on the residual SQV presence after 15 min of metabolism are shown in . The residual SQV in 0 μM RESV group (61.5% of control) was significantly lower than those in control (without CYP 3A) and KET (CYP 3A inhibitor) group (P<0.01). Residual SQV increased with RESV in a dose-dependent manner, with 67.5%, 70.7%, and 94.3% of control in the presence of 1, 10, and 100 μM RESV, respectively, suggesting a concentration-dependent inhibitory effect on intestinal CYP 3A-mediated SQV metabolism.
Figure 2 Effect of RESV on the intestinal CYP 3A mediated metabolism of SQV.
Abbreviations: ANOVA, analysis of variance; CYP 3A, cytochrome P450 3A; RESV, resveratrol; SD, standard deviation; SQV, saquinavir; KET, ketoconazole.
RESV stimulates P-gp mediated efflux of SQV
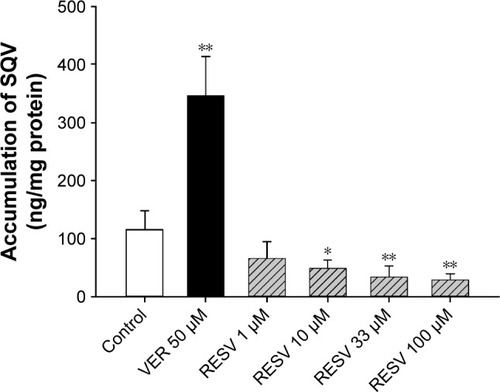
The effects of RESV at various concentrations on accumulations of SQV in MDCKII-MDR1 cells are shown in . The treatment of 50 μM VER, a P-gp inhibitor served as a positive control; intracellular accumulation of SQV increased by nearly 200%, implying the experiment provides a reliable in vitro model for assessing P-gp regulatory effects. Significant decreases of SQV intracellular concentration were observed in the presence of 10 (P<0.05), 33 (P<0.01), and 100 μM RESV (P<0.01), a percent change with RESV dose of −58.1%, −71.2%, and −75.5%, respectively. This finding indicates that RESV stimulates P-gp-mediated efflux of SQV in a concentration-dependent manner.
Figure 3 Effect of RESV on the accumulation of SQV in MDCKII-MDR1 cells.
Abbreviations: ANOVA, analysis of variance; MDCK, Madin–Darby canine kidney; RESV, resveratrol; SD, standard deviation; SQV, saquinavir; VER, verapamil.
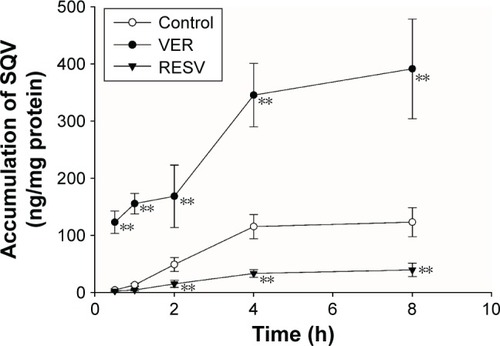
The time profiles of the intracellular accumulation of SQV in the presence of RESV (33 μM) or VER (50 μM) are illustrated in . The accumulation time profile of SQV reached steady state at 4 h after initiation of incubation. Compared with controls, intracellular concentrations of SQV decreased (P<0.01) in RESV treatments continuously after 2 h co-incubation, indicating a time-dependent stimulatory effect on the P-gp-mediated efflux of SQV.
Figure 4 Effect of RESV on the accumulation of SQV in MDCKII-MDR1 cells.
Abbreviations: ANOVA, analysis of variance; MDCK, Madin–darby canine kidney; RESV, resveratrol; SD, standard deviation; SQV, saquinavir; VER, verapamil.
RESV alters SQV PK profiles in rats
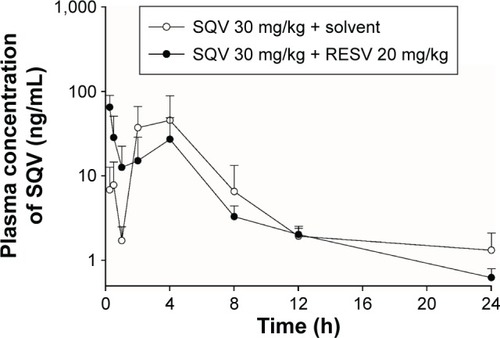
In vivo plasma concentration–time profiles of SQV in rats after receiving a single oral dose of SQV (30 mg/kg), with or without RESV (20 mg/kg), are shown in . Wide interindividual variability was observed. In addition, a double peak phenomenon was observed, with the first peak in plasma levels reached at ~0.5 (control group) or 0.25 h (RESV treatment group), and the second peak at ~4 h (both groups). The profile of plasma SQV concentrations was significantly affected by coadministration of RESV. The first peak in the plasma drug profile in RESV treatment group was significantly higher than that in the control group, while the second one was significantly lower. The SQV plasma concentration curve declined more rapidly in the presence of RESV. (Composite curves graphed plasma SQV profiles for the control and treatment groups were displayed in Supplementary materials.)
Figure 5 Plasma concentration–time curves of SQV.
Abbreviations: RESV, resveratrol; SD, standard deviation; SQV, saquinavir.
The PK parameters of SQV are summarized in . Oral coadministration of RESV (20 mg/kg) decreased mean AUC0–∞ of SQV by ~31%, but this change had no statistical significance (P>0.05). The mean CL/F of SQV was increased by ~51% with no statistical significance (P>0.05). The Tmax of SQV was significantly shortened (from ~4 h to ~0.25 h, P<0.01) by coadministration with RESV, but Cmax was not significantly affected (P>0.05).
Table 1 Pharmacokinetic parameters of SQV after an oral dose of 30 mg/kg with or without oral coadministration of RESV 20 mg/kg
Discussion
This study includes both in vitro and in vivo experiments to explore the interaction between RESV and SQV. In vitro, RESV inhibited metabolism of SQV by rat intestinal CYP 3A, which is fairly consistent with the findings of previous studies.Citation14,Citation15,Citation22,Citation23 On the other hand, RESV showed stimulatory effects on the P-gp-mediated efflux of SQV. In vivo, RESV led to a greater peak in plasma SQV in the first hour after dosing, but a decreased level of SQV relative to the control after 2 h.
In order to investigate the impact of RESV on intestinal P-gp-mediated efflux, another major barrier for SQV absorption, we evaluated the accumulation of SQV in MDCKII-MDR1 cells in the presence or absence of RESV. MDCKII-MDR1 cells are MDCK cells transfected with the human MDR1 gene; they express P-gp but do not express other efflux transporters, such as BCRP and MRP2.Citation24 MDCKII-MDR1 cells are commonly employed as an in vitro model for intestinal epithelium.Citation25–Citation27 Results in the accumulation study suggest that RESV stimulates the P-gp-mediated efflux of SQV.
Findings of the effect of RESV on P-gp from previous studies are controversial. For example, Choi et al found that RESV significantly reduced rhodamine123 efflux via P-gp in MCF-7/ADR cells that overexpress P-gp, and significantly increased the drug exposure of orally administered nicardipine in rats.Citation28 In contrast, Yang et al reported that RESV exerted a stimulatory effect on P-gp, resulting in a reduction of cyclosporine oral bioavailability in rats.Citation15 These findings suggest that RESV exerts stimulatory/inhibitory effects on P-gp depending on the substrate. It seems likely that the substrate-dependent modulation results from complicated interactions between substrates involving P-gp substrate binding sites. The binding sites for any particular P-gp substrate may be the same or distinct from those for another substrate.Citation24,Citation29–Citation32 This may lead to competition between substrates that bind identical sites or to a positive cooperative effect between substrates that bind different sites.Citation32,Citation33 In this case, the latter could explain the stimulation of RESV on P-gp-mediated efflux of SQV.
In the PK study, rats were used as the animal model mainly due to the similarity in basic intestinal structures and physiology of rats and humans.Citation34 We observed a high interindividual variability in the SQV plasma concentration–time profiles, which is generally consistent with previous PK studies in rats.Citation35,Citation36 Moreover, we noticed a double peak phenomenon in plasma SQV profiles in the presence and absence of RESV. Similar double peaking phenomena were also documented in multiple SQV PK studies involving ratsCitation35,Citation37,Citation38 and humans.Citation39–Citation41 Several physiological mechanisms can generate the double peaking phenomenon, including enterohepatic recycling, gastric emptying, small intestinal transit, and site-specific absorption.Citation42 However, since no double peak has been observed after intravenous dosing of SQV,Citation35,Citation39,Citation40 the second peak cannot be explained by enterohepatic recycling. Similarly, because the increase phase of SQV plasma profiles started earlier than food intake, it seems unlikely that gastric emptying plays an important role. Here, we speculate that the double peak phenomenon mainly results from site-specific intestinal absorption. SQV is one of the class II compounds categorized in Biopharmaceutics Classification System, with low solubility and high permeability.Citation43 This property suggests that dissolution is a rate-limiting step for the oral absorption of SQV. Thus, the second peak in the SQV plasma profiles can be due to the increase of SQV dissolution in the more acidic environment of the colon compared with ileum.Citation44 In addition, the regional differences in P-gp expression and activity along the intestine may play a significant role in causing the double peak.Citation45 P-gp levels increase progressively from proximal to distal region in human or rodent small intestine.Citation43,Citation46 The ileum region shows significantly higher P-gp function than in other region.Citation43 Therefore, we infer that after oral administration, SQV was absorbed rapidly in the proximal small intestine, and then it was transported back into the intestine lumen by P-gp at the ileum, resulting in a rapid rise of plasma SQV levels initially, followed by a decrease. After that, absorption increased again at the colon where P-gp expression is lower, leading to a second peak in the plasma SQV levels.
Overall, the mean AUC0–∞ of SQV was decreased by nearly 30% by coadministration with RESV, but this change had no statistical significance, which might be partially due to the high variation between individuals. The impact of RESV on SQV PK profiles can be attributed to the effects of RESV on intestinal CYP 3A and P-gp. The distribution of CYP 3A in the small intestine of rats is markedly different from that of P-gp. CYP 3A is one of the two most abundant P450 isoforms (the other one is CYP 2B1) in the duodenum and jejunum of rat intestines but it is not present in either the ileum or the colon.Citation47 It is most likely that RESV inhibits the CYP 3A mediated metabolism of SQV, leading to an increase of SQV absorption in the proximal intestine. In contrast, RESV reduces the absorption of SQV in distal intestine (ileum and colon) by stimulating P-gp-mediated efflux of SQV. Overall, the positive effect of RESV on the absorption of SQV in the proximal intestine is offset by its negative effect in the distal intestine, eventually resulting in a nonsignificant change in the SQV oral bioavailability.
Conclusion
This study demonstrates that RESV can inhibit intestinal CYP 3A-mediated SQV metabolism and stimulate P-gp-mediated efflux of SQV. RESV can alter the SQV plasma concentration profiles and shorten the Tmax of SQV. RESV also leads to a decrease tendency in the SQV oral bioavailability, but this change has no statistical significance probably because of the high individual variation. Further clinical investigations are required to assess the benefit and risk of the concomitant use of SQV with RESV.
Acknowledgments
We gratefully acknowledge the assistance of Prof Su Zeng and Dr Xi Chen.
This study was funded by a grant from the National Natural Science Foundation of China (No 81102877).
Disclosure
The authors report no conflicts of interest in this work.
References
- WHOConsolidation Guidelines on the Use of Antiretroviral Drugs for Treating and Preventing HIV InfectionGeneva, SwitzerlandWorld Health Organization2013
- KitchenVSSkinnerCAriyoshiKSafety and activity of saquinavir in HIV infectionLancet199534589559529557715294
- NobleSFauldsDSaquinavir. A review of its pharmacology and clinical potential in the management of HIV infectionDrugs1996521931128799687
- FitzsimmonsMECollinsJMSelective biotransformation of the human immunodeficiency virus protease inhibitor saquinavir by human small-intestinal cytochrome P4503A4 potential contribution to high first-pass metabolismDrug Metab Dispos19972522562669029057
- KimAEDintamanJMWaddellDSSilvermanJASaquinavir, an HIV protease inhibitor, is transported by P-glycoproteinJ Pharmacol Exp Ther19982863143914459732409
- GiovinazzoGIngrossoIParadisoADe GaraLSantinoAResveratrol biosynthesis: plant metabolic engineering for nutritional improvement of foodPlant Foods Hum Nutr201267319119922777386
- SunAYSimonyiASunGYThe “French Paradox” and beyond: neuroprotective effects of polyphenolsFree Radic Biol Med200232431431811841921
- CriquiMHRingelBLDoes diet or alcohol explain the French paradox?Lancet19943448939171917237996999
- FrémontLBiological effects of resveratrolLife Sci200066866367310680575
- FanEZhangLJiangSBaiYBeneficial effects of resveratrol on atherosclerosisJ Med Food200811461061419053850
- JangMCaiLUdeaniGOCancer chemopreventive activity of resveratrol, a natural product derived from grapesScience199727552972182208985016
- ZhangH-SZhouYWuM-RZhouH-SXuFResveratrol inhibited Tat-induced HIV-1 LTR transactivation via NAD(+)-dependent SIRT1 activityLife Sci20098513–1448448919664641
- ClouserCLChauhanJBessMAAnti-HIV-1 activity of resveratrol derivatives and synergistic inhibition of HIV-1 by the combination of resveratrol and decitabineBioorg Med Chem Lett201222216642664623010273
- ChiY-CLinS-PHouY-CA new herb–drug interaction of Polygonum cuspidatum, a resveratrol-rich nutraceutical, with carbamazepine in ratsToxicol Appl Pharmacol2012263331532222813711
- YangS-YTsaiS-YHouY-CChaoP-DLInductive modulation on P-glycoprotein and cytochrome 3A by resveratrol, a constituent of grapesFood Chem20121333683688
- ZhuangXShenGYuanMLiHInvestigation of the pharmacokinetic interaction between ritonavir and CMDCK, a new non-nucleoside reverse transcriptase inhibitorDrug Res (Stuttg)201363523724223539429
- ChoiYHLeeILeeMGEffects of cysteine on metformin pharmacokinetics in rats with protein–calorie malnutrition: partial restoration of some parameters to control levelsJ Pharm Pharmacol200860215316118237462
- VellonenKSHonkakoskiPUrttiASubstrates and inhibitors of efflux proteins interfere with the MTT assay in cells and may lead to underestimation of drug toxicityEur J Pharm Sci200423218118815451006
- KimS-AKimS-WChoiH-KHanH-KEnhanced systemic exposure of saquinavir via the concomitant use of curcumin-loaded solid dispersion in ratsEur J Pharm Sci201349580080423748001
- VyasTKShahiwalaAAmijiMMImproved oral bioavailability and brain transport of saquinavir upon administration in novel nanoemulsion formulationsInt J Pharm20083471–29310117651927
- LiangGLiNMaLEffect of quercetin on the transport of ritonavir to the central nervous system in vitro and in vivoActa Pharm20166619710726959546
- PiverBBerthouFDreanoYLucasDDifferential inhibition of human cytochrome P450 enzymes by ε-viniferin, the dimer of resveratrol: comparison with resveratrol and polyphenols from alcoholized beveragesLife Sci20037391199121312818727
- PiverBBerthouFDreanoYLucasDInhibition of CYP3A, CYP1A and CYP2E1 activities by resveratrol and other non volatile red wine componentsToxicol Lett20011251839111701226
- TaubMEPodilaLElyDAlmeidaIFunctional assessment of multiple P-glycoprotein (P-gp) probe substrates: influence of cell line and modulator concentration on P-gp activityDrug Metab Dispos200533111679168716093365
- TroutmanMDThakkerDRNovel experimental parameters to quantify the modulation of absorptive and secretory transport of compounds by P-glycoprotein in cell culture models of intestinal epitheliumPharm Res20032081210122412948019
- SoldnerABenetLZMutschlerEChristiansUActive transport of the angiotensin-II antagonist losartan and its main metabolite EXP 3174 across MDCK-MDR1 and Caco-2 cell monolayersBr J pharmacol200012961235124310725273
- LiuYZengSAdvances in the MDCK-MDR1 cell model and its applications to screen drug permeabilityYao Xue Xue Bao2008436559564 Chinese18822955
- ChoiJ-SChoiB-CKangKWEffect of resveratrol on the pharmacokinetics of oral and intravenous nicardipine in rats: possible role of P-glycoprotein inhibition by resveratrolPharmazie2009641495219216231
- ChufanEEKapoorKSimHMMultiple transport-active binding sites are available for a single substrate on human P-glycoprotein (ABCB1)PLoS One2013812e8246324349290
- PajevaIKSterzKChristliebMSteggemannKMarighettiFWieseMInteractions of the multidrug resistance modulators tariquidar and elacridar and their analogues with P-glycoproteinChemMedChem20138101701171323943604
- MartinezLArnaudOHeninEUnderstanding polyspecificity within the substrate-binding cavity of the human multidrug resistance P-glycoproteinFEBS J2014281367368224219411
- ShapiroABLingVPositively cooperative sites for drug transport by P-glycoprotein with distinct drug specificitiesEur J Biochem199725011301379432000
- ChufanEESimH-MAmbudkarSVChapter three – molecular basis of the polyspecificity of P-glycoprotein (ABCB1): recent biochemical and structural studiesJohnDSToshihisaIAdvances in Cancer ResearchAcademic Press20157196
- JainRDuvvuriSKansaraVMandavaNKMitraAKIntestinal absorption of novel-dipeptide prodrugs of saquinavir in ratsInt J Pharm2007336223324017207946
- BuchananCMBuchananNLEdgarKJPharmacokinetics of saquinavir after intravenous and oral dosing of saquinavir: hydroxybutenyl-beta-cyclodextrin formulationsBiomacromolecules20089130531318072746
- HirunpanichVMurakosoKSatoHInhibitory effect of docosahexaenoic acid (DHA) on the intestinal metabolism of midazolam: in vitro and in vivo studies in ratsInt J Pharm20083511–213314318082981
- PathakSMMusmadePDengleSKarthikABhatKUdupaNEnhanced oral absorption of saquinavir with methyl-beta-cyclodextrin – preparation and in vitro and in vivo evaluationEur J Pharm Sci201041344045120656025
- PathakSMKumarARSubramanianGUdupaNDevelopment and validation of a reversed-phase liquid chromatographic method with fluorescence detection for the study of saquinavir pharmacokinetics in rat plasmaAnal Chim Acta2007594224825617586122
- KupferschmidtHHFattingerKEHaHRFollathFKrähenbühlSGrapefruit juice enhances the bioavailability of the HIV protease inhibitor saquinavir in manBr J Clin Pharmacol19984543553599578182
- HaHRFollathFBloemhardYKrähenbühlSDetermination of saquinavir in human plasma by high-performance liquid chromatographyJ Chromatogr B Biomed Sci Appl199769424274339252059
- FröhlichMBurhenneJMartin-FacklamMOral contraception does not alter single dose saquinavir pharmacokinetics in womenBr J Clin Pharmacol200457324425214998420
- DaviesNMTakemotoJKBrocksDRYanezJAMultiple peaking phenomena in pharmacokinetic dispositionClin Pharmacokinet201049635137720481648
- MurakamiTTakanoMIntestinal efflux transporters and drug absorptionExpert Opin Drug Metab Toxicol20084792393918624680
- AgoramBWoltoszWSBolgerMBPredicting the impact of physiological and biochemical processes on oral drug bioavailabilityAdv Drug Deliv Rev200150Suppl 1S41S6711576695
- WadaSKanoTMitaSThe role of inter-segmental differences in P-glycoprotein expression and activity along the rat small intestine in causing the double-peak phenomenon of substrate plasma concentrationDrug Metab Pharmacokinet20132829810322850759
- MoulySPaineMFP-glycoprotein increases from proximal to distal regions of human small intestinePharm Res200320101595159914620513
- MitschkeDReichelAFrickerGMoenningUCharacterization of cytochrome P450 protein expression along the entire length of the intestine of male and female ratsDrug Metab Dispos20083661039104518332081