
Abstract
Background
Agarwood, as a traditional Chinese medicine, has great potential value for the treatment of tranquilization. However, its potential mechanisms and biomarkers are still unclear.
Methods
In this study, ultra-high performance liquid chromatography-quadrupole-Exactive Orbitrap mass spectrometry (UHPLC-Q-Exactive Orbitrap-MS)-based metabonomics was adopted to discover the potential biomarkers in mice after agarwood incense smoke (AIS) intervention. Furthermore, the chemical components in agarwood were identified based on UHPLC-Q-Exactive Orbitrap-MS. The global view of potential compound-target-pathway (C-T-B) network was constructed through network pharmacology to understand the potentially material basis of biomarkers.
Results
Metabolic profiling indicated that the metabolic changed significantly in mice serum after AIS intervention. A total of 18 potential biomarkers closely related to insomnia and emotional disease were identified, mainly involving in tryptophan metabolism, arginine and proline metabolism, cysteine and methionine metabolism and steroid hormone biosynthesis pathways. A total of 138 components in agarwood were identified based on UHPLC-Q-Exactive Orbitrap-MS. The results showed that mainly compounds such as flidersia type 2-(2-phenylethyl) chromones (FTPECs) and sesquiterpenes exerted good docking abilities with key target proteins, which were involved in multiple diseases including depression and hypnosis.
Conclusion
In conclusion, this study enhanced current understanding of the change of metabolic markers after AIS intervention. Meanwhile, it also confirmed the feasibility of combining metabolomics and network pharmacology to identify active components and elucidate the material basis of biomarkers and mechanisms.
Introduction
Agarwood is a resinous material mainly produced from heartwood of various Aquilaria and Gyrinops species of the family Thymelaeaceae.Citation1,Citation2 It is distributed in the areas ranging from India eastwards throughout Southeast Asia, as well as in southern China including Guangdong, Guangxi, Hainan and Fujian.Citation3 Interestingly, agarwood is hardly formed in the normal tree, while infected by fungi or naturally wounded such as wind, lightning strikes and the gnawing of ants to the tree may stimulate the accumulation of resin.Citation4 As the most highly valuable resinous wood, agarwood can be used in fragrances, incense, medicines and aromatherapy.Citation5 It also plays an important role in religious ceremonies as well as in Chinese Traditional Medicine for obvious medicinal effects as a sedative, anti-anxious, anti-restless, and anti-inflammation drug, and is popular as incense and perfume in the world market.Citation6–Citation9
Focusing on the alteration of endogenous metabolites in biosamples, metabonomics is commonly applied to discover the underlying mechanism of human diseases.Citation10 Metabolomics-based biomarkers could indicate a variety of health or the occurrence of the disease, and capable of assessing the risks of developing the disease and detecting the disease prior to the appearance of overt clinical.Citation11 In any case, validated biomarkers would provide a much needed deeper understanding on the onset of the disorder and healthy status to facilitate the development of more valid animal models that we can use to identify novel drug targets.
Phytochemical research has indicated that the 2-(2-Phenylethyl) chromone derivatives and sesquiterpenes as two predominant constituents of agarwood, are widely distributed in different varieties of agarwood.Citation12,Citation13 Some compounds showed pharmacological effects, could be candidates for future drug discovery and served as the material basis for agarwood.Citation14,Citation15 Because most metabolites and drugs interact with multiple target proteins, the methods to predict new targets with existing endogenous metabolites and small molecule compounds have high biological and pharmacological value. Network pharmacology is a new discipline that could elucidate the action of TCM through constructing the “components-targets-biomarkers” (C-T-B) network and screening out the targets of particular interest.Citation16 The integration of metabolomics and network pharmacology provide great inspiration to explore potential pharmacological activity and elucidate the possible mechanism of agarwood incense smoke (AIS) intervention by connecting active compounds, molecular targets, metabolites and potential pathways.
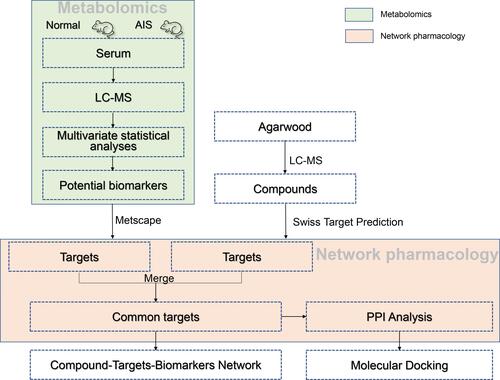
In this paper, we aim to illustrate the differential biomarkers and possible mechanism after AIS intervening in mice using metabolomics and network pharmacology analysis. Firstly, the differential metabolites characterized as AIS intervention were analyzed by serum metabolomics and multivariate analysis. Moreover, the targets for upstream regulation of differential metabolites were excavated. Secondly, the chemical constituents of agarwood were characterized and the potential targets were predicted. Thirdly, the intersection of potential compounds targets and metabolite targets were screened and merged into a C-T-B based on the metabolomics and network pharmacology. Finally, these chemical constituents from agarwood were docked with pivotal targets through molecular docking study to further interpret the effects of AIS ().
Figure 1 The overall scheme of the research processes.
Materials and Methods
Samples and Reagents
Agarwood chips (0.4±0.05 g/tablet) were purchased from Shandong Taiyue Biotechnology Co. Ltd (Lot number: H20190317). Acetonitrile and methanol (HPLC-grade) were purchased from Merck (Darmstadt, Germany). Formic acid (HPLC-grade) was obtained from Fisher Scientific (Thermo Fisher, CA, USA). Water was prepared from WAISon’s (WAISons Food and Beverage Co., Ltd., Guangzhou, China).
Animal Grouping and Agarwood Administration
Eight weeks SPF C57BL/6J male mice (18–22 g) were purchased from Beijing Weitong Lihua Laboratory Animal Technology Co., Ltd. (Beijing, China). Laboratory animal production license number: SCXK 2016-0006. All experimental procedures were performed in accordance with Guide for The Care and Use of Laboratory Animals approved by the Governing Board of the National Research Council and were approved by the Animal Ethics Committee of Shandong University of Traditional Chinese Medicine (SDUTCM20191211045). Before the experiment, all the mice were adaptively fed for a week. Mice were randomly assigned (n=12/group) to a control group and AIS group. The AIS group was administered nasal inhalation of agarwood smoke to mice for 20 min at a fixed time (9:00) every morning for 7 days, while the mice in control group were exposed to room air only. The dosage of agarwood was 3 tablets/ mouse. After one week, all the mice were anesthetized with 1.5% sodium pentobarbital, and the blood samples were collected from the inferior vena cava.
Samples Preparation
The blood samples were drawn into an Eppendorf tube and coagulated for 30 min before centrifugation. Then, the serum samples were obtained by centrifuging (1811×g, 15 min, 4 °C) and stored at −80 °C until the metabolomics assay. For serum metabolite analysis, all samples were thawed at 4 °C. Then the 100 μL of thawed serum samples were deproteinized with 400 μL acetonitrile. After centrifugation (15294×g, 20 min, 4 °C), the supernatant was transferred into 2 mL tube, dried by nitrogen and stored at −20 °C. The serum samples were resolved with the initial mobile phase prior to LC-MS analysis. For the validation the instrument stability, a pooled Quality Control (QC) sample was prepared by mixing equal volume (10 μL) of each serum sample.
After grinding into fine powders, 1 g of agarwood sample was extracted in 100 mL of methanol for 30 min in an ultrasonic-assisted manner. Then the sample was maintained at room temperature for 5 min, and the supernatant was filtered through a 0.22 μm membrane for LC-MS analysis. The incense smoke of agarwood was prepared by lighting the agarwood and collecting in glass vial. The brownish yellow oil was obtained and was dissolved in 0.5 mL MeOH, and then applied to GC/MS and LC/MS analysis, respectively. The chromatographic conditions and mass spectrometry conditions are provided in the Supplementary Materials.
UPLC-Q-Exactive Orbitrap-MS Analysis
Serum samples and agarwood sample were analyzed by a UHPLC Ultimate 3000 system equipped with a Q-Exactive Orbitrap-MS spectrometer (Thermo Fisher Scientific, CA, USA). Chromatography was performed in a Halo-C18 column (2.1 × 100 mm, 2.7 μm; AMT, USA) the mobile phases consisted of A (water containing 0.05% formic acid) and B (acetonitrile containing 0.05% formic acid). The linear gradient program of serum samples was as follows: 0–1 min, 2% B; 1–4 min, 2–20% B; 4–7 min, 20–40% B; 7–9 min, 40–70% B; 9–17 min, 70–98% B. The gradient of agarwood sample and agarwood smoke sample were as follows: 0–1 min, 5–15% B; 1–35 min, 15–55% B; 35–38 min, 55–95% B. The flow rate was 0.3 mL/min, and the injection volume was 3 µL. The column temperature was maintained at 31 °C. The mass spectrometry detections were performed as follows: capillary temperature 350 °C and spray voltage 3.5 kV for positive ion mode and negative ion mode, respectively. The mass scan range was from 80 to 1200 Da. The mass resolution was set to 70,000.
Multivariate Statistical Analyses
The acquired mass spectrometry data (.raw) were first analyzed using Compound Discoverer 2.0 (CD, Thermo Fisher, CA, USA) software, which converted mass spectrometry data into metabolite information. Based on the combination of open online databases, local databases, and MS/MS metabolites data, the potential metabolites were discovered. To visualize the metabolic differences between control and AIS group, the subsequent supervised partial least-square analysis (PLS-DA) was applied using SIMCA-P version 14.0 (Umetrics AB, Umea, Sweden). Heatmap and metabolic pathway analysis were performed with MetaboAnalyst 3.0 (http://www.metaboanalyst.ca).
Network Pharmacology Study
The differential metabolites after agarwood administration were selected as the potential biomarkers. Those biomarkers and potential targets of compounds were introduced into Metscape 3.1.3 to obtain their linked proteins.Citation17 Then, the related target proteins of potential biomarkers were imported into Metascape (http://metascape.org/) to extract rich annotations, identify statistically enriched pathways and construct protein-protein interaction networks (PPI).Citation18
Compounds identified by the LC-MS were used to predict the targets. Firstly, imported the SMILES of compounds into Swiss Target Prediction (http://www.swisstargetprediction.ch/) to identify the potential target proteins. The metabolomics and network pharmacology data were combined to obtain a system wide view. At last, compounds in agarwood, potential biomarkers directly connected to targets were merged into a C-T-B network.
Molecular Docking
The crystal structures were collected from the RCSB PDB (https://www.rcsb.org/).Citation19,Citation20 The pre-processed target receptors and ligands were processed in the way of ultra-precise molecular docking based on the grid algorithm with all functional residues retained in the grid. The structure of the ligands remained flexible to produce different conformations and the calculations were performed in OPLS force fields. Schrodinger Maestro 11.9 (https://www.schrodinger.com/) was used for all computational calculations.
Results
Metabolic Profiling Analysis and Potential Biomarkers Identification
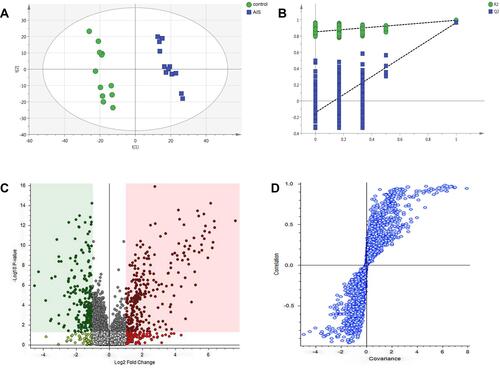
To obtain more detailed metabolic difference between the control and AIS groups, the LC-MS data of the serum were applied to multivariate data analysis. PLS-DA pattern was built to observe general clustering and trend between the two groups. It showed that the control and AIS group were effectively separated and cohesion in the same group was fine [R2Y (cumulative), 0.995; Q2 (cumulative), 0.967] (). In order to prevent model from overfitting, 100 permutation test was used to verify the stable of the model (). The metabolites with significant difference between the control and AIS groups were determined from the Volcano plot () and S-plot () as potential biomarkers.
Figure 2 (A) Score scatter plot of PLS-DA model for control (green) and AIS (blue) groups. (B) A 100 permutations test of PLS-DA model (R2=0.847; Q2=−0.133). (C) Volcano plot, and (D) S-plot.
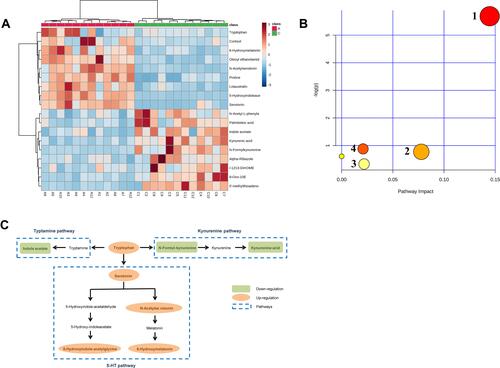
A total of 128 variables were firstly extracted out on the preprocessing of raw data from the spectra as potential biomarkers by the Compound Discoverer 2.0. Subsequently, to explore the most obvious metabolites between the study groups, metabolites with a variable importance projection (VIP) >1 were further selected as candidate metabolites. The candidate metabolites were further verified by Volcano plot () and S-plot (). Finally, the Mass Profiler Professional was used to perform t-test and select candidate metabolites at P<0.05 as biomarkers. 18 biomarkers among the 128 metabolites were screened between the two groups, and these metabolites allowed the two groups to separate well in PLS-DA. Among them, a total of 9 biomarkers were up regulated and 9 biomarkers were down regulated in the AIS group compared with control group. Detailed information describing the 18 metabolic biomarkers was shown in Table S1. To intuitively inspect the differences between the control and AIS groups, we produced a heatmap of potential biomarkers identified above (). Red represents the AIS group and green represents the control group. The warmer color (from blue to red) of the color lumps, the higher response of the representative biomarkers between two groups. As depicted in , color differences between control group and AIS group indicate the metabolites had changed significantly after AIS intervention.
Figure 3 (A) Heat map of the 18 differentially biomarkers between the control and AIS group. (B) Pathway impact analysis with MetaboAnalyst: 1 Tryptophan metabolism; 2 Arginine and proline metabolism; 3 Cysteine and methionine metabolism; 4 Steroid hormone biosynthesis. (C) Schematic diagram of the tryptophan metabolic pathway.
Analysis of Metabolic Pathways of Potential Biomarkers
Based on the 18 identified potential biomarkers, the relevant metabolic pathways were assigned using MetaboAnalyst 3.0 (http://www.metaboanalyst.ca). These results of metabolic pathway analysis were presented in the form of bubble diagrams in which each bubble represented a metabolic pathway. As shown in , there was one metabolic pathway with an impact value of 0, indicating that its contribution to the metabolic pathway was too small to be considered. On the other hand, there were 4 significant relevant metabolic pathways with the impact value>0, namely tryptophan metabolism, arginine and proline metabolism, cysteine and methionine metabolism and steroid hormone biosynthesis. Among these, the tryptophan metabolism with the highest impact value and the highest p-value, was considered as the most important metabolic pathway between control and AIS groups. The main metabolism pathways related to the biomarkers are shown in Table S1.
Characterization of the Chemical Constituents in Agarwood
In the GC-MS analysis, a total of 27 compounds were identified containing 10 sesquiterpenes and 17 2-(2-Phenylethyl) chromones (Supplementary Material, Figure S1, Table S2). 138 compounds including 100 chromones, 21 sesquiterpenes, 3 phenolics and 14 other compounds were identified by UHPLC-Q-Exactive Orbitrap-MS (Table S3, Figure S2). According to report that the chromone derivatives were further classified as four main types: tetrahydro-2-(2-phenylethyl) chromones (THPECs), flidersia type 2-(2-phenylethyl) chromones (FTPECs), epoxy-tetrahydro-2-(2-phenylethyl) chromones (EPECs) and 2-(2-phenylethyl) chromones polymers.Citation21 In this study, 26 THPECs, 45 FTPECs, 12 EPECs and 17 2-(2-phenylethyl) chromones polymers were identified. However, due to the fact that most of the compounds have the same molecular formula and similar fragment ions, some chromone isomers cannot be distinguished. It is worthwhile to note that the total ion chromatography of agarwood incense smoke was basically consistent with the agarwood sample (Figure S2). Although the retention time of chromatographic peaks is slightly different.
It is useful to further identify the chemical components in agarwood based on the MS/MS spectrum and the cracking rule. According to reports, the most 2-(2-phenylethyl) chromones in agarwood have been substituted by methoxy and hydroxyl groups, causing the neutral loss of 18 Da (-H2O),15 Da (-CH3) and 31 Da (-OCH3).Citation22 The characteristic fragmentation behavior of the 2-(2-phenylethyl) chromones was the cleavage of the CH2-CH2 bond between chromone moiety and phenyl moiety, forming the diagnose fragments of 6A+ and 6B+. The compound 2 had the molecular formula C17H18O7, and showed two fragment ions at m/z 193.0489 (6A+) and 107.0492 (6B+), which resulted from the breaking of CH2-CH2 bond. Besides, THPECs were also characterized as the successive neutral losses of two H2O and two CO molecules. Similar to the above cleavage feature, the compound 2 displayed the fragment ions at m/z 317.1008, 299.0903, 271.0955 and 243.1010, in accordance with the successive neutral losses of two H2O (m/z 299.0903) and two CO molecules (m/z 243.1010). Thence the compound 2 was tentatively annotated as aquilarone F belonging to the THPEC ().Citation22 The compounds of 108, 119 and 123 showed similar molecular ions at m/z 311 and the same molecular formula C19H18O4. However, the fragment ions among the three compounds were different due to the different positions of -OCH3. As for the compounds of 108 and 119, the fragment ions at m/z 220.0721 (6A+) and 91.0543 (6B+), corresponding to chromone ion (C10H7O2+2 OCH3) and benzyl ion (C7H7), were tentatively identified as 2-(2-phenylethyl) chromones (). Additionally, 2-(2-phenylethyl) chromones could also undergo RDA cracking, producing fragments 1,3A+ and 1,3B+, except for THPECs. Similarly, the 1,3A+ fragment ions at m/z 181.0490 (compound 108) and 151.0390 (compound 119) attributed to the RDA cracking were observed. Although it is not impossible to distinguish the isomers, it could be preliminarily inferred that two -OCH3 molecules were substituted at the A ring of compounds 108 and 119, while compound 123 had only one -OCH3 molecule at the A ring based on the fragment ions at m/z 181.0490 and 151.0390. The compound 108 and 119 were tentatively characterized as 6,7-dimethoxy-2-(2-phenylethyl) chromone or isomer (FTPEC), and the compound 123 was tentatively assigned as 6-methoxy-2-[2-(3-methoxyphenyl)ethyl]chromone or isomer (FTPEC).Citation23
Figure 4 The MS/MS spectra and the proposed fragmentation routes of representative compounds. (A) tetrahydro-2-(2-phenylethyl) chromones, (B) flidersia-2-(2-phenylethyl) chromones, (C) phenolic, and (D) sesquiterpene.
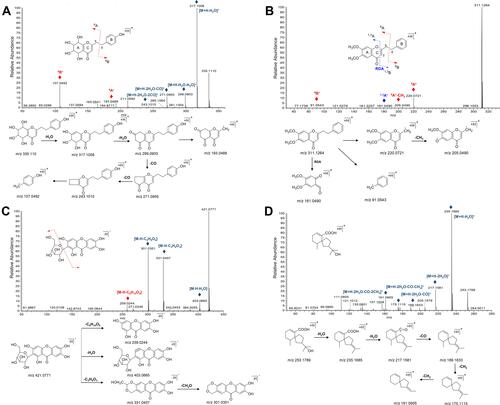
According to the negative MS/MS spectrum, the phenolic compound (compound 3) was characterized as the neutral losses of -Glc (C6H10O5) based on the fragment ion at m/z 259.0244. The fragment ion at m/z 403.0665 resulted from the neutral losses of H2O molecule. Moreover, the neutral loss of C3H6O3 (m/z 331.0457) could aid to characterize the phenolic compound, which was consisted with the fragmentation characteristics of the flavone. The compound 3 was assigned to the Mangiferin ().Citation24
Besides, the cleavage of sesquiterpene (compound 20) was characterized by the successive neutral losses of H2O and CH2 molecules. The MS/MS spectrum with the fragment ions at m/z 235.1685, 217.1581, 189.1633, 175.1115 and 161.0955 corresponded to the successive neutral losses of two H2O molecules [M+H-2H2O]+ (m/z 217.1581), a CO molecule [M+H-2H2O-CO]+ (m/z 189.1633), and then two CH2 molecules [M+H-2H2O-CO-2CH2]+ (m/z 161.0955). The compound 20 was tentatively characterized as baimuxifuranic acid ().Citation25
Targets Analysis Related to Potential Biomarkers and Compounds
After removing the isomers, 59 compounds were used for targets prediction. There were 4039 relationships of “compound-target” with probability>0 (Table S4). By means of metabonomics and Metscape 3.1.3, 224 targets can be linked to 9 of the 18 biomarkers (Table S5). Potential biomarkers and potential targets of compounds were imported into Metscape 3.1.3 to obtain the related protein targets.
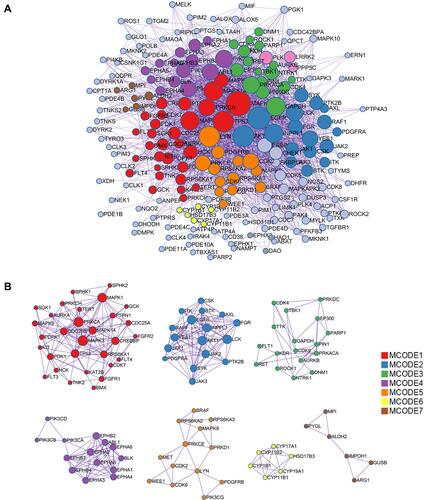
Protein-Protein Interaction (PPI) Network Construction
From the systematic perspective, PPI networks were fundamental to predict the multifactor functioning of diverse proteins in complex indication. With MCODE applied for module analysis, all nodes were classified and colored according to their function (MCODE-1~MCODE-7). The PPI network for targets is demonstrated in . The MCODE networks identified for individual target lists have been gathered and shown in . Their functional labels were generated based on the functional enriched terms. These processes included MAPK signaling pathway (MCODE-1), peptidyl-tyrosine modification (MCODE-2), peptidyl-tyrosine phosphorylation (MCODE-3), transmembrane receptor protein tyrosine kinase signaling pathway (MCODE-4), peptidyl-serine phosphorylation (MCODE-5), Steroid hormone biosynthesis (MCODE-6) and carbohydrate metabolic process (MCODE-7). The core targets of PPI network were AKT1, GAPDH, MAPK3, TP53 and EGFR. Those processes and core targets were mainly related to insomnia and depression.
Figure 5 PPI network for AIS. (A) General view of the interactions of proteins and clustered proteins. (B) MCODE networks divided by functions.
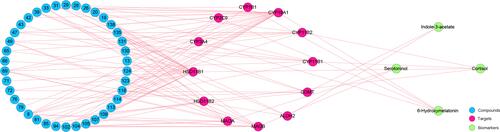
C-T-B Network Construction
The C-T-B network had 54 nodes, including 38 compound nodes, 12 target nodes and 4 biomarkers nodes (). The 12 targets were directly regulated by the 38 compounds of agarwood, including chromones especially FTPECs type chromones and sesquiterpenes. In addition, 4 potential biomarkers were directly controlled by targets.
Figure 6 The C-T-B network of agarwood. The number of the compounds is consistent with that in Table S3.
Docking Results
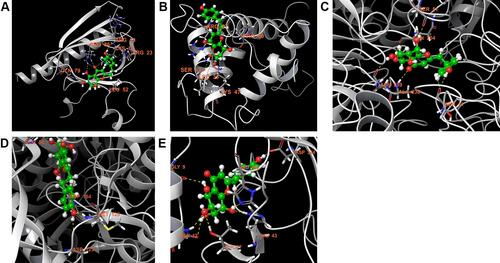
Studies of molecular docking were executed to determine the coupling attraction and association within inhibitors and the target protein (Urease) utilizing Glide programming. Glide was a docking programming accessible for ligand-protein restricting studies. The five core targets of PPI were selected for molecular docking study. The PDB ID of each target was retrieved from the RCSB PDB database. From the results, we can see that most of the compounds had certain activity.
Many of the natural ligands in agarwood demonstrated interactions like hydrogen bond, hydrophobic, electrostatic, ionic, and π- π stacking in the catalytic pocket of receptors with the various amino acid residues. We found that aquilarone F has a good docking score with all the core target proteins. Binding studies of aquilarone F within the active pocket showing their major interactions with the surrounding amino acid residues are discussed here: Docking score between aquilarone F and AKT1, GAPDH, MAPK3, TP53 and EGFR were −4.600, −9.204, −7.966, −4.551 and −6.769. Aquilarone F formed hydrogen bond interaction with LYS14, ARG15, LEU52, GLN79 and ARG86 of AKT1, and formed Pi-cation with ARG-23 ().
Figure 7 Stereoview of substrate/inhibitor binding of aquilarone F and (A) AKT1, (B) TP53, (C) GAPDH, (D) MAPK3, and (E) EGFR.
Discussion
Being a highly valuable non-timber product, agarwood is used for incenses, perfumes, traditional medicines, and other products in the world market.Citation8,Citation26 Metabolomics, used for the profiling of endogenous metabolic changes in the biological system, is a comprehensive and systematic technique.Citation27 Network pharmacology analysis could reveal the endogenous metabolites and clarify the potential complicated relationship between multiple metabolites and multiple targets. Therefore, we studied the biomarkers and investigated possible mechanism after AIS intervening by metabolomics combined with network pharmacology analysis in this study.
To explore potential biomarkers and explain possible mechanism of AIS intervention on mice, the changes of serum metabolites in control and AIS groups were monitored using untargeted metabolomic and multivariate data methods. In total 18 biomarkers were determined including lotaustralin, proline, serotonin (5-HT), 6-hydroxymelatonin, N-Formylkynurenine, tryptophan, 5-hydroxyindoleacetylglycine, 5’-methylthioaden osine (MTA), kynurenic acid, N-Acetylserotonin (NAS), alpha-Ribazole, indole-3-acetate, N-Acetyl-L-phenylalanine, cortisol, 9-OxoODE, palmitol eic acid, (±)12(13)-DiHOME, oleoyl ethanolamide. These above differential biomarkers identification results were mainly related to tryptophan metabolism, arginine and proline metabolism, cysteine and methionine metabolism, and steroid hormone biosynthesis.
Metabolic pathway enrichment analysis revealed that the tryptophan metabolism, which included tryptophan, 5-HT, NAS, 6-hydroxymelatonin, 5-hydroxyindolea cetylglycine, N-Formylkynurenine, kynurenic acid and indole-3-acetate was the most significantly impacted metabolic pathway. Notably, these biomarkers were the important components in sleep-wake cycle and were related to a variety of neurological diseases.Citation28 Tryptophan could be metabolised by the tryptamine, kynurenine pathways as well as the 5-HT pathway, which mainly included tryptamine, kynurenine, tryptophan, and the downstream metabolites ().Citation29 Importantly, the increase of tryptophan, 5-HT, NAS, 5-hydroxyindoleacetylglycine, 6-hydroxymelatonin and the decrease of indole-3-acetate, N-Formyl-kynurenine and kynurenic acid indicated that tryptophan tended to the 5-HT pathway, thereby competitively reducing the conversion of tryptophan to kynurenic acid and tryptamine pathways. Tryptophan was the precursor of the 5-HT, which had a direct effect on the synthesis of 5-HT. In the central nervous system, tryptophan has been implicated in regulation of sleep, depression and anxiety.Citation30,Citation31 5-HT, a precursor for the synthesis of NAS and subsequent melatonin, is an important chemical substance that induces sleep. According to report, 5-HT has been claimed to help alleviate insomnia, depression, and headaches.Citation32 As the metabolites of 5-HT, NAS was believed to be potential biomarkers for sleep-related disorders.Citation33 Melatonin is produced by the pineal gland, which is located in the center of the brain but outside the blood-brain barrier.Citation34 The secretion of melatonin increases in darkness and decreases during exposure to light, thereby regulating the circadian rhythms of several biological functions, including the sleep–wake cycle.Citation35 Melatonin is mainly metabolized in liver via cytochromes P450 to form 6-hydroxymelatonin, which could reflect the level of metabolism of melatonin.Citation36 It has been reported that the 6-hydroxymelatonin had the potentially neuroprotective.Citation37 N-Formyl-kynurenine is the initial bioproduct of tryptophan metabolism via the kynurenine pathway that catabolizes nearly 95% of tryptophan in mammalian cells.Citation38 Kynurenic acid is a downstream product of N-Formyl-kynurenine, which adversely affects sleep and cognitive, in a dose-dependent manner, resulting in a disruption of the normal sleep architecture during the light phase.Citation39 In summary, the tryptophan metabolic pathway plays an important role in sleep and emotional disease.Citation40
Arginine and proline metabolism is one of the central pathways for the biosynthesis of the amino acids. Recent studies have shown that chlorogenic acid has a significant improvement effect in rat models of sleep deprivation, and the mechanism might regulate the abnormal pathways of arginine and proline metabolism.Citation41 At the same time, we found that proline was the only disturbed metabolite in this pathway, and its up-regulation might relate the decline of the metabolic levels. According to a previous study, cysteine and methionine is likely associated with psychiatric condition.Citation42 Additionally, MTA, a sulfur-containing nucleoside produced by animal tissue metabolism, is a marker of sleep deprivation. Normally, it was cleaved in eukaryotic cells by an MTA phosphorylase to adenine and 5-deoxy-5-methylthioribose-1-phosphate, which was the key step in the metabolism of cysteine and methionine.Citation43 Steroid hormone plays an essential role in regulating metabolism, salt and water balance, and in enhancing immunity, withstanding illness and injury.Citation44 Furthermore, the steroids could also be synthesized and metabolized by cholesterol in the central and peripheral nervous systems independently, acting on GABAA receptor.Citation45 This may provide a possible mechanism for the hypnotic effect of neurosteroids. Cortisol as key biomarker in steroid hormone biosynthesis had a consistent variation trend with published literature.Citation46
For the network pharmacology analysis, in total 138 compounds were determined and employed to construct C-T-B network combined with biomarkers. Notably, network pharmacology analysis highlighted 5 targets, namely AKT1, GAPDH, MAPK3, TP53 and EGFR. Among them, AKT1 was highly related to depressionCitation47 associated with disturbances of sleep, cancerCitation48 and hypnosis.Citation49 AKT1 encodes a serine/threonine kinase and is involved in lithium signaling, which has been considered a vulnerable gene for bipolar disorder previously.Citation50 A study considered that protein kinase AKT1 could be involved in pathogenesis of affective disorders.Citation51 Anti-GAPDH autoantibodies play an important role in the pathogenesis of neuropsychiatric disorders.Citation52 AKT1 and GAPDH were related to the disorder of glucose and energy metabolism in major depressive disorder.Citation53 Abundant researches indicated that inflammation-related targets such as MAPK3, TP53 and EGFR were important in the pathophysiology of depression.Citation54 Many reports have shown that MAPK played important part in synaptic plasticity.Citation55 The activation of p38 MAPK cascades are implicated in synaptic dysfunction in neurodegenerative disorders through clinical observations and preclinical investigations. Somatic mutations in the TP53 gene are one of the most frequent alterations in human cancers, which was associated with breast cancer and non-small cell lung cancer. The stress adaptive processes induced by mutant p53 trigger positive loops feeding its own accumulation in cancer cells.
Conclusion
Metabolomics analysis revealed that the abnormal metabolism of biomarkers occurred between the control and AIS groups implicated that AIS intervention might mediate the insomnia and emotional disease through the tryptophan metabolism pathway. Combining the results of network pharmacology analysis, we found that the material basis of AIS intervention was mainly FTPECs type chromones such as aquilarone F and sesquiterpene. On the basis of the network pharmacology results, it can be inferred that AIS intervention may mediate neural activity due to its action on AKT1, GAPDH, MAPK3, TP53 and EGFR. The pharmacological activity was mainly related to sedative-hypnotic and depression, which was consistent with the traditional effects of agarwood. The neural activity of agarwood is one of the most studied aspects with many active compounds and a promising drug candidate found, which will sustain it as a research hotspot in the future.Citation26,Citation56 This technique is promising to open new perspectives to using metabolomics and network pharmacology platform to resolve special TCM issues.
Acknowledgments
This study was supported by foundation from the National Nature Science Foundation of China (NO.81774173); Youth Innovation and technology program for the universities in Shandong Province (NO.2019KJM005).
Disclosure
The authors declare no conflicts of interest in this work.
References
- Chen HQ, Wei JH, Yang JS, et al. Chemical constituents of agarwood originating from the endemic genus Aquilaria plants. Chem Biodivers. 2012;9(2):236–250. doi:10.1002/cbdv.201100077
- Fahey JW, Zalcmann AT, Talalay P. The chemical diversity and distribution of glucosinolates and isothiocyanates among plants. Phytochemistry. 2001;56(1):5–51. doi:10.1016/s0031-9422(00)00316-2
- Gao X, Xie M, Liu S, et al. Chromatographic fingerprint analysis of metabolites in natural and artificial agarwood using gas chromatography-mass spectrometry combined with chemometric methods. J Chromatogr B Analyt Technol Biomed Life Sci. 2014;967:264–273. doi:10.1016/j.jchromb.2014.07.039
- Kuo TH, Huang HC, Hu CC. Mass spectrometry imaging guided molecular networking to expedite discovery and structural analysis of agarwood natural products. Anal Chim Acta. 2019;1080:95–103. doi:10.1016/j.aca.2019.05.070
- Liu Y, Chen H, Yang Y, et al. Whole-tree agarwood-inducing technique: an efficient novel technique for producing high-quality agarwood in cultivated Aquilaria sinensis trees. Molecules. 2013;18(3):3086–3106. doi:10.3390/molecules18033086
- Dai HF, Liu J, Han Z, Zeng YB, Wang H, Mei WL. Two new 2-(2-phenylethyl)chromones from Chinese eaglewood. J Asian Nat Prod Res. 2010;12(2):134–137. doi:10.1080/10286020903508424
- Wang S, Wang C, Peng D, et al. Agarwood essential oil displays sedative-hypnotic effects through the GABAergic system. Molecules. 2017;22(12):2190. doi:10.3390/molecules22122190
- Hashim YZ, Kerr PG, Abbas P, Mohd SH. Aquilaria spp. (agarwood) as source of health beneficial compounds: a review of traditional use, phytochemistry and pharmacology. J Ethnopharmacol. 2016;189:331–360. doi:10.1016/j.jep.2016.06.055
- Kao WY, Hsiang CY, Ho SC, Ho TY, Lee KT. Novel serotonin-boosting effect of incense smoke from Kynam agarwood in mice: the involvement of multiple neuroactive pathways. J Ethnopharmacol. 2021;275:114069. doi:10.1016/j.jep.2021.114069
- Liu Y, Xue Q, Li A, Li K, Qin X. Mechanisms exploration of herbal pair of HuangQi-DanShen on cerebral ischemia based on metabonomics and network pharmacology. J Ethnopharmacol. 2020;253:112688. doi:10.1016/j.jep.2020.112688
- Dang VT, Huang A, Werstuck GH. Untargeted metabolomics in the discovery of novel biomarkers and therapeutic targets for atherosclerotic cardiovascular diseases. Cardiovasc Hematol Disord Drug Targets. 2018;18(3):166–175. doi:10.2174/1871529X18666180420170108
- Huo HX, Zhu ZX, Pang DR, et al. Anti-neuroinflammatory sesquiterpenes from Chinese eaglewood. Fitoterapia. 2015;106:115–121. doi:10.1016/j.fitote.2015.08.009
- Liao G, Mei WL, Kong FD, Li W, Yuan JZ, Dai HF. 5,6,7,8-Tetrahydro-2-(2-phenylethyl)chromones from artificial agarwood of Aquilaria sinensis and their inhibitory activity against acetylcholinesterase. Phytochemistry. 2017;139:98–108. doi:10.1016/j.phytochem.2017.04.011
- Dahham SS, Tabana YM, Iqbal MA, et al. The anticancer, antioxidant and antimicrobial properties of the sesquiterpene beta-caryophyllene from the essential oil of Aquilaria crassna. Molecules. 2015;20(7):11808–11829. doi:10.3390/molecules200711808
- Huo HX, Gu YF, Sun H, et al. Anti-inflammatory 2-(2-phenylethyl)chromone derivatives from Chinese agarwood. Fitoterapia. 2017;118:49–55. doi:10.1016/j.fitote.2017.02.009
- Hao DC, Xiao PG. Network pharmacology: a Rosetta Stone for traditional Chinese medicine. Drug Dev Res. 2014;75(5):299–312. doi:10.1002/ddr.21214
- Basu S, Duren W, Evans CR, Burant CF, Michailidis G, Karnovsky A. Sparse network modeling and metscape-based visualization methods for the analysis of large-scale metabolomics data. Bioinformatics. 2017;33(10):1545–1553. doi:10.1093/bioinformatics/btx012
- Zhou Y, Zhou B, Pache L, et al. Metascape provides a biologist-oriented resource for the analysis of systems-level datasets. Nat Commun. 2019;10(1):1523. doi:10.1038/s41467-019-09234-6
- Binda C, Li M, Hubalek F, Restelli N, Edmondson DE, Mattevi A. Insights into the mode of inhibition of human mitochondrial monoamine oxidase B from high-resolution crystal structures. Proc Natl Acad Sci USA. 2003;100(17):9750–9755. doi:10.1073/pnas.1633804100
- De CL, Li M, Binda C, Lustig A, Edmondson DE, Mattevi A. Three-dimensional structure of human monoamine oxidase A (MAOA): relation to the structures of rat MAOA and human MAOB. Proc Natl Acad Sci USA. 2005;102(36):12684–12689. doi:10.1073/pnas.0505975102
- Ding G, Nie Y, Hou Y, et al. An integrated strategy of marker ingredients searching and near infrared spectroscopy rapid evaluation for the quality control of Chinese eaglewood. J Pharm Biomed Anal. 2015;114:462–470. doi:10.1016/j.jpba.2015.06.029
- Li Y, Sheng N, Wang L, Li S, Chen J, Lai X. Analysis of 2-(2-Phenylethyl)chromones by UPLC-ESI-QTOF-MS and multivariate statistical methods in wild and cultivated agarwood. Int J Mol Sci. 2016;17(5):771.
- Naef R. The volatile and semi‐volatile constituents of agarwood, the infected heartwood of Aquilaria species: a review. Flavour Frag J. 2015;26(2):73–87. doi:10.1002/ffj.2034
- Wei Y, Shu P, Hong J, Qin M. Qualitative and quantitative evaluation of phenolic compounds in Iris dichotoma Pall. Phytochem Anal. 2012;23(3):197–207. doi:10.1002/pca.1343
- Li W, Chen HQ, Wang H, Mei WL, Dai HF. Natural products in agarwood and Aquilaria plants: chemistry, biological activities and biosynthesis. Nat Prod Rep. 2021;38(3):528–565. doi:10.1039/d0np00042f
- Castro KP, Ito M. Individual and combined inhalational sedative effects in mice of low molecular weight aromatic compounds found in agarwood aroma. Molecules. 2021;26(5):1320. doi:10.3390/molecules26051320
- Wang X, Zhang A, Han Y, et al. Urine metabolomics analysis for biomarker discovery and detection of jaundice syndrome in patients with liver disease. Mol Cell Proteomics. 2012;11(8):370–380. doi:10.1074/mcp.M111.016006
- Du Y, Wu B, Xiao F, et al. Untargeted metabolomic study on the insomnia effect of Suan-Zao-Ren decoction in the rat serum and brain using ultra-high-performance liquid chromatography quadrupole time-of-flight mass spectrometry combined with data processing analysis. J Sep Sci. 2020;43(11):2019–2030. doi:10.1002/jssc.201901002
- Wyatt RJ, Engelman K, Kupfer DJ, Fram DH, Sjoerdsma A, Snyder F. Effects of L-tryptophan (a natural sedative) on human sleep. Lancet. 1970;2(7678):842–846. doi:10.1016/S0140-6736(70)92015-5
- Minet-Ringuet J, Le Ruyet PM, Tome D, Even PC. A tryptophan-rich protein diet efficiently restores sleep after food deprivation in the rat. Behav Brain Res. 2004;152(2):335–340. doi:10.1016/j.bbr.2003.10.018
- Yuwiler A, Brammer GL, Morley JE, Raleigh MJ, Flannery JW, Geller E. Short-term and repetitive administration of oral tryptophan in normal men. Effects on blood tryptophan, serotonin, and kynurenine concentrations. Arch Gen Psychiatry. 1981;38(6):619–626.
- Wang X, Yang B, Sun H, Zhang A. Pattern recognition approaches and computational systems tools for ultra performance liquid chromatography-mass spectrometry-based comprehensive metabolomic profiling and pathways analysis of biological data sets. Anal Chem. 2012;84(1):428–439. doi:10.1021/ac202828r
- Carter MD, Calcutt MW, Malow BA, Rose KL, Hachey DL. Quantitation of melatonin and n-acetylserotonin in human plasma by nanoflow LC-MS/MS and electrospray LC-MS/MS. J Mass Spectrom. 2012;47(3):277–285. doi:10.1002/jms.2051
- Robinson M, Turnbull S, Lee BY, Leonenko Z. The effects of melatonin, serotonin, tryptophan and NAS on the biophysical properties of DPPC monolayers. Biochim Biophys Acta Biomembr. 2020;1862(9):183363. doi:10.1016/j.bbamem.2020.183363
- Rahman MS, Kim BH, Takemura A, Park CB, Lee YD. Effects of moonlight exposure on plasma melatonin rhythms in the seagrass rabbitfish, Siganus canaliculatus. J Biol Rhythms. 2004;19(4):325–334. doi:10.1177/0748730404266712
- Ma X, Idle JR, Krausz KW, Gonzalez FJ. Metabolism of melatonin by human cytochromes p450. Drug Metab Dispos. 2005;33(4):489–494. doi:10.1124/dmd.104.002410
- Maharaj DS, Walker RB, Glass BD, Daya S. 6-hydroxymelatonin protects against cyanide induced oxidative stress in rat brain homogenates. J Chem Neuroanat. 2003;26(2):103–107. doi:10.1016/S0891-0618(03)00034-6
- Lovelace MD, Varney B, Sundaram G, et al. Recent evidence for an expanded role of the kynurenine pathway of tryptophan metabolism in neurological diseases. Neuropharmacology. 2017;112(Pt B):373–388. doi:10.1016/j.neuropharm.2016.03.024
- Pocivavsek A, Baratta AM, Mong JA, Viechweg SS. Acute kynurenine challenge disrupts sleep-wake architecture and impairs contextual memory in adult rats. Sleep. 2017;40(11). doi:10.1093/sleep/zsx141
- Zeisel SH. Dietary influences on neurotransmission. Adv Pediatr. 1986;33:23–47.
- Ma WN, Zhou MM, Gou XJ, et al. Urinary metabolomic study of chlorogenic acid in a rat model of chronic sleep deprivation using gas chromatography-mass spectrometry. Int J Genomics. 2018;2018:1361402. doi:10.1155/2018/1361402
- Zhou X, Liu L, Zhang Y, et al. Metabolomics identifies perturbations in amino acid metabolism in the prefrontal cortex of the learned helplessness rat model of depression. Neuroscience. 2017;343:1–9. doi:10.1016/j.neuroscience.2016.11.038
- Li P, Hu S, Zhang R, Wei S. Metabonomic analysis of hepatic metabolic homeostasis in mice with sleep deprivation. Prev Med. 2020;47(04):702–706.
- Schiffer L, Barnard L, Baranowski ES, et al. Human steroid biosynthesis, metabolism and excretion are differentially reflected by serum and urine steroid metabolomes: a comprehensive review. J Steroid Biochem Mol Biol. 2019;194:105439. doi:10.1016/j.jsbmb.2019.105439
- Hosie AM, Wilkins ME, Smart TG. Neurosteroid binding sites on GABA(A) receptors. Pharmacol Ther. 2007;116(1):7–19. doi:10.1016/j.pharmthera.2007.03.011
- Wang Y, Zhu D, Chen Y, et al. Metabonomics study of ginseng glycoproteins on improving sleep quality in mice. Biomed Res Int. 2019;2019:2561828. doi:10.1155/2019/2561828
- Zhang L, Zhang Y, Zhu M, et al. An integrative pharmacology-based strategy to uncover the mechanism of Xiong-Pi-Fang in treating coronary heart disease with depression. Front Pharmacol. 2021;12:590602. doi:10.3389/fphar.2021.590602
- Hyman DM, Smyth LM, Donoghue M, et al. AKT inhibition in solid tumors with AKT1 mutations. J Clin Oncol. 2017;35(20):2251–2259. doi:10.1200/JCO.2017.73.0143
- Álvaro-bartolomé M, García-Sevilla JA. The neuroplastic index p-FADD/FADD and phosphoprotein PEA-15, interacting at GABAA receptor, are upregulated in brain cortex during midazolam-induced hypnosis in mice. Eur Neuropsychopharmacol. 2015;25(11):2131–2144. doi:10.1016/j.euroneuro.2015.07.019
- Millischer V, Matheson GJ, Martinsson L, et al. AKT1 and genetic vulnerability to bipolar disorder. Psychiatry Res. 2020;284:112677. doi:10.1016/j.psychres.2019.112677
- Losenkov IS, Vyalova NM, Simutkin GG, Bokhan NA, Ivanova SA. An association of AKT1 gene polymorphism with antidepressant treatment response. World J Biol Psychiatry. 2016;17(3):239–242. doi:10.3109/15622975.2015.1112921
- Delunardo F, Soldati D, Bellisario V, et al. Anti-GAPDH autoantibodies as a pathogenic determinant and potential biomarker of neuropsychiatric diseases. Arthritis Rheumatol. 2016;68(11):2708–2716. doi:10.1002/art.39750
- Qin Y, Jiang X, Li W, et al. Chronic mild stress leads to aberrant glucose energy metabolism in depressed Macaca fascicularis models. Psychoneuroendocrinology. 2019;107:59–69. doi:10.1016/j.psyneuen.2019.05.007
- Moisan MP, Foury A, Dexpert S, et al. Transcriptomic signaling pathways involved in a naturalistic model of inflammation-related depression and its remission. Transl Psychiatry. 2021;11(1):203. doi:10.1038/s41398-021-01323-9
- Falcicchia C, Tozzi F, Arancio O, Watterson DM, Origlia N. Involvement of p38 MAPK in synaptic function and dysfunction. Int J Mol Sci. 2020;21(16):5624. doi:10.3390/ijms21165624
- Yang L, Qiao L, Xie D, et al. 2-(2-phenylethyl)chromones from Chinese eaglewood. Phytochemistry. 2012;76:92–97. doi:10.1016/j.phytochem.2011.11.017