
Zheng X, Yang S, Zhang R, Wang S, Li G, Zhou S. Drug Des Devel Ther. 2019;13:3171–3180.
The authors have advised due to an error that occurred inadvertently at the time of figure assembly, is incorrect. The correct is shown below.
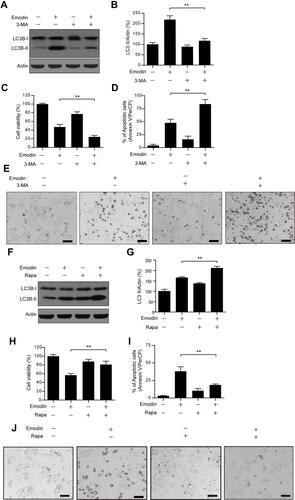
Figure 5 Emodin-induced autophagy played a protective role in L02 cells. (A) Cells were treated with or without emodin (40 μM) in the absence or presence of 3-MA (5 mM) for 24 h. The expression of LC3B-I/II was analysed by Western blot. (B) The intensities of LC3B-II in (A) normalized to actin were statistically analysed and represented as the mean ± SD for 3 independent experiments. **P<0.01. (C) Cell viability in (A) was determined by CCK-8 assay. Data are presented as the means ± SDs for 3 independent experiments. **P<0.01. (D) Cell apoptosis in (A) was detected by flow cytometry using annexin V/PerCP staining. Data are presented as the means ± SDs for 3 independent experiments. (E) Representative photos depicting the morphology of L02 cells treated in (A) Scale bars: 100 μm. (F) Cells were treated with or without emodin (40 μM) in the absence or presence of rapamycin (Rapa; 100 nM) for 24 h. The expression of LC3B-I/II was analysed by Western blot. (G) The intensities of LC3B-II in (F) normalized to actin were statistically analysed and are represented as the mean ± SD for 3 independent experiments. **P<0.01. (H) Cell viability in (F) was determined by CCK-8 assay. Data are presented as the means ± SDs for 3 independent experiments. **P<0.01. (I) Cell apoptosis in (F) was detected by flow cytometry using annexin V/PerCP staining. Data are presented as the means ± SDs for 3 independent experiments. (J) Representative photos depicting the morphology of L02 cells treated in (F). Scale bars: 100 μm.
The authors apologize for this error and advise since this image only displays the cell morphology and does not perform a semi-quantitative analysis, it does not affect the other results of , nor does it affect the conclusion of the article.