
Abstract
Background
Diabetic nephropathy has become the most common cause of morbidity and mortality in diabetic patients. Therefore, there is an urgent need for more effective and safer drugs for use in this condition.
Purpose
The aims of this study were to investigate the ameliorative effects of total saponin of Dioscoreae hypoglaucae rhizoma (TSD) on diabetic nephropathy and to explore the potential underlying mechanism(s).
Methods
Rats with streptozotocin-induced diabetes were orally treated with TSD at 40, 80, and 160 mg/kg/d for 12 weeks. At the end of the treatment, blood, urine, and kidneys were collected for biochemical and histological examination.
Results
The results demonstrated that TSD significantly decreased the fasting blood glucose, glycosylated hemoglobin, urinary protein, serum creatinine, and blood urea nitrogen levels in diabetic rats. The results of histological examinations showed that TSD ameliorated glomerular and tubular pathological changes in diabetic rats. Furthermore, TSD significantly prevented oxidative stress and reduced the renal levels of advanced glycation end products, transforming growth factor-β1, connective tissue growth factor, and tumor necrosis factor-α.
Conclusion
This study demonstrated the renoprotective effects of TSD in experimental diabetic nephropathy via a number of different mechanisms.
Introduction
The number of people with diabetes worldwide has been predicted to increase from over 366 million in 2011 to 552 million by 2030.Citation1 Diabetic nephropathy is one of the most serious and common complications associated with diabetes. It has become the major cause of mortality in diabetic patients and the major contributor to end-stage renal failure.Citation2,Citation3 The symptoms of diabetic nephropathy include renal hypertrophy, extracellular matrix (ECM) accumulation, glomerular hyperfiltration, and microalbuminuria. Among these symptoms, albuminuria is an early marker, and hence, a major biochemical feature in the clinical diagnosis of diabetic nephropathy.Citation2,Citation4,Citation5 Themechanisms of diabetic nephropathy are not yet fully understood, but a host of studies have demonstrated that hyperglycemia is the key initiating factor in its progression.Citation6 Oxidative stress and the accumulation of advanced glycation end products (AGEs), as a result of hyperglycemia, are acknowledged as the major factors contributing to the development of diabetic nephropathy.Citation7,Citation8 Inflammatory cytokines also play an important role during the initial stages, an example being the damage to the glomerularpermeability barrier caused by tumor necrosis factor-α (TNF-α).Citation9 It is reported that transforming growth factor-β1 (TGF-β1) is widely expressed in all kidney cells. Following activation by reactive oxygen species, TGF-β1 stimulates the synthesis of matrix components, the deposition of ECM, and the formation of albuminuria.Citation10 Moreover, as a cytokine, TGF-β1 has a role in the increase of blood urea nitrogen (BUN) and serum creatinine (Cr) in diabetic patients.Citation11
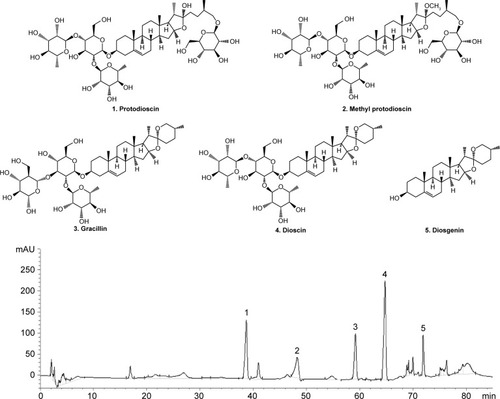
At present, only a few of the available drugs are effective in the clinical treatment of diabetic nephropathy; therefore, there is an urgent need to search for safe and effective drugs against the condition. Dioscoreae hypoglaucae rhizoma (Fen-Bixie in Chinese) is the dried rhizome of Dioscoreae hypoglaucae Palibin and has been used in traditional Chinese medicine for centuries in turbid urine therapy.Citation12 Total saponin of Dioscoreae hypoglaucae rhizoma (TSD) contains dioscin, diosgenin, gracillin, protodioscin, and methyl protodioscin and is the main bioactive component in this herbal medicine (). TSD has various pharmacological activities, such as antioxidative, anti-inflammatory, and lipid-lowering properties.Citation13–Citation15
Figure 1 The HPLC chromatograms of TSD.
Abbreivations: HPLC, high-performance liquid chromatography; TSD, total saponin of Dioscoreae hypoglaucae Palibin.
Based on the pharmacological effects of TSD and the mechanisms of diabetic nephropathy, we hypothesized that TSD may have a beneficial effect on diabetic nephropathy progression. Hence, this study was performed to examine the effects of TSD on diabetic nephropathy in streptozotocin (STZ)-induced diabetic rats. To elucidate its potential mechanisms of action, this study further investigated the effect of TSD on oxidative stress, inflammatory cytokines, and TGF-β1.
Materials and methods
Plant material
Dioscoreae hypoglaucae rhizoma was collected in November 2014 from Anhui, People’s Republic of China. The identity of the plants was confirmed by comparison with herbarium specimens. Voucher specimens were deposited at the Department of Chinese Medicine, China Pharmaceutical University, Nanjing, People’s Republic of China.
Preparation of TSD
The dried Dioscoreae hypoglaucae rhizoma (5 kg) were extracted three times with boiling 70% ethanol (50 L) for 2 hours each. The combined extracts were filtered and concentrated under reduced pressure. The concentrated solutions (10 L) were extracted with petroleum ether (3×5 L) and n-butanol (5×5 L) successively. After evaporation of the solvents, the n-butanol extract resulted in 125 g of brown solid. Subsequently, the brown solid was redissolved in 10 L of water and loaded onto an AB-8 macroporous resin column. The column was eluted with a gradient elution of ethanol–water (0%, 50%, and 70%). The 70% ethanol eluent was concentrated by rotary evaporation and lyophilized to obtain TSD in the form of a light brown powder.
HPLC analysis of TSD
High-performance liquid chromatography (HPLC) analysis was performed using an Agilent 1200 Series HPLC (Agilent Technologies, Santa Clara, CA, USA), coupled with a diode array detector. An Agilent C18 column (4.6 mm ×250 mm, 5 μm; Agilent Technologies) with the column temperature set at 30°C was used. Solvent A and B were H2O and acetonitrile, respectively. An elution program was set up as follows: 0–5 minutes, 5% B; 5–20 minutes, 5%–15% B; 20–65 minutes, 15%–55% B; 65–85 minutes, 55%–100% B. The flow rate was set at 1.0 mL/min, and the detection wavelength was set as 208 nm.
Chemicals and reagents
Metformin hydrochloride (Met, 99.1% purity) was supplied by Jingfeng Pharmaceutical Inc., Beijing, People’s Republic of China. STZ was obtained from Sigma-Aldrich Inc., St Louis, MO, USA. Kits for protein, blood glucose, superoxide dismutase (SOD), glutathione peroxidase (GSH-Px), catalase (CAT), malondialdehyde (MDA), Cr, BUN, hemoglobin, and glycosylated hemoglobin (GHb) were purchased from Nanjing Jiancheng Institute, Nanjing, People’s Republic of China. Enzyme-linked immunosorbent assay (ELISA) kits for TNF-α, interleukin-1β (IL-1β), interleukin-6 (IL-6), TGF-β1, and connective tissue growth factor (CTGF) were obtained from Cusabio Biotech Co. Ltd, Wuhan, People’s Republic of China. Rabbit anti-rat AGEs monoclonal antibody and rabbit anti-rat type IV collagen monoclonal antibody were purchased from Santa Cruz Biotechnology Inc., Santa Cruz, CA, USA.
Animals
Sprague-Dawley rats (male, 180–220 g), with the animal quality certificate number Su-SCKX2013-0011, were purchased from Jiangsu University Laboratory Animal Center, Nanjing, People’s Republic of China. All the animals were maintained at a constant temperature of 23°C±2°C on a 12-hour light/dark cycle with free access to normal laboratory food and water. Animal experimentation was approved by the ethics committee of the China Pharmaceutical University (CEAE-235, January 20, 2015). All procedures were in strict accordance with the Guide for the Care and Use of Laboratory Animals.Citation16
Experimental design and treatment protocol
After 7 days of adaptive feeding, the rats were fasted overnight. Diabetes was induced by injecting STZ (60 mg/kg, dissolved in 0.01 M sodium citrate buffer, pH 4.4) intraperitoneally. The normal control group (NC, 10 rats) received an equivalent amount of citrate buffer.Citation17 Diabetes was confirmed by measuring the fasting blood glucose (FBG) 72 hours after injection. The rats with an FBG level >16.7 mmol/L were considered diabetic and selected for further pharmacological studies.Citation18
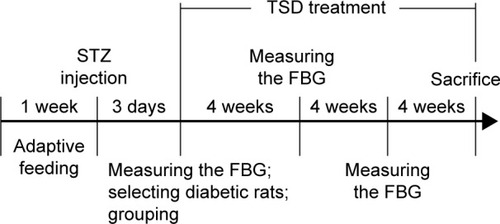
The diabetic rats were randomly divided into five groups of eight rats each. The diabetic control group (DC) consisted of diabetic rats treated with 0.4% carboxymethylcellulose sodium (CMC-Na) solution in a matched volume. The Met group was the positive control in this experiment and consisted of diabetic rats administered with Met 200 mg/kg/d. TSD-40, TSD-80, and TSD-160 groups consisted of diabetic rats administered with TSD 40, 80, and 160 mg/kg/day, respectively. The NC group was treated with 0.4% CMC-Na solution in a matched volume. All drugs were suspended in 0.4% CMC-Na solution and administered orally via an orogastric cannula, continuously for 12 weeks. The FBG was measured every 4 weeks. A schematic diagram of the induction and treatment schedule is shown in .
Figure 2 Schematic diagram of the induction and treatment schedule of diabetic rats.
At the end of the treatment, urine samples were collected from the rats housed in individual metabolic cages after 24 hours for analysis of the urine volume and biochemical parameters. After 12 hours of fasting, all rats were anesthetized, and blood was collected via the abdominal aorta, with or without heparin, for anticoagulant blood or serum, respectively. The right kidneys were weighed and fixed in 4% neutral formaldehyde solution for histology examination and immunohistochemistry. The renal cortexes of the left kidneys were immediately separated and stored at −80°C for biochemical estimations.
Analysis of blood biochemical parameters
Hemoglobin and GHb in whole blood were determined using commercially available kits according to the manufacturers’ instructions. GHb was calculated as the optical density value per 10 g of hemoglobin. The blood samples without heparin were centrifuged at 4,000× g for 10 minutes to separate the serum from the other components. The serum levels of FBG, serum Cr, and BUN were determined using diagnostic kits.
Analysis of urine biochemical parameters
Urine samples were centrifuged at 2,000× g for 5 minutes to obtain the supernatant. Urinary Cr and urinary protein were measured using commercially available kits according to the manufacturers’ instructions. The creatinine clearance ratio (CCR) was calculated as per our previous study: CCR = urinary Cr (mg/mL) × urine volume (mL/kg)/serum Cr (mg/mL)/1,440 (min).Citation19
Analysis of cytokine levels in kidney tissues
The renal cortex was sliced into pieces and homogenized with nine volumes of Tris–HCl (5 mmol/L containing 2 mmol/L EDTA, pH 7.4). Homogenates were centrifuged at 4,000× g for 10 minutes at 4°C to separate the supernatants. The levels of TNF-α, IL-1β, IL-6, TGF-β1, and CTGF in the supernatants were measured using ELISA kits according to the manufacturer’s protocols. The levels of these cytokines in renal tissue were normalized to the protein content, which was measured using the Bradford method.
Analysis of renal oxidative stress
As in our previous report, the activity of SOD, GSH-Px, CAT, and levels of MDA in renal homogenates were measured using commercially available kits according to the manufacturers’ instructions. Levels were normalized as U/mg protein or nmol/mg protein.Citation19
Histological examination of rat kidneys
The renal samples were fixed in 10% neutral formalin for 1 day at room temperature, dehydrated in a graded series of ethanol, embedded in paraffin, and cut into 4 μm thick sections on a rotary microtome. These sections were stained with hematoxylin–eosin (HE) and periodic acid–Schiff (PAS) reagent to assess alterations in the glomerulus and tubules. Renal sections were observed under a light microscope at a 200× magnification. In each section, at least 25 random glomeruli were observed by an investigator blinded to their origins. The cross-sectional areas and glomerular radii were assessed using a computer image analysis system. The glomerular volume was calculated using the following formula: glomerular volume =4πr3/3.Citation20 The index of mesangial expansion was scored using a quantitative estimate of the mesangial zone width in each glomerulus, expressed as a function of the total glomerular area: 0, normal glomeruli; 1, matrix expansion occurred in up to 50% of a glomerulus; 2, matrix expansion occurred in 50%–75% of a glomerulus; and 3, matrix expansion occurred in more than 75% of a glomerulus.Citation21
Immunohistochemical analysis of AGEs and type IV collagen
The renal sections were deparaffinized, rehydrated, and microwaved in citrate buffer (pH 6.0) for 10 minutes. They were then treated with 3% H2O2 buffer for 10 minutes. Subsequently, the sections were thoroughly washed in tap water and blocked with 10% (w/v) normal goat serum for 1 hour. Sections were then incubated with the rabbit monoclonal AGEs or type IV collagen antibody (primary antibodies) at 4°C overnight, followed by incubation with goat anti-rabbit IgG horseradish peroxidase (secondary antibody) for 30 minutes at 37°C. The sections were stained with the chromogen, diaminobenzidine, for 10 minutes to visualize AGEs and type IV collagen, followed by counterstaining with hematoxylin for 20 seconds. Finally, the sections were rinsed with phosphate-buffered saline and dried using gradient alcohol. The sections were evaluated under a light microscope, and at least 25 random fields per section were analyzed. Image-pro plus 6.0 (Media Cybernetics, Silver Spring, MD, USA) was used to calculate the value of the positive integrated optical density (IOD).
Cell culture and treatment
Rat mesangial cells were cultured in Dulbecco’s Modified Eagle’s Medium (DMEM, Sigma-Aldrich Inc.), supplemented with 10% fetal calf serum (FCS). After the mesangial cells reached 80% confluence, their growth was arrested by exposing them to 0.5% FCS for 24 hours. Following this, mesangial cells were treated with a low glucose solution (5.6 mM) in the control group, and a high glucose solution (30 mM) with or without TSD (20, 40, and 80 μg/mL) for 24 hours.Citation22 The levels of TGF-β1, type IV collagen, and IL-6 in mesangial cells were measured using ELISA kits.
Statistical analysis
All the values are represented as mean ± SD with eight rats in each group. Data sets with multiple comparisons were evaluated with one-way analysis of variance (ANOVA), followed by a post hoc test (Dunnett’s test). P-values lower than 0.05 were considered statistically significant.
Results
HPLC chromatogram of TSD
The typical HPLC chromatograms of a TSD sample are shown in . By comparing the retention times and the UV spectra to the reference standard, five compounds (protodioscin, methyl protodioscin, gracillin, dioscin, and diosgenin) were clearly identified.
Hypoglycemic effect of TSD
shows the effect of TSD on FBG. Before treatment, the FBG levels of the five diabetic groups were almost identical and significantly higher than those of the normal control group (P<0.01). However, after treatment with TSD for 4, 8, and 12 weeks, the FBG levels were significantly decreased (P<0.05).
Table 1 Effects of different treatments on FBG in diabetic rats
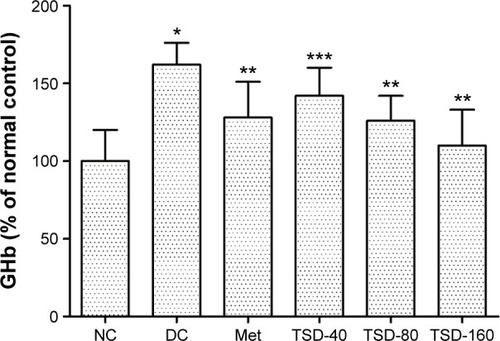
To further evaluate the hypoglycemic effect of TSD, the GHb levels in rats were determined. As shown in , the levels of GHb in diabetic rats were significantly increased (P<0.01), which was 161% of the value for normal rats. However, treatment with TSD for 12 weeks significantly decreased the GHb levels of diabetic rats (TSD-40, P<0.05; TSD-80 and TSD-160, P<0.01).
Figure 3 Effect of TSD on GHb in diabetic rats.
Abbreviations: GHb, glycosylated hemoglobin; NC, normal control group; DC, diabetic control group; Met, metformin hydrochloride group; TSD, total saponin of Dioscorea hypoglaucae Palibin.
Effects of TSD on kidney index, serum Cr, and BUN
As shown in , the kidney index significantly increased in the diabetic control group as compared with the normal control group (P<0.01). However, treatment with TSD for 12 weeks significantly reduced the increase in the kidney index (TSD-40, P<0.05; TSD-80 and TSD-160, P<0.01). Likewise, the serum Cr and BUN levels in diabetic rats were significantly higher than normal rats (P<0.01). Treatment with TSD for 12 weeks produced a significant reduction in serum Cr (TSD-40, P<0.05; TSD-80 and TSD-160, P<0.01) and BUN (TSD-80, P<0.05; TSD-160, P<0.01) levels.
Table 2 Effect of TSD on kidney index, BUN, serum Cr, CCR, and urine protein in diabetic rats
Effects of TSD on urinary protein and CCR
Urinary protein is an important indicator of glomerular dysfunction and tubular impairment. As shown in , the excretion of urinary protein was markedly elevated in the diabetic control group (P<0.01), which suggests that the creation of an early diabetic nephropathy model was successful. However, treatment with TSD for 12 weeks significantly decreased the urinary protein excretion of diabetic rats (TSD-40, P<0.05; TSD-80 and TSD-160, P<0.01). CCR is another marker of glomerular dysfunction. In our experiment, the CCR of diabetic rats was significantly lower when compared with the normal rats (P<0.01). However, treatment with TSD at doses of 80 and 160 mg/kg for 12 weeks significantly elevated their CCR (P<0.01).
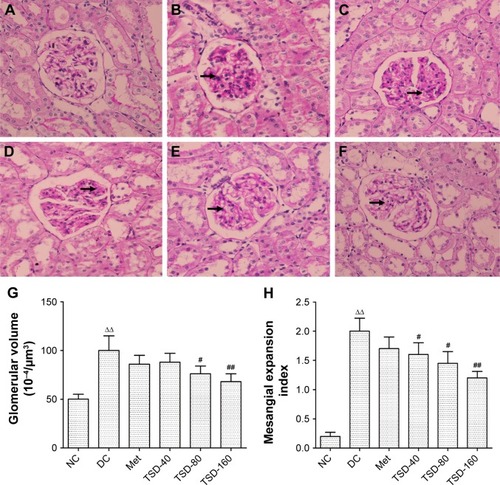
Effects of TSD on kidney histology
The sections from normal control rats showed normal or almost-normal histology of the kidney. The glomerulus, glomerular capsules, and tubules were very clear and prominent (). showed the representative glomerular and tubular changes in the diabetic rats. The tubular necrosis with vacuolar degeneration of proximal tubules, thickened basement membranes, and mononuclear cell infiltration were observed in diabetic rats’ kidneys (). The glomeruli of diabetic rats exhibited segmental sclerosis, with basement membrane thickening and mesangial matrix expansion (). Treatment with TSD for 12 weeks significantly ameliorated these changes in the kidneys. Furthermore, morphometric analysis indicated that TSD significantly inhibited the increase in glomerular volume and mesangial expansion index compared with vehicle treatment ().
Figure 4 Representative micrographs of kidney tissue stained with hematoxylin–eosin.
Abbreviations: NC, normal control group; DC, diabetic control group; Met, metformin hydrochloride group; TSD, total saponin of Dioscorea hypoglaucae Palibin.
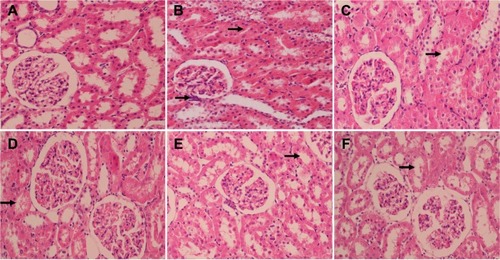
Figure 5 Representative micrographs of kidney tissue stained with periodic acid–Schiff.
Abbreviations: NC, normal control group; DC, diabetic control group; Met, metformin hydrochloride group; TSD, total saponin of Dioscorea hypoglaucae Palibin.
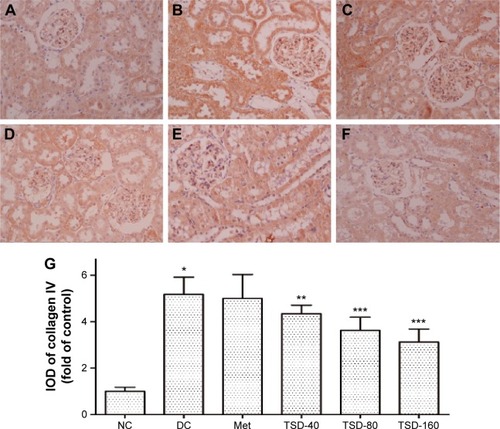
Effects of TSD on renal type IV collagen
Type IV collagen, a major component of basement membranes, is expressed in both the glomerular and tubular basement membranes. The effect of TSD on the expression level of type IV collagen was evaluated using immunohistochemistry. As shown in , there was a significant increase in the expression of type IV collagen in the renal glomeruli and tubules of the diabetic control rats (P<0.01). Treatment with TSD for 12 weeks significantly attenuated the increased expression of type IV collagen in diabetic kidneys (TSD-40, P<0.05; TSD-80 and TSD-160, P<0.01).
Figure 6 Effect of TSD on renal immunohistochemical stain of collagen IV in diabetic rats.
Abbreviations: IOD, integrated optical density; NC, normal control group; DC, diabetic control group; Met, metformin hydrochloride group; TSD, total saponin of Dioscorea hypoglaucae Palibin.
Effects of TSD on renal oxidative stress
Oxidative stress plays an important role in the development of diabetic nephropathy.Citation23 From , the antioxidative effect, the renal SOD, GSH-Px, and CAT activities in the diabetic control group can be seen to be markedly lower than those of the normal control group (P<0.01). However, renal MDA content was markedly higher than the normal control group (P<0.01). Treatment with TSD for 12 weeks effectively elevated the activities of SOD (TSD-80, P<0.05; TSD-160, P<0.01), GSH-Px (TSD-40 and TSD-80, P<0.05; TSD-160, P<0.01), and CAT (TSD-80 and TSD-160, P<0.05). Furthermore, the MDA content was reduced (TSD-80 and TSD-160, P<0.05). The results indicate that TSD effectively inhibits renal oxidative stress in diabetic rats.
Table 3 Effect of TSD on renal SOD, CAT, GSH-Px, and MDA levels in diabetic rats
Effects of TSD on renal inflammatory cytokines
TNF-α, IL-1β, and IL-6 are key pathogenic factors involved in the development of diabetic nephropathy and are key therapeutic targets.Citation9 In this study, we investigated the effect of TSD on renal TNF-α, IL-1β, and IL-6 in diabetic rats. As shown in , significantly elevated levels of renal TNF-α, IL-1β, and IL-6 were found in the diabetic control rats (P<0.01). However, treatment with TSD for 12 weeks reduced the renal TNF-α content (TSD-40, P<0.05; TSD-80 and TSD-160, P<0.01), IL-1β (TSD-40, P<0.05; TSD-80 and TSD-160, P<0.01), and IL-6 (TSD-80 and TSD-160, P<0.01) in a dose-dependent manner in diabetic rats.
Table 4 Effect of TSD on renal TGF-β1, CTGF, TNF-α, IL-1β, and IL-6 levels in diabetic rats
Effects of TSD on renal TGF-β1 and CTGF
The TGF-β1/CTGF axis plays a critical role in progressive kidney disease, including diabetic nephropathy.Citation24 shows the effect of TSD on the levels of TGF-β1 and CTGF in renal tissue. The renal TGF-β1 and CTGF levels in the diabetic control group were markedly increased when compared with the normal control group (P<0.01). Treatment with TSD for 12 weeks effectively inhibited the increase in renal TGF-β1 and CTGF levels (TSD-40, P<0.05; TSD-80 and TSD-160, P<0.01).
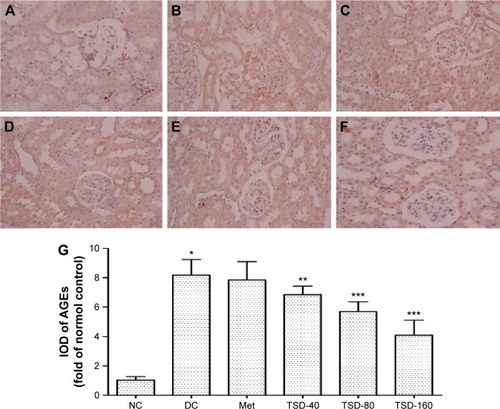
Effects of TSD on renal AGEs
AGEs are considered as markers of diabetic nephropathy.Citation25 As shown in , when compared with the normal control group, the renal AGEs content markedly increased in the diabetic control group (P<0.01). However, the increase in renal AGEs content was effectively relieved by the administration of TSD (TSD-40, P<0.05; TSD-80 and TSD-160, P<0.01).
Figure 7 Effect of TSD on renal immunohistochemical stain of AGEs in diabetic rats.
Abbreviations: AGEs, advanced glycation end products; IOD, integrated optical density; NC, normal control group; DC, diabetic control group; Met, metformin hydrochloride group; TSD, total saponin of Dioscorea hypoglaucae Palibin; SD, standard deviation.
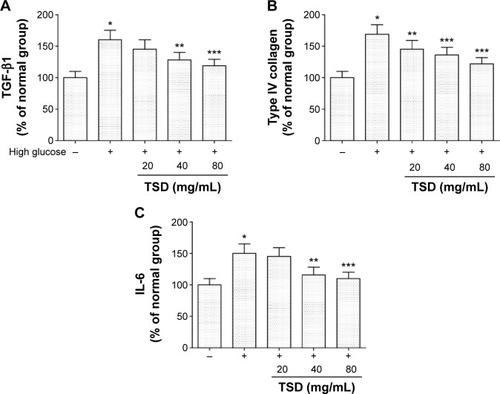
Effects of TSD on TGF-β1, type IV collagen, and IL-6 in vitro
Under high glucose conditions, TGF-β1, type IV collagen, and IL-6 were significantly increased when compared with the levels in mesangial cells treated with a low glucose solution (P<0.01). At concentrations of 0.1 and 1 mg/mL, TSD was able to significantly inhibit the expression of TGF-β1, type IV collagen, and IL-6 (P<0.05; ).
Figure 8 Effects of TSD on TGF-β1 (A), type IV collagen (B), and IL-6 (C) in vitro.
Abbreviations: IL-6, interleukin-6; TGF-β1, transforming growth factor-β1; TSD, total saponin of Dioscorea hypoglaucae Palibin; SD, standard deviation.
Discussion
Type 1 diabetes is caused by the devastation of β cells via apoptosis. Streptozotocin has been extensively used to induce diabetes by destroying β cells.Citation26 The rapid induction of type 1 diabetes after a single high dose of streptozotocin shows a triphasic glycemic response following streptozotocin-induced β cell destruction: the initial hyperglycemic phase, the second hypoglycemic phase, and the steady hyperglycemic phase.Citation27 The steady hyperglycemic phase involves a rise in blood glucose levels up to 19–32 mmol/L. In this study, the FBG of diabetic rats was maintained at 25–32 mmol/L.
Renal hypertrophy, ECM accumulation, basement membrane thickening, tubulointerstitial fibrosis, and albuminuria are typical features of diabetic nephropathy. In our study, diabetic rats demonstrated these features, which were significantly inhibited by TSD treatment. These findings suggest that TSD can effectively ameliorate renal damage in diabetic rats.
Much of the diabetes research suggests that hyperglycemia is the inducer of diabetic complications, including nephropathy. Historically, various hypotheses have been proposed to suggest potential mechanisms by which hyperglycemia may cause diabetic complications. These include increased polyol pathway flux, excessive activation of protein kinase C isoforms, increased intracellular formation of AGEs, and increased hexosamine pathway flux.Citation7 Recent studies suggest that the overproduction of superoxide by the mitochondrial electron transport chain could be the common element linking these four mechanisms. It is suggested that oxidative stress may play a key role in the development of diabetic nephropathy.Citation20 In this study, treatment with TSD increased the activity of renal SOD, GSH-Px, and CAT, and decreased renal MDA content. In other words, TSD improved the antioxidant defenses and inhibited the oxidative stress state in diabetic nephropathy rats. These results indicate that TSD imparts renoprotection against oxidative stress in diabetic nephropathy.
AGEs have been implicated in the pathogenesis of diabetic nephropathy, which is indicated by the fact that the AGEs inhibitors such as aminoguanidine, pyridoxamine, and ALT-946 ameliorated renal damage in diabetic patients.Citation7,Citation28,Citation29 It has been reported that hyperglycemia enhances the level of reactive oxygen species, which then facilitates the formation of AGEs. At the same time, the interactions of AGEs with their receptors alter intracellular signaling and enhance the release of proinflammatory cytokines and free radicals that contribute toward the pathology of diabetic complications.Citation7,Citation28 This mutual interaction leads to the thickening of the basement membrane, altered filtration, and, ultimately, loss of glomerular function. In our study, TSD reduced the accumulation of AGEs, which could be beneficial for the prevention of diabetic nephropathy.
TGF-β1, stimulated by high glucose concentrations, AGEs, and reactive oxygen species in diabetes, plays an important role in the pathogenesis of diabetic nephropathy. TGF-β1 is a potent stimulus for ECM and fibronectin accumulation, and furthermore, causes renal tubulointerstitial fibrogenesis.Citation11,Citation30 Moreover, the excessive deposition of type IV collagen, caused by TGF-β1, is one of the causes of diabetic tubulopathy and glomerulopathy. In this study, treatment with TSD inhibited the expression of TGF-β1, accumulation of type IV collagen, and ECM, and ameliorated mesangial expansion. The results suggest that the inhibition of TGF-β1 plays an important role in the renoprotective actions of TSD.
CTGF, stimulated by hyperglycemia, the formation of AGEs, and hemodynamic changes are increasingly being implicated in structural and functional changes associated with diabetic nephropathy.Citation31 A study has identified that CTGF promotes fibroblast proliferation, migration, adhesion, and ECM formation in the kidney.Citation32 Furthermore, CTGF not only mediates the induction of ECM protein expression but also inhibits matrix degradation. CTGF is a crucial downstream mediator of TGF-β1, which in turn induces the accumulation of ECM proteins (such as fibronectin and collagen IV) via CTGF pathways.Citation24 Thus, TGF-β1 and CTGF form a major axis in renal fibrosis. In our experiments, TSD markedly ameliorated the increase in CTGF in diabetic rats. These results suggest that TSD may ameliorate renal fibrosis via mediating the TGF-β1/CTGF axis.
Increasing evidence demonstrates that the diabetic nephropathy is closely related to inflammation. This is especially the case as TNF-α plays a prominent role in the development and progression of diabetic nephropathy.Citation33 Renal TNF-α production is initiated from many sources. Under the stimulation of AGEs and at high glucose levels, monocytes; macrophages; and endothelial, mesangial, glomerular, and tubular epithelial cells can synthesize and release TNF-α. Therefore, TNF-α is able to exert its pleiotropic biological activities on different renal structures.Citation9 Overexpression of TNF-α can result in a reduction in the glomerular filtration rate, damage to the glomerular permeability barrier, and apoptosis of renal cells.Citation9 Therefore, modulation of TNF-α activity is considered a potential therapeutic target in the treatment of diabetic nephropathy. In experimental models of nephropathy, renal expression of IL-6 increases, which increases endothelial permeability, mesangial cell proliferation, and fibronectin expression.Citation34 IL-1β is also involved in renal injury. IL-1β directly initiates glomerular hypercellularity and increases vascular endothelial cell permeability.Citation35 In this study, TSD significantly decreased the expression of TNF-α, IL-1β, and IL-6 in diabetic renal tissue, and thus, alleviated the structural and functional abnormalities of the diabetic kidney.
Dioscin, diosgenin, gracillin, protodioscin, and methyl protodioscin are the main constituents of Dioscoreae hypoglaucae rhizoma. Among them, dioscin, gracillin, protodioscin, and methyl protodioscin all show similarity with the basic parent structure of diosgenin. Diosgenin possesses a wide array of biological and pharmacological activities such as antidiabetic and anti-inflammatory activity.Citation36 It is suggested that all of these compounds are responsible for the numerous beneficial effects of TSD.
Conclusion
In summary, we demonstrated that TSD effectively decreased the FBG and the levels of reactive oxygen species and urine protein. Furthermore, it reduced type IV collagen, AGEs, TGF-β1, CTGF, and inflammatory cytokine expression in diabetic kidneys. These results indicate that TSD may have renoprotective effects on STZ-induced diabetic rats. Thus, it shows potential for further study into its clinical application.
Authors contributions
Acquisition of data: Changrun Guo and Gang Ding; analysis and interpretation of data: Changrun Guo, Zhaoqing Meng, and Wei Xiao; drafting of manuscript: Changrun Guo, Wenzhe Huang, and Zhenzhong Wang; critical revision: Changrun Guo, Zhaoqing Meng, and Wei Xiao. All authors contributed toward data analysis, drafting and critically revising the paper, and agree to be accountable for all aspects of the work.
Disclosure
The authors report no conflicts of interest in this work.
References
- International Diabetes FederationGlobal Diabetes Plan 2011–2021 Available from: http://www.idf.org/global-diabetes-plan-2011-2021Accessed January 7, 2016
- BadalSSDaneshFRDiabetic nephropathy: emerging biomarkers for risk assessmentDiabetes20156493063306526294427
- LopesAAEnd-stage renal disease due to diabetes in racial/ethnic minorities and disadvantaged populationsEthn Dis200919Suppl 1S1S47
- LeeseGPSavageMWChattingtonPDThe diabetic patient with hypertensionPostgrad Med J19964652632688761497
- MishraABhattiRSinghAAmeliorative effect of the cinnamon oil from Cinnamomum zeylanicum upon early stage diabetic nephropathyPlanta Med201076541241719876811
- UK Prospective Diabetes Study GroupIntensive blood-glucose control with sulphonylureas or insulin compared with conventional treatment and risk of complications in patients with type 2 diabetes (UKPDS33)Lancet1998352837853
- BrownleeMBiochemistry and molecular cell biology of diabetic complicationsNature2001414686581382011742414
- KaliaKSharmaSMistryKNon-enzymatic glycosylation of immunoglobulins in diabetic nephropathyClin Chim Acta20043471–216917615313155
- NavarroJFMora-FernándezCThe role of TNF-α in diabetic nephropathy: pathogenic and therapeutic implicationsCytokine Growth Factor Rev200617644145017113815
- TaharaATsukadaJTomuraYVasopressin increases type IV collagen production through the induction of transforming growth factor-beta secretion in rat mesangial cellsPharmacol Res200857214215018299204
- HuYYYeSDZhaoLLHydrochloride pioglitazone decreases urinary TGF-beta1 excretion in type 2 diabeticsEur J Clin Invest201040757157420482594
- State Pharmacopeia Committee of ChinaThe Pharmacopoeia of People’s Republic of China 2015 VersionsBeijing, ChinaChina Medical Science Press2015289
- PoudelBLimSWKiHHNepaliSLeeYMKimDKDioscin inhibits adipogenesis through the AMPK/MAPK pathway in 3T3-L1 cells and modulates fat accumulation in obese miceInt J Mol Med20143451401140825189808
- TaoXWanXXuYDioscin attenuates hepatic ischemia-reperfusion injury in rats through inhibition of oxidative–nitrative stress, inflammation and apoptosisTransplantation201498660461125083618
- WuSXuHPengJPotent anti-inflammatory effect of dioscin mediated by suppression of TNF-α-induced VCAM-1, ICAM-1 and EL expression via the NF-κB pathwayBiochimie20151105627225577996
- World Health OrganizationWorld Health Organization ChronicleGeneva, SwitzerlandWHO19855156
- MoreeSSKavishankarGBRajeshaJAntidiabetic effect of secoisolariciresinol diglucoside in streptozotocin-induced diabetic ratsPhytomedicine2013203–423724523271000
- SoetiknoVSariFRSukumaranVCurcumin decreases renal triglyceride accumulation through AMPK–SREBP signaling pathway in streptozotocin-induced type 1 diabetic ratsJ Nutr Biochem201324579680222898567
- GuoCRHanFYZhangCFProtective effects of oxymatrine on experimental diabetic nephropathyPlanta Med20148041824414304
- Van DammeBKoudstaalJMeasuring glomerular diameters tissue sectionsVirchows Arch A Pathol Anat Histol19763694283291816063
- LiuIMTzengTFLiouSSThe amelioration of streptozotocin diabetes-induced renal damage by Wu-Ling-San (Hoelen Five Herb Formula), a traditional Chinese prescriptionJ Ethnopharmacol2009124221121819397971
- YanYFangPYangMAnti-diabetic nephropathy compounds from Cinnamomum cassiaJ Ethnopharmacol201516514114725725434
- LvSChengJSunAMesenchymal stem cells transplantation ameliorates glomerular injury in streptozotocin-induced diabetic nephropathy in rats via inhibiting oxidative stressDiabetes Res Clin Pract2014104114315424513119
- QiWChenXPoronnikPTransforming growth factor-β/connective tissue growth factor axis in the kidneyInt J Biochem Cell Biol200840191317300978
- BeisswengerPJHowellSKRussellGDetection of diabetic nephropathy from advanced glycation endproducts (AGEs) differs in plasma and urine, and is dependent on the method of preparationAmino Acids201446231131924036985
- ReusserFMode of action of streptozotocinJ Bacteriol19711055805884993338
- TjÄlveHWilanderEJohanssonE-BDistribution of labeled streptozotocin in mice: uptake and retention in pancreatic isletsJ Endocrinol197669455456133197
- AhmedNAdvanced glycation endproducts – role in pathology of diabetic complicationsDiabetes Res Clin Pract200567132115620429
- WuDWenWQiCAmeliorative effect of berberine on renal damage in rats with diabetes induced by high-fat diet and streptozotocinPhytomedicine2012198–971271822483555
- PowellDWBertramCCCumminsTDRenal tubulointerstitial fibrosis in OVE26 type 1 diabetic miceNephron Exp Nephrol20091111e11e1919052473
- RooneyBDonovanHGaffneyACTGF/CCN2 activates canonical Wnt signalling in mesangial cells through LRP6: implications for the pathogenesis of diabetic nephropathyFEBS Lett2011585353153821237163
- ThomsonSEMcLennanSVKirwanPDRenal connective tissue growth factor correlates with glomerular basement membrane thickness and prospective albuminuria in a non-human primate model of diabetes: possible predictive marker for incipient diabetic nephropathyJ Diabetes Complications200822428429418413184
- Mensah-BrownEPKObinecheENGaladariSStreptozotocin-induced diabetic nephropathy in rats: the role of inflammatory cytokinesCytokine200531318019015975818
- Navarro-GonzalezJFMora-Fernandez C. The role of inflammatory cytokines in diabetic nephropathyJ Am Soc Nephrol200819343344218256353
- JonesSJonesSPhillipsAORegulation of renal proximal tubular epithelial cell hyaluronan generation: implications for diabetic nephropathyKidney Int20015951739174911318944
- KanikaPManojGVijayTDineshKPA review on pharmacological and analytical aspects of diosgenin: a concise reportNat Prod Bioprospect2012224652