
Abstract
Background
Epidemiologic evidence on body mass index (BMI)-metabolic status phenotypes and diabetes risk remains controversial, especially for metabolically healthy obesity (MHO). We aimed to examine the effect of metabolic health and obesity phenotype on diabetes risk in the Chinese population.
Methods
A population-based cohort study was carried out. The baseline survey was conducted in 2017, with two follow-up visits in 2018 and 2020. Diabetes was defined based on the criteria of the World Health Organization. Robust generalized estimating equation models with a binary distribution using a log link and exchange structure were applied for the pooled analysis sample.
Results
A total sample of 9623 observations was pooled for the longitudinal data analysis. The average follow-up time was 1.64 years per person and the overall incidence density of diabetes was 6.94% person-years. Decreased diabetes risk was found in metabolically healthy overweight phenotype (RR = 0.65; 95% CI = 0.47–0.90) and no significant associations were detected for the MHO individuals (RR = 0.99; 95% CI = 0.63–1.53) compared with those of metabolically healthy normal weight, in contrast to metabolically unhealthy normal weight (MU-NW) (RR = 1.81; 95% CI = 1.28–2.55), metabolically unhealthy overweight (MU-OW) (RR = 2.02; 95% CI = 1.57–2.61) and metabolically unhealthy obesity (MUO) (RR = 2.48; 95% CI = 1.89–3.26) phenotypes. Significant associations between BMI-metabolic status phenotypes and diabetes were found in both males and females.
Conclusion
The MUO phenotype needs to be accorded much more importance. MU-NW and MU-OW are also important component for targeted prevention. Our findings can be targeted for optimizing preventive strategies to mitigate the obviously increased prevalence of diabetes.
Introduction
Diabetes mellitus (DM), a collective term for heterogeneous metabolic disorders whose main finding is chronic hyperglycemia, is a public health issue that has caused burdens of morbidity, mortality, and economic impact on individuals, families, health systems, and national economies.Citation1–Citation3 The global prevalence of DM in 2019 was estimated to be 9.3% (463 million people), with a projection of 10.2% (578 million people) for 2030 and 10.9% (700 million people) for 20452. Approximately, 90% of DM cases are attributed to type 2 diabetes mellitus (T2DM).Citation2,Citation3 Remarkably, China has witnessed one of the most dramatic rises in the prevalence of DM anywhere in the world and accounts for the largest number of individuals with 114 million cases of DM, mainly T2DM.Citation4–Citation6 Given that the cause of the rising prevalence of DM remains unclear, there is an urgent need to identify “high-risk” individuals and to implement targeted prevention to tackle diabetes.
Currently, obesity is a nearly global epidemic, affecting more than 20% of the general population.Citation7–Citation9 Metabolic syndrome and obesity frequently co-exist, allowing the categorization of obesity into different body mass index (BMI)-metabolic status phenotypes. It is suggested that 87% of overweight/obesity are not able to develop DM, but obtain some degree of fat-induced insulin resistance, which is not sufficient to cause diabetes.Citation8 In contrast to metabolically unhealthy obesity (MUO), an estimated 15–45% of individuals with obesity present insulin sensitivity, favorable glucose, blood pressure, hormone, lipid profiles, and inflammation levels despite excess adiposity; these are classified as the metabolically healthy obese (MHO).Citation7,Citation10–Citation12 In contrast, 5–30% of normal weight individuals do not present metabolically health, categorized as metabolically unhealthy-normal weight (MU-NW), which is defined as “metabolically obese of normal weight”.Citation7 Obviously, taking the current epidemic of obesity and sub-phenotypes into consideration, “one size fits all” approaches to tackle obesity seem inappropriate.Citation7 The association between BMI-metabolic status phenotypes and the risk of DM remains controversial, especially for MHO.Citation13–Citation15 Several studies have reported that MHO individuals were not at increased risk for DM, in comparison with the metabolically healthy non-obese and may not benefit from lifestyle interventions.Citation13,Citation16 However, some studies have provided evidence that MHO is significantly associated with increased risk of incident DM.Citation14,Citation15
Overall, the evidence is inconsistent, especially for different ethnicities. The results of extant research may not be applicable to the Chinese population. Given that there are no universally and uniformly accepted standards to define obesity phenotypes,Citation17 it is necessary to notice that BMI-metabolic status phenotypes can be identified by geographic regions of the word and ethnicity independently.Citation7,Citation9 Additionally, the classification of obese sub-phenotypes is not explicit, for some BMI categories of obesity and overweight were always combined in previous studies. Thus, to better understand the roles of different BMI-metabolic status phenotypes for incident DM, we measured the incidence density of DM by phenotypes and investigated the effects of metabolic health and obesity phenotypes on the risk of incident DM. We focused on repeated observations of the same individual at each follow-up examination in this longitudinal study to identify the “high-risk” and “low-risk” BMI-metabolic status phenotypes for early prevention of DM among the Chinese population.
Materials and Methods
Study Design and Study Population
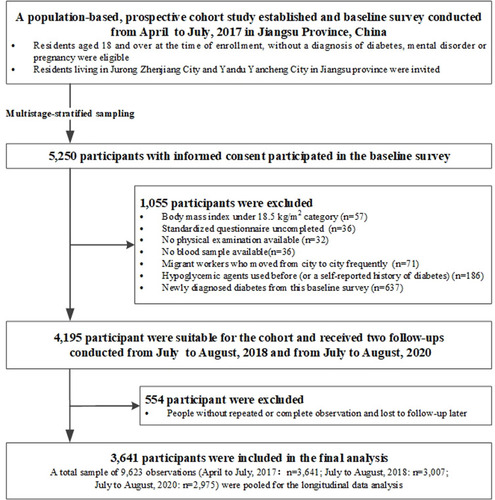
A population-based prospective cohort study was established in Jiangsu province, China. The baseline survey was conducted between April and July 2017, and samples were selected using multistage-stratified sampling methods from Jurong Zhengjiang and Yandu Yancheng, two cities in Jiangsu province (Supplementary Figure S1). In the first stage, three district/town-level units were randomly chosen from Jurong and Yandu, respectively. Then eight to nine neighborhood/village-level units were randomly selected from every district/town-level unit and about 100 residents per neighborhood/village-level units were randomly sampled. Individuals aged 18 years and over at the time of enrollment, without mental disorders, pregnancy or a diagnosis of DM were eligible for this study. With the help and support of local community councils, residents living at their registered address and having permanent living records of Chinese nationality were invited. The final sample of 5318 participants fell within 50 neighborhoods/villages; 5250 participants with written informed consent were included with a response rate of 98.72%.
Overall, 5250 residents participated in the baseline survey which consisted of a questionnaire, physical and laboratory examination. Several participants with particular missing values at baseline were excluded: uncompleted questionnaires (n = 36), physical examination not done (n = 32) and no blood sample available (n = 36). We further excluded participants who were migrant workers and moved from city to city frequently (n = 71), those who had used antidiabetics before (or had a self-reported history of DM) (n = 186), as well as those who were newly diagnosed with diabetes at the baseline survey (n=637). According to the criteria of The Working Group on Obesity in China, the classification of BMI was defined as follows:Citation18 underweight (BMI < 18.5 kg/m2), normal (18.5 ≤ BMI < 24.0 kg/m2), overweight (24.0 ≤ BMI < 28.0 kg/m2) and obesity (BMI ≥ 28.0 kg/m2). After removing the underweight individuals (n = 57) from baseline survey, 4195 participants were further classified into six groups according to the BMI-metabolic status phenotypes and received follow-ups (Supplementary Figure S1). Subsequently, two follow-up visits for data collection took place from July to August 2018 (re-investigated n = 3043) and from July to August, 2020 (re-investigated n = 3003), respectively. After excluding those participants without at least one follow-up examination and those who did not complete the physical or laboratory examination, with missing data preventing definition of BMI-metabolic status phenotypes and outcomes during follow-up (n = 554), we pooled data from the population study (baseline in April to July, 2017) which consisted of 3641 participants, and its two follow-ups examination (July to August, 2018: n=3007; July to August, 2020: n=2975) for our longitudinal data analysis. This resulted in a final analysis sample of 9623 observations across three time points (). Thus, we obtained an analysis dataset with repeated observations, including 2345 participants with three observations and 1292 with two observations.
Figure 1 Flowchart for selection of study participants.
This study was conducted in accordance with the Declaration of Helsinki. The study was viewed and approved by the Ethics Review Committee of Zhongda Hospital, Southeast University and Jiangsu Provincial Centre for Disease Control and Prevention (JSJK2017-B003-02). Every participant provided written informed consent.
Data Collection at Baseline and Follow-Up Examinations (2018 and 2020)
All enrolled participants completed an interview conducted by experienced local health workers using a standardized questionnaire to collected information regarding their demographic characteristics (age, gender, education level and self-reported drug history, history of chronic disease and family history of DM), as well as behavioral characteristics (smoking status, drinking status and regular physical activity). These characteristics were further categorized as follows: education level (junior high school or below/ senior high school or above), drug history (no/yes/unclear), history of chronic disease (no/yes) and family history of DM (no/yes/unclear). Smoking status was divided as follows: never (non-smoker) and ever (current smoker or ex-smoker), and drinking status as (never/ever). Regular exercise was grouped as follows: no and yes (recreational sports activities more than 30 minutes per time, more than three times a week). Weight was measured with a digital scale to the nearest 0.1kg with light clothes and height was measured to the nearest 0.1 cm using a wall-mounted stadiometer. BMI was calculated from weight and height (BMI=weight/heightCitation2), and normal weight, overweight and obesity were defined as 18.5 ≤ BMI < 24.0 kg/m2, 24.0 ≤ BMI < 28.0 kg/m2, and BMI ≥ 28 kg/m2, respectively.Citation18 Participants were asked to have at least a 5-min rest in a seated position before their systolic blood pressure (SBP) and diastolic blood pressure (DBP) were measured using electronic sphygmomanometers. Waist circumference (WC) and hip circumference were measured using a tape with a metric scale under standardized procedures, with the participants in a standing position. The thresholds for WC were specified according to the International Diabetes Foundation (IDF) for the Chinese populations (WC > 80cm for females and WC > 90cm for males).Citation19 For detecting central obesity in the Chinese adult population, a waist-to-height ratio ≥ 0.50 was considered as the optimal cut-off value.Citation20 According to the World Health Organization (WHO), the cut-off values for metabolic complications for waist-to–hip ratio are also defined (0.85 in women and 0.90 in men).Citation19 Forearm venous blood samples were collected and measured for biochemical characteristics after overnight fasting for more than 8 hours before examination. Subsequently, standard oral glucose tolerance tests (OGTT) (75g anhydrous glucose) were administered and conducted without eating breakfast; 2 hours later, a second blood sample was taken for 2-hour plasma glucose (2hPG). Blood tests were all conducted in the same central laboratory (Adicon, Nanjing China) by the same method to maintain consistency, and included fasting plasma glucose (FPG), 2hPG, glycosylated hemoglobin (HbA1c), aspartate aminotransferase, alanine transaminase, gamma glutamyl transferase, serum total bilirubin, low-density lipoprotein cholesterol, high-density lipoprotein cholesterol (HDL-C), total cholesterol and triglyceride (TG). The method of data collection and blood sample testing for the two follow-up examinations was exactly as same as for the baseline survey. All variables, including behavioral, anthropometric and biochemical characteristics, were assessed repeatedly at each follow-up examination (2018 and 2020).
Definitions of BMI-Metabolic Status Phenotypes and Diabetes
The National Cholesterol Education Program Adult Treatment Panel III (ATP III), a standard operating protocol, was applied to define metabolic status.Citation7,Citation21 Metabolically healthy was defined as participants meeting fewer than three of the following five criteria:Citation21 (1) Elevated WC with population-specific definitions (> 90 cm for men and > 80 cm for women);Citation19 (2) elevated FPG (> 100 mg/dl) or using glucose-lowering agents; (3) reduced HDL-C (< 40 mg/dl for men or < 50 mg/dl for women); (4) elevated TG (≥ 150 mg/dl) or using lipid-lowing drugs; (5) elevated SBP (≥ 130 mmHg) or DBP (≥ 85 mmHg), or using anti-hypertensive drugs. Based on criteria for BMI of the Working Group on obesity in China, alongside the metabolic status, participants were grouped according to the following phenotypes:Citation22 (1) metabolically healthy normal weight (MH-NW); (2) metabolically healthy overweight (MH-OW); (3) metabolically healthy obesity (MHO); (4) metabolically unhealthy normal weight (MU-NW); (5) metabolically unhealthy overweight (MU-OW); and (6) metabolically unhealthy obesity (MUO).
Diabetes was defined according to the diagnostic criteria of the WHO:Citation23–Citation25 an FPG level ≥ 7.0mmol/L (126mg/dl) and/or a 2hPG value ≥ 11.1mmol/L (200mg/dl) and/or an HbA1c ≥ 6.5%.
Statistical Analysis
We used mean±standard deviation(SD), median with inter quartile range, or numbers with percentages to present baseline characteristics of participants when appropriate. One-way analysis of variance, the Kruskal–Wallis tests for continuous variables or two-sided χ 2 tests for categorical variables were introduced for statistical evaluations of demographic and behavioral characteristics, as well as anthropometric and biochemical characteristics among the six BMI-metabolic status phenotypes at baseline. Bonferroni corrections were applied for multiple comparisons. Person-year was calculated from the baseline survey until participants were lost to follow-up or at the end of the follow-up period (August, 2020), and the incidence density of diabetes was calculated per 100 person-years. Given the correlations between repetitive observations at each follow-up examination in the longitudinal study, which violated independence assumptions required for traditional regression procedures,Citation26 and to increase the analytical power, robust generalized estimating equation (GEE) models with a binary distribution using a log link and exchange structure were applied for the pooled analysis sample. The correlation coefficients between two repetitive outcome measurements at each follow-up times were approximately equal (Supplementary Table S1). Risk ratios (RRs) and 95% confidence intervals (CIs) were adopted to estimate associations of BMI-metabolic status phenotypes with diabetes. We also carried out several analyses adjusted for potential confounding variables in multivariable models sequentially. Model a was adjusted for follow-up time, age, and gender. Model b was adjusted for follow-up time, demographic characteristics (age, gender, education level, drug history, history of chronic disease and family history of diabetes) and behavioral characteristics (smoking status, drinking status, and regular physical activity). Additionally, baseline characteristics were compared between participants in our cohort and those who were lost to follow-up (Supplementary Table S2). Sensitivity analyses were also undertaken to assess the stability and robustness of our findings. We re-ran the analysis for patients with unmodified BMI-metabolic status phenotype and we also excluded those with prediabetes who showed impaired fasting glycaemia (IFG) (6.1 mmol/L≤ FPG level<7.0 mmol/L and/or 2hFPG level<7.8 mmol/L) and impaired glucose tolerance (IGT) (FPG level<7.0 mmol/L and/or 7.8≤ 2hFPG level<11.1 mmol/L),Citation23 to examine whether the results were consistent. Stata software (version 15.1, College Station, Texas) was applied for all the statistical analyses, with two-sided P-values < 0.05 indicating the statistical significance level.
Results
Baseline Characteristics and Incidence Density of Diabetes
Of 4195 participants invited to join the cohort, 3641 (86.79%) were included in our final analyses. Hence, a total sample of 9623 observations (April to July, 2017: n = 3641; July to August, 2018: n = 3007; July to August, 2020: n = 2975) were pooled for the longitudinal data analysis (). Briefly, the mean (SD) age of the total 3641 individuals was 51.61 (8.75) years at study entry. The distribution of ATP III criteria for metabolic status between metabolic healthy and unhealthy was present in Supplementary Figure S2. The prevalence of MH-NW, MH-OW, MHO, MU-NW, MU-OW and MUO was 28.56%, 23.21%, 5.36%, 6.95%, 21.51% and 14.42% at baseline, respectively. The baseline demographic and behavioral characteristics, as well as anthropometric and biochemical characteristics, were compared among six BMI-metabolic status phenotypes and summarized in . There were significant differences detected for age, gender, drug history, history of chronic disease, drinking status and regular physical activity among different phenotypes (P < 0.05). Additionally, education level, family history of diabetes and smoking status were comparable (P > 0.05). The MH-OW, MHO, MU-NW, MU-OW and MUO phenotypes showed significantly higher values of all the anthropometric characteristics than MH-NW (). In terms of biochemical characteristics, there were significant differences among different phenotypes (P < 0.01) ().
Table 1 Baseline Characteristics of the Body Mass Index-Metabolic Status Phenotypes
The cohort with an average follow-up time of 1.64 years per person included 3641 participants and a total of 5982 person-years. During the follow-up period, 415 cases of new-onset diabetes occurred and the overall incidence density was 6.94% person-years. Among the six BMI-status phenotypes defined at baseline, MUO showed the highest incidence density of DM (12.08% person-years) at the end of follow-up (). The incidence density of DM increased with the BMI-metabolic status phenotypes transformation to metabolically unhealthy and greater BMI (Z=5.84, P trend < 0.001) ().
Table 2 Diabetes Incidence Density at the End of Follow-Up (Until August, 2020) Among Six Body Mass Index-Metabolic Status Phenotypes at Baseline
Association Between BMI-Metabolic Status Phenotypes and Diabetes
In the GEE model, associations of ATP III components, BMI categories and metabolic status with incident DM were analyzed and presented respectively in . All ATP III components were significantly associated with incident DM except LDL-C. Associations were detected between the number of metabolic unhealthy components found in an individual and DM (; Supplementary Figure S3). The RR for DM risk gradually increased with the increase in the number of components when compared with participants without any metabolically unhealthy components (P trend < 0.001) ().
Table 3 The Association of Body Mass Index, Metabolic Status and Adult Treatment Panel III Components with Diabetes
Compared with those of normal weight, only the obese group (Adjusted RR = 1.70; 95% CI=1.33–2.17; P < 0.001) presented an increased risk of DM. The metabolically unhealthy group showed an increased risk of incident DM when compared with metabolically healthy individuals (Adjusted RR = 2.48; 95% CI = 2.06–2.98; P < 0.001). Interaction analysis showed that BMI interacted multiplicatively with metabolic status to contribute to DM risk (P interaction = 0.015) ().
Interaction analyses failed to detect any significant association between BMI-metabolic status phenotypes and follow-up time (P interaction = 0.649). As is shown in , GEE analyses were further performed to detect the associations between BMI-metabolic status phenotypes and DM risk. It revealed that the MH-OW group were at a decreased risk of incident DM (Adjusted RR = 0.65; 95% CI = 0.47–0.90; P = 0.009) and no significant associations were found for MHO (Adjusted RR = 0.99; 95% CI = 0.63–1.53; P = 0.949) individuals when compared with the MH-NW phenotype. However, the MU-NW (Adjusted RR = 1.81; 95% CI = 1.28–2.55; P = 0.001), MU-OW (Adjusted RR = 2.02; 95% CI = 1.57–2.61; P < 0.001) and MUO phenotypes (Adjusted RR = 2.48; 95% CI = 1.89–3.26; P < 0.001) were associated with increased DM risk in comparison with MH-NW, among which the MUO phenotype showed the highest RR (P trend < 0.001) ().
Table 4 The Association Between Body Mass Index-Metabolic Status Phenotypes and Diabetes
Risk of Diabetes Stratified by Age and Gender
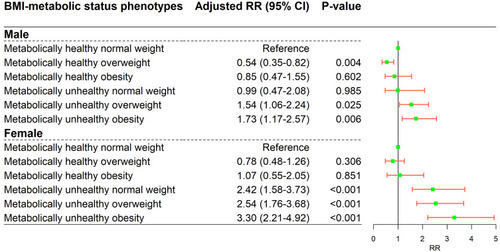
In the stratified analyses, associations between BMI-metabolic phenotypes and DM risk were evaluated based on age and gender, separately. As is shown in , only MU-OW (Adjusted RR = 2.11; 95% CI = 1.20–3.73; P = 0.010) and MUO (Adjusted RR = 2.37; 95% CI = 1.34–4.18; P = 0.003) phenotypes showed an increased diabetes risk in comparison with MH-NW among those individuals with age < 50 years. Those in the MU-NW (Adjusted RR = 2.12; 95% CI = 1.32–3.42; P = 0.002) MU-OW (Adjusted RR = 2.01; 95% CI = 1.35–2.99; P = 0.001) and MUO (Adjusted RR = 3.04; 95% CI = 2.02–4.56; P < 0.001) groups seemed more likely to suffer DM across all phenotypes among individuals aged 50 to 59 years. For the age groups ≥ 60, similar results were found to those for the main analysis of the total sample and no significant association was detected for the MU-NW phenotype (; Supplementary Table S3). For male participants, MH-OW (Adjusted RR = 0.54; 95% CI = 0.35–0.82; P = 0.004) presented a decreased risk of DM compared with MH-NW, while, only the MU-OW (Adjusted RR = 1.54; 95% CI = 1.06–2.24; P = 0.025) and MUO (Adjusted RR = 1.73; 95% CI = 1.17–2.57; P = 0.006) phenotypes showed increased risk. Meanwhile, the associations of MU-NW, MU-OW and MUO with DM risk were more evident in female individuals (P < 0.001) (; Supplementary Table S4).
Figure 2 The association of body mass index-metabolic status phenotypes with diabetes in an analysis stratified by age. Adjusted for follow-up time, demographic characteristics (gender, education level, drug history, history of chronic disease and family history of diabetes) and behavioral characteristics (smoking status, drinking status, regular physical activity).
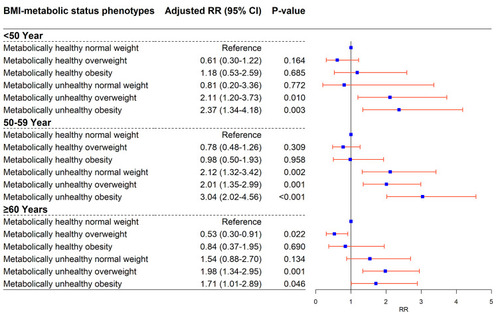
Figure 3 The association of body mass index-metabolic status phenotypes with diabetes in an analysis stratified by gender. Adjusted for follow-up time, demographic characteristics (age (numeric), education level, drug history, history of chronic disease and family history of diabetes) and behavioral characteristics (smoking status, drinking status, regular physical activity).
Sensitivity Analysis
A series of sensitivity analyses were undertaken to examine the robustness of our findings. The results of the analysis in patients with unmodified BMI-metabolic status phenotype were similar to the main results except that it failed to detect the association between MH-OW and DM risk (Supplementary Table S5). After removing participants with IFG/IGT, the results of sensitivity analysis were consistent with those outcomes reported in the main analysis (Supplementary Table S6). We also conducted sensitivity analyses of stratification based on age and gender, and the results did not essentially change (Supplementary Tables S7–S10).
Furthermore, comparison of baseline characteristics was also carried out between the participants who were included in the analytic sample and those excluded because of loss to follow-up (Supplementary Table S2). No statistically significant difference was detected for the distribution of BMI-metabolic status phenotypes at baseline between the study population and individuals who were lost to follow-up (P > 0.05) (Supplementary Table S2).
Discussion
Diabetes is a serious, long-term condition, which is considered as burdensome and costly disease.Citation2 An epidemiological study reveals that 11% of Chinese people have suffered from DM, with a significant proportion remaining undiagnosed.Citation5 As a result, the challenges for developing integrated care for DM and its complications are numerous in China.Citation27 Hence, we should put emphasis on early screening of the high-risk population in the prevention of diabetes. In addition, obesity is expanding worldwide, and it has also become a major public health problem in China.Citation28–Citation30 A previous study suggested that obesity is a condition which is related to multiple medical, psychological and social problems, and the most harmful could be DM.Citation31 Considering that DM risk might vary among obese sub-phenotypes,Citation28 stratification of obesity could be used to identify and target people at risk effectively, aiming at efficient distribution of limited financial resources. However, current guidelines for obesity management are not adequately supported by evidence from clinical studies among Chinese populations.Citation32 In our study, we evaluated the effect of metabolic health status and obesity phenotypes on the DM risk in the Chinese population. MU-NW, MU-OW and MUO individuals were at increased risk for DM, in contrast to MH-OW and MHO phenotypes. As far as we know, this is the first study to use a GEE model, which took repeated data obtained at each follow-up in a longitudinal study into consideration, to examine the effect of metabolic health alongside obesity phenotypes on DM risk in the Chinese population.
The associations of obese phenotypes and DM risk have been evaluated by several studies, but the results remain controversial.Citation13,Citation15,Citation33 Until now, available studies have focused on prospective or retrospective cohort studies, analyzing MHO phenotype and DM by applying a logistic regression model or Cox proportional hazards regression model,Citation13,Citation14 which only take the baseline information into consideration and cannot take advantage of the data from repetitive measurements at each follow-up to analyze changes in each variable. In addition, previous studies put emphasis on MHO; the diabetes risk, especially among MH-OW, MU-NW, MU-OW and MUO phenotypes in comparison with MH-NW, remains less examined, especially for the Chinese population. Recently, a study conducted by Barkas et al aimed to investigate the relationship between MHO and T2DM risk in statin-treated patients and suggested that the MHO phenotype might not significantly increase the T2DM risk and that the metabolically unhealthy non-obese presented an increased risk,Citation13 which were similar to the findings in our study. However, their study focused on statin-treated patients and set non-obesity as comparison. In our study, the participants were from a community-based prospective cohort study and the categories of BMI-metabolic status phenotypes were explicit and appropriate to detect the association. A study carried out by Wang et al without a 2-h OGTT test suggested that significantly increased risk of DM was detected for all the individuals with baseline MHO, MU-NW, and MUO phenotypes, which was not consistent with our findings. No significant association was found between MHO and DM risk in our study.Citation15 A recent network meta-analysis suggested that MUO groups posed the highest risk for diabetes and MH-OW/ MHO/ MU-NW/ MU-OW individuals also showed increased risk when compared with MH-NW,Citation34 presenting partially similar results to our study. Taken together, the inconsistency of studies mainly concentrates on the MHO/MH-OW phenotypes. Therefore, the possible reasons for controversy may be as follows: First, ethnicity and population were diverse. Second, in our study, MH-NW was set as the comparison when exploring the effect of BMI-metabolic status phenotypes on DM risk instead of using overweight and normal weight group as a combination. Third, the criteria of BMI were inconsistent with our study and inappropriate for the Chinese population. At present, the BMI ranges recommend by WHO are mainly suitable for the Western populations, among which the BMI range of 25–29.9 kg/m2 was defined as overweight and BMI≥30 kg/m2 as obesity. Moreover, the BMI criteria proposed by scientists in Asian countries (overweight: 23–24.9 kg/m2; obesity: ≥ 25 kg/m2) are also inappropriate for the Chinese population, because the Asian criteria did not include the data from mainland China and Taiwan China.Citation18,Citation35 It is important and necessary to define the optimal range for overweight and obesity in DM prevention among the Chinese population.Citation18 Thus, the definition of BMI in our study was in accordance with the criteria of The Working Group on Obesity in China.Citation18
MHO is a novel concept obtained by stratifying individuals with obesity according to metabolic status.Citation7,Citation36 The findings of our study highlighted the effect of metabolic health status in predicting incident DM, as decreased risk was found for MH-OW and no significant association was detected for MHO phenotype. Moreover, metabolic abnormalities may play a much more important role in developing DM rather than exclusively BMI, as MU-NW, MU-OW and MUO all posed increased risk in our study. Interestingly, our study also showed that only in the older groups (more than 60 years) can the MH-OW phenotype be significantly associated with decreased risk of DM. A study suggested that obesity might not be diabetogenic, and not all metabolically healthy individuals with obesity were at the same risk of diabetes onset.Citation34 It has been proposed that adipose tissue as an endocrine organ produces different adipocytokines, which could be associated with wide range of metabolic diseases.Citation37 Therefore, the diagnosis of “obesity phenotypes” should remain an indication to initiate prevention, even though the individuals with certain phenotypes without DM at the time of diagnosis.Citation7 In recent years, studies have explored the effectiveness of weight loss by stratifying individuals according to obesity phenotypes.Citation38,Citation39 A previous study also suggested that MHO individuals could not benefit to the same extent as those with unhealthy obesity from interventions involving losing weight.Citation7 Given the frequently unsuccessful anti-obesity interventions and limitations of healthcare resources,Citation7,Citation9 it is a challenge of clinical practice to identify which individuals with obesity may be able to benefit the most from interventions, especially for the prevention of DM. Nevertheless, current guidelines recommended for weight loss are aimed at all obesity with no distinction according to BMI-metabolic status phenotypes.Citation32 Notably, DM poses a huge health burden on China, and the substantial increase of diabetes-related burden shows an uninterrupted challenge as well.Citation40 Therefore, novel strategies for targeted DM prevention need to be developed. Given that the prevalence of obesity continues to escalate, a strategy based on different obese phenotypes is imperative to enhance the efficacy and effectiveness of the prevention of DM,Citation36 with promising methods to prioritize and identify the “high-risk” individuals who could benefit greatly and be the most suitable for intervention. It is worth mentioning that the MUO phenotype presented the highest risk, and needs to be accorded much more importance. Our findings highlighted the MU-OW and MU-NW phenotypes are also important groups for targeted prevention.
Several merits of this study deserve to be pointed out. First, our findings were based on a longitudinal study, making full use of repeated measurement data obtained at each follow-up examinations, which clarified the time sequence of correlation and took the time-independent variables into account by using GEE models. Second, both demographic and behavioral characteristics were adjusted to minimize potential confounding. Sensitivity analyses also showed the consistency and robustness of the results. Third, it is an advantage in the delimitation of obesity phenotypes in our study that the focus on BMI criteria for the Chinese population and the use of ATP III criteria of metabolic status were much more stringent and clinically relevant for the Chinese population.
However, there are some limitations. First, potential bias could not be avoided in our study, because the information on behavioral characteristics, drug history, history of chronic disease and family history of DM was self-reported. Second, because of the lack of repetitive investigations on dietary habits and nutritional information during follow-up examinations, we have not adjusted for them in our present study. Additionally, lack of test item of insulin resistance is also a limitation. Moreover, the majority of participants in this study were rural inhabitants. Thus, it may not be representative of the general population of China, which limits the generalizability of our findings.
Conclusion
In summary, in the Chinese population, the MH-OW and MHO phenotypes did not show an increased risk of incident diabetes. MU-NW, MU-OW and MUO were found to show a significantly increased risk of DM. Future studies are needed to extend the findings and elucidate whether some BMI-metabolic status phenotypes can be targeted for optimizing prevention and therapeutic strategies to mitigate the obviously increased prevalence of DM.
Author Contributions
All authors made a significant contribution to the work reported, whether that is in the conception, study design, execution, acquisition of data, analysis and interpretation, or in all these areas; took part in drafting, revising or critically reviewing the article; gave final approval of the version to be published; have agreed on the journal to which the article has been submitted; and agree to be accountable for all aspects of the work.
Disclosure
All authors declared that they have no conflict of interests.
Additional information
Funding
References
- Williams R , Karuranga S , Malanda B , et al. Global and regional estimates and projections of diabetes-related health expenditure: results from the international diabetes federation diabetes atlas, 9th edition. Diabetes Res Clin Pract . 2020;162:108072. doi:10.1016/j.diabres.2020.108072 32061820
- Saeedi P , Petersohn I , Salpea P , et al. Global and regional diabetes prevalence estimates for 2019 and projections for 2030 and 2045: results from the international diabetes federation diabetes atlas, 9(th) edition. Diabetes Res Clin Pract . 2019;157:107843. doi:10.1016/j.diabres.2019.107843 31518657
- Petersmann A , Muller-Wieland D , Muller UA , et al. Definition, classification and diagnosis of diabetes mellitus. Exp Clin Endocrinol Diabetes . 2019;127(S 01):S1–S7. doi:10.1055/a-1018-9078 31860923
- Luo Z , Fabre G , Rodwin VG . Meeting the challenge of diabetes in China. Int J Health Policy Manag . 2020;9(2):47–52. doi:10.15171/ijhpm.2019.80 32124588
- Ma RCW . Epidemiology of diabetes and diabetic complications in China. Diabetologia . 2018;61(6):1249–1260. doi:10.1007/s00125-018-4557-7 29392352
- Zimmet P , Shi Z , El-Osta A , Ji L . Epidemic T2DM, early development and epigenetics: implications of the Chinese Famine. Nat Rev Endocrinol . 2018;14(12):738–746. doi:10.1038/s41574-018-0106-1 30310152
- Blüher M . Metabolically healthy obesity. Endocr Rev . 2020;41(3):405–420. doi:10.1210/endrev/bnaa004
- Malone JI , Hansen BC . Does obesity cause type 2 diabetes mellitus (T2DM)? Or is it the opposite? Pediatr Diabetes . 2019;20(1):5–9. doi:10.1111/pedi.12787 30311716
- Bluher M . Mechanisms in endocrinology: are metabolically healthy obese individuals really healthy? Eur J Endocrinol . 2014;171(6):R209–R219. doi:10.1530/EJE-14-0540 25012199
- Loos RJ . Integrating publicly available genome-wide association data to study the genetic basis of metabolically healthy obese and metabolically obese but normal-weight individuals. Diabetes . 2014;63(12):4004–4007. doi:10.2337/db14-1358 25414016
- Xie J , Zhang S , Yu X , et al. Association between liver enzymes with metabolically unhealthy obese phenotype. Lipids Health Dis . 2018;17(1):198. doi:10.1186/s12944-018-0847-9 30134916
- Cheng D , Zhao X , Yang S , Cui H , Wang G . Metabolomic signature between metabolically healthy overweight/obese and metabolically unhealthy overweight/obese: a systematic review. Diabetes Metab Syndr Obes . 2021;14:991–1010. doi:10.2147/DMSO.S294894 33692630
- Barkas F , Liamis G , Elisaf M , Anastasiou G , Liberopoulos E . Metabolically healthy obesity and risk of incident type 2 diabetes in 1077 statin-treated individuals: a six-year retrospective study. Eur J Prev Cardiol . 2020;27(19):2341–2344. doi:10.1177/2047487319899191 31964182
- Hinnouho GM , Czernichow S , Dugravot A , et al. Metabolically healthy obesity and the risk of cardiovascular disease and type 2 diabetes: the Whitehall II cohort study. Eur Heart J . 2015;36(9):551–559. doi:10.1093/eurheartj/ehu123 24670711
- Wang B , Zhang M , Wang S , et al. Dynamic status of metabolically healthy overweight/obesity and metabolically unhealthy and normal weight and the risk of type 2 diabetes mellitus: a cohort study of a rural adult Chinese population. Obes Res Clin Pract . 2018;12(1):61–71. doi:10.1016/j.orcp.2017.10.005 29100915
- Kim NH , Seo JA , Cho H , et al. Risk of the development of diabetes and cardiovascular disease in metabolically healthy obese people: the Korean Genome and Epidemiology Study. Medicine . 2016;95(15):e3384. doi:10.1097/MD.0000000000003384 27082607
- Smith GI , Mittendorfer B , Klein S . Metabolically healthy obesity: facts and fantasies. J Clin Invest . 2019;129(10):3978–3989. doi:10.1172/JCI129186 31524630
- Zhou BF . Predictive values of body mass index and waist circumference for risk factors of certain related diseases in Chinese adults–study on optimal cut-off points of body mass index and waist circumference in Chinese adults. Biomed Environ Sci . 2002;15(1):83–96.12046553
- World Health Organization. Waist Circumference and Waist-hip Ratio: Report of a WHO Expert Consultation . Vol. 2011. Geneva; 12 8–11, 2008.
- Zhao L , Li Y , Peng Y , Zhang L , Guo M , Wu Y . The cut-off value of waist-to-height ratio in detecting central obesity in Chinese adult population. Chin J Prev Vet Med . 2012;13(7):481–485.
- Alberti KG , Eckel RH , Grundy SM , et al. Harmonizing the metabolic syndrome: a joint interim statement of the International Diabetes Federation Task Force on Epidemiology and Prevention; National Heart, Lung, and Blood Institute; American Heart Association; World Heart Federation; International Atherosclerosis Society; and International Association for the Study of Obesity. Circulation . 2009;120(16):1640–1645. doi:10.1161/CIRCULATIONAHA.109.192644 19805654
- Mongraw-Chaffin M , Foster MC , Anderson CAM , et al. Metabolically healthy Obesity, Transition to Metabolic Syndrome, and Cardiovascular Risk. J Am Coll Cardiol . 2018;71(17):1857–1865. doi:10.1016/j.jacc.2018.02.055 29699611
- Alberti KG , Zimmet PZ . Definition, diagnosis and classification of diabetes mellitus and its complications. Part 1: diagnosis and classification of diabetes mellitus provisional report of a WHO consultation. Diabet Med . 1998;15(7):539–553. doi:10.1002/(SICI)1096-9136(199807)15:7<539::AID-DIA668>3.0.CO;2-S 9686693
- World Health Organization. Definition and Diagnosis of Diabetes Mellitus and Intermediate Hyperglycaemia: Report of a WHO/IDF Consultation ; 2006.
- World Health Organization. Use of glycated haemoglobin (HbA1c) in diagnosis of diabetes mellitus: abbreviated report of a WHO consultation; 2011. Available from: http://who.int/diabetes/publications/report–hbalc–2011.Pdf. Accessed 7 7, 2021.
- Hubbard AE , Ahern J , Fleischer NL , et al. To GEE or not to GEE: comparing population average and mixed models for estimating the associations between neighborhood risk factors and health. Epidemiology . 2010;21(4):467–474. doi:10.1097/EDE.0b013e3181caeb90 20220526
- Mao W , Yip CW , Chen W . Complications of diabetes in China: health system and economic implications. BMC Public Health . 2019;19(1):269. doi:10.1186/s12889-019-6569-8 30841928
- Liu C , Wang C , Guan S , et al. The prevalence of metabolically healthy and unhealthy obesity according to different criteria. Obes Facts . 2019;12(1):78–90. doi:10.1159/000495852 30814477
- Bluher M . Obesity: global epidemiology and pathogenesis. Nat Rev Endocrinol . 2019;15(5):288–298. doi:10.1038/s41574-019-0176-8 30814686
- Pan XF , Wang L , Pan A . Epidemiology and determinants of obesity in China. Lancet Diabetes Endocrinol . 2021;9(6):373–392. doi:10.1016/S2213-8587(21)00045-0 34022156
- Kumar S , Behl T , Sachdeva M , et al. Implicating the effect of ketogenic diet as a preventive measure to obesity and diabetes mellitus. Life Sci . 2021;264:118661. doi:10.1016/j.lfs.2020.118661 33121986
- Zeng Q , Li N , Pan XF , Chen L , Pan A . Clinical management and treatment of obesity in China. Lancet Diabetes Endocrinol . 2021;9(6):393–405. doi:10.1016/S2213-8587(21)00047-4 34022157
- Luo D , Liu F , Li X , et al. Comparison of the effect of “metabolically healthy but obese” and “metabolically abnormal but not obese” phenotypes on development of diabetes and cardiovascular disease in Chinese. Endocrine . 2015;49(1):130–138. doi:10.1007/s12020-014-0444-2 25312689
- Tajik S , Mirzababaei A , Ghaedi E , Kord-Varkaneh H , Mirzaei K . Risk of type 2 diabetes in metabolically healthy people in different categories of body mass index: an updated network meta-analysis of prospective cohort studies. J Cardiovasc Thorac Res . 2019;11(4):254–263. doi:10.15171/jcvtr.2019.43 31824606
- Obesity: preventing and managing the global epidemic. Report of a WHO consultation. World Health Organ Tech Rep Ser . 2000;894:i–xii, 1–253.
- Beh S . Is metabolically healthy obesity a useful concept? Diabet Med . 2019;36(5):539–545. doi:10.1111/dme.13869 30474298
- Torres-Castillo N , Campos-Perez W , Rodriguez-Echevarria R , Rodriguez-Reyes SC , Martinez-Lopez E , Metabolically Unhealthy A . Phenotype is associated with ADIPOQ genetic variants and lower serum adiponectin levels. Lifestyle Genom . 2020;13(6):172–179. doi:10.1159/000510021 33137807
- Naja F , Itani L , Nasrallah MP , Chami H , Tamim H , Nasreddine L . A healthy lifestyle pattern is associated with a metabolically healthy phenotype in overweight and obese adults: a cross-sectional study. Eur J Nutr . 2020;59(5):2145–2158. doi:10.1007/s00394-019-02063-9 31363827
- Verboven K , Hansen D . Critical reappraisal of the role and importance of exercise intervention in the treatment of obesity in adults. Sports Med . 2021;51:379–389. doi:10.1007/s40279-020-01392-8 33332014
- Liu M , Liu SW , Wang LJ , et al. Burden of diabetes, hyperglycaemia in China from to 2016: findings from the 1990 to 2016, global burden of disease study. Diabetes Metab . 2019;45(3):286–293. doi:10.1016/j.diabet.2018.08.008 30196138