
Abstract
Background and Objective
Evidence suggests that cardiometabolic index (CMI) has been identified as a novel obesity-related index associated with diabetes, hypertension, and cardiovascular disease. Current evidence suggests that the differences in sex hormones and regional fat distribution in both sexes are directly correlated with metabolic dysfunction-associated fatty liver disease (MAFLD) risk. This study aimed to investigate the diagnostic value of CMI in MAFLD in both sexes.
Methods
This retrospective study included 6107 subjects who underwent annual health check-ups from March 2021 to January 2022. CMI was calculated by multiplying the ratio of triglycerides and high-density lipoprotein cholesterol (TG/HDL-C) by waist-to-height ratio (WHtR). Multivariable logistic regression analysis and restricted cubic spline were used to investigate the association of CMI and MAFLD risk. Receiver operating characteristic curve analysis was conducted for the exploration of the diagnostic accuracies of obesity-related indicators. Areas under the curves (AUCs) with 95% CIs were calculated.
Results
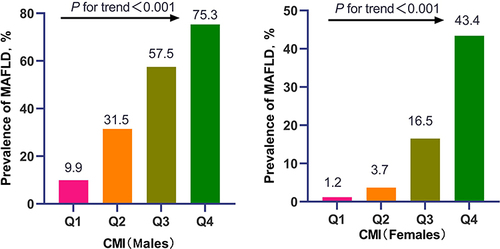
Prevalence of MAFLD increased with elevated quartiles of CMI in both sexes. The median (IQR) age was 46.00 (18.00) years. Multivariate logistic regression analyses showed that higher CMI was independently associated with MAFLD, in which every additional standard deviation (SD) of CMI increased the risk of MAFLD (OR=2.72, 95% CI:2.35–3.15 for males; OR=3.26, 95% CI:2.36–4.51 for females). Subjects in the fourth quartile of CMI had the highest odds of MAFLD for males (OR=15.82, 95% CI:11.84–21.14) and females (OR=22.60, 95% CI:9.52–53.65)(all P for trend<0.001). Besides, CMI had a non-linearity association with MAFLD (all P for non-linearity<0.001). Furthermore, CMI exhibited the largest AUC compared to other obesity-related indexes in terms of discriminating MAFLD in males (AUC=0.796, 95% CI:0.782–0.810) and females (AUC=0.853, 95% CI:0.834–0.872).
Conclusion
CMI was a convenient indicator for the screening of MAFLD among Chinese adults. Females with high CMI had a better diagnostic value for MAFLD than males.
Introduction
Recent research has proposed the term Metabolic Dysfunction-Associated Fatty Liver Disease (MAFLD) to better reflect the current understanding of fatty liver disease associated with metabolic dysfunction.Citation1,Citation2 MAFLD is a diagnosis that is based on the presence of hepatic steatosis and the coexistence of a set of metabolic risk factors.Citation3 This new term is thought to identify individuals who are at a higher risk of developing hepatic and extrahepatic complications than those with non-alcoholic fatty liver disease (NAFLD).Citation4–6 It is estimated that MAFLD affects a quarter of the world’s adult population, creating a large burden for individuals, families, and healthcare systems.Citation7,Citation8 Progression of MAFLD can lead to steatohepatitis, cirrhosis, and hepatocellular carcinomaCitation9–11 as well as other metabolic dysfunctions such as insulin resistance, diabetes, dyslipidemia, chronic kidney disease, cardiovascular and cerebrovascular diseases.Citation12–15
Diagnosis of hepatic steatosis is a challenge due to the limitations of the available methods. Liver biopsy is considered the “gold standard” but is not widely used due to its invasive nature, high cost, and poor patient compliance. Ultrasound is the most commonly used method, but its sensitivity for mild steatosis is low and can be affected by the equipment and operator. Computed tomography (CT) has good diagnostic sensitivity, but its use is limited by radiation exposure. Magnetic resonance imaging (MRI) is noninvasive, precise, and reproducible, but it is more expensive and has lower specificity.Citation8,Citation16,Citation17 Therefore, it is essential to identify and diagnose MAFLD simply and effectively to prevent and delay its progression and related complications.
It has been well-established that there is a link between dyslipidemia, obesity, and fatty liver disease.Citation18,Citation19 The triglyceride/high-density lipoprotein cholesterol (TG/HDL-C) ratio is regarded as a reliable predictor of the risk of nonalcoholic fatty liver disease (NAFLD), as it can indicate insulin resistance (IR) in those with NAFLD.Citation20–22 The waist-to-height ratio (WHtR) is a combination of waist circumference (WC) and height, and is considered to be more effective than traditional body measurements in identifying abdominal obesity, assessing MAFLD, and predicting cardiac metabolic risks and a range of other non-communicable diseases.Citation23–26 Wakabayashi et al developed a marker called cardiometabolic index (CMI), which is calculated as WHtR multiplied by TG/HDL-C ratio, and combines lipid and obesity parameters into one simple and repeatable marker for the effective identification of diabetes.Citation27,Citation28 Studies have also shown that CMI is significantly associated with hypertension, stroke, cardiovascular disease, and kidney disease.Citation29–32 This suggests that CMI is a valuable indicator of metabolic diseases. Additionally, there is potential for a sex-specific difference in CMI action, as the prevalence of MAFLD and CMI can vary between sexes. It has been observed in previous studies that higher CMI in the general population is independently associated with a higher risk of NAFLD in health check-up populations.Citation33,Citation34 Nevertheless, there is yet to be research done on the potential relationship between CMI and MAFLD risk.
Therefore, this research aimed to explore the correlation between CMI and MAFLD, and evaluate the predictive value of CMI for MAFLD in different genders, to give a theoretical foundation for the screening of MAFLD among a Chinese adult population.
Methods
Study Population
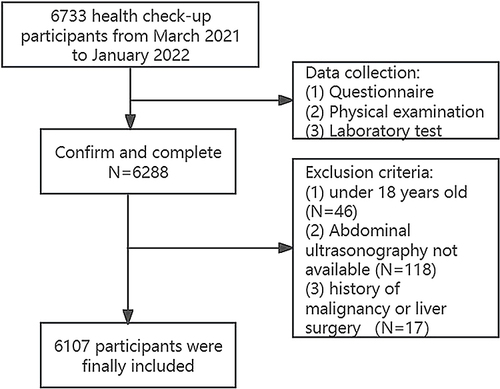
This retrospective study was conducted at the Health Examination Center of Huadong Sanatorium between March 2021 to January 2022. A total of 6733 participants were initially included, however, those with incomplete medical information, under the age of 18, or with a history of malignancy or liver surgery were excluded (). Consequently, this study included 6107 participants, with 3851 males and 2256 females, ranging in age from 18 to 91 (the median age being 46.45 and IQR 18 years). Demographic data such as age, gender, and cigarette/alcohol use were collected. Smoking was defined as smoking three or more cigarettes daily in a year, and alcohol consumption was defined as at least three times a week for at least twelve months.
Figure 1 Flowchart of participants excluded and included in this study.
This retrospective study, conducted in accordance with the Declaration of Helsinki, was granted approval by the Health Examination Center of Huadong sanatorium Ethics and Research Committee (approval number. 2023–10). To protect the privacy of the patients, their personal details were anonymized. Our ethics committee waived the requirement for informed consent for this study due to its retrospective nature and the fact that the data analysis was anonymous and confidential. Statistical analysis was conducted solely for academic purposes.
Clinical Data and Biochemical Indicators
Diabetes mellitus was defined as fasting blood glucose≥126 mg/dL or currently receiving antidiabetic medication therapy,Citation35 while hypertension was defined as systolic blood pressure≥140mmHg or diastolic blood pressure≥90mmHg, or receiving anti-hypertension treatment at present.Citation36 Dyslipidemia was defined as two or more of these four criteria: fasting serum triglyceride ≥1.70 mmol/L, TC≥5.20 mmol/L, LDL cholesterol ≥3.4 mmol/L, or HDL cholesterol≤ 0.91 mmol/L.Citation37
Blood samples (10–15mL) were taken from the antecubital vein of participants after a 12-hour fast. The serum was left at room temperature for 30 minutes and then centrifuged at 3000 rpm for 10 minutes. The serum was analyzed within 1 hour of collection to measure Fasting Plasma Glucose (FPG), Triglycerides (TG), Total Cholesterol (TC), Low-Density-Lipoprotein Cholesterol (LDL-C), High-Density-Lipoprotein Cholesterol (HDL-C), Serum Aspartate Aminotransferase (AST), Alanine Aminotransferase (ALT), White Blood Cells (WBC), Neutrophils (NE) and Lymphocytes (LY). All blood samples were tested within 24 hours in the Medical Laboratory Center of Huadong sanatorium.
Assessment of CMI
To calculate the TG/HDL-C ratio, the serum concentration of TG (in mmol/L) was divided by HDL-C, and WHtR was computed by dividing WC (in cm) by height (in cm). The CMI was then obtained by multiplying TG/HDL-C and WHtR, as per the published formula.Citation27
Definition of MAFLD
MAFLD was identified when hepatic steatosis was present, and at least one of the following criteria:Citation1 being overweight or obese (BMI≥23 kg/m2), having type 2 diabetes mellitus, or exhibiting metabolic dysregulation. Metabolic dysregulation was defined by the occurrence of at least two of the following risks for metabolic disorders: ①waist circumference≥90/80 cm in Asian men and women; ②blood pressure ≥130/85 mmHg or specific drug treatment for controlling blood pressure; ③plasma triglyceride≥1.7 mmol/L or specific drug treatment; ④plasma high-density lipoprotein cholesterol < 1.0 mmol/L for men and < 1.3 mmol/L for women or specific drug treatment; ⑤prediabetes with fasting glucose levels between 5.6 to 6.9 mmol/L; ⑥homeostasis model assessment of insulin resistance (HOMA-IR) score ≥2.5; ⑦Plasma high sensitivity C-reactive protein (CRP) level >2 mg/L.
After 12 hours of fasting, abdominal high-resolution ultrasonography (SIMENS ACUSON S2000 ABVS) was used to measure hepatic steatosis. Experienced radiologists conducted the ultrasonography and identified the condition based on the following ultrasound images: diffusely increased near field echo of the liver (“bright liver”), a larger echo of the liver than that of the kidney or spleen, vascular blurring, and poor visibility of the posterior right lobe due to deep attenuation.
Statistical Analysis
All statistical analyses were performed using SPSS 26.0 software and RStudio version 4.0.1. Continuous variables are reported as mean ± SD or median with interquartile range according to the evaluation of the normal distribution by the Kolmogorov–Smirnov test, and categorical variables are presented as the numbers(n) with percentages (%). Comparisons of baseline characteristics and laboratory parameters specified by gender among two groups were conducted using the Student’s t-test or Mann–Whitney U-test for continuous variables, and the chi-square test for categorical variables as appropriate. Besides, the chi-square test or one-way ANOVA, or Kruskal–Wallis H-test were used for inter-group comparison stratified by CMI quartiles. Univariable correlations between variables were assessed using Pearson’s correlation coefficients and presented by heatmap. A restricted cubic spline model was performed to estimate the association between CMI and MAFLD in a fully adjusted model. The knots were located at the 5th, 35th, 65th, and 95th percentiles. Additionally, a multivariable regression model was used to evaluate the relationship between CMI and MAFLD by gender, adjusting for potential confounders. Model 1 adjusted age, smoking, drinking, WC, BMI, WHtR, diabetes, hypertension and dyslipidemia. Model 2 adjusted Model 1 plus AST, ALT, WBC, NE and LY. Adjusted odds ratios (ORs) were presented with 95% confidence interval (CI). P for trend was evaluated for linear trend test using the median value of CMI as a continuous variable in the adjusted models. Receiver operating characteristic (ROC) curves were then generated to obtain the values of the area under the curve (AUC), with sensitivity, specificity, and 95% CI for each obesity-related indexes as a predictor of MAFLD. A two-tailed P-value <0.05 was considered statistically significant.
Results
Baseline Characteristics of Participants
In total, 6107 eligible participants were included in the study, comprising 3851 males and 2256 females (). 43.5% of males (1676/3851) and 16.2% of females (366/2256) were diagnosed with MAFLD. Subjects with MAFLD showed significantly higher age, waist circumference, BMI, WHtR, systolic and diastolic blood pressure, fasting blood glucose, triglycerides, total cholesterol, LDL-C, AST, ALT, WBC, NE, and LY, as well as a higher prevalence of diabetes, hypertension, and dyslipidemia, compared to non-MAFLD subjects (all P-values <0.001). In addition, MAFLD subjects in the male group had a significantly higher proportion of smokers than non-MAFLD subjects. Furthermore, MAFLD prevalence increased with increasing quartiles of CMI in both males and females (all P for trend <0.001) (). Additionally, as shown in , regardless of sex, compared to subjects in the low quartile of CMI group, those in the high quartiles of CMI group had advanced age, increased waist circumference, BMI, WHtR, fasting blood glucose, triglycerides, AST, ALT, WBC, NE, and LY, with a greater proportion of diabetes, hypertension, and dyslipidemia (all P for trend <0.001). Moreover, males in the higher quartile of CMI had an increased proportion of current smokers and drinkers (P for trend <0.001), while HDL-C significantly decreased with the elevated quartile of CMI in females (P for trend = 0.017).
Table 1 Baseline Characteristics of the Study Population According to Sex (n=6107)
Table 2 Baseline Characteristics of the Study Population by CMI Quartiles According to Sex (n=6107)
Figure 2 Prevalence of MAFLD according to CMI quartile by sex.
Correlation Analysis Between Baseline Variables and CMI
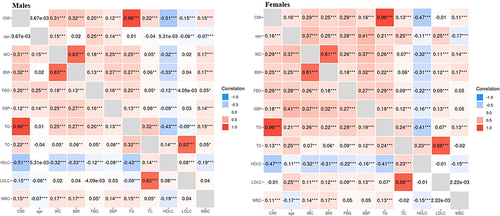
Pearson’s correlation coefficients were used to assess the correlation between CMI and baseline variables, disregarding sex (). All the baseline variables, except age, had a significant correlation with CMI, with HDL-C and LDL-C having a negative relationship and the other variables having a positive correlation (all P-value<0.001). Notably, TG had the strongest correlation with CMI, and can be considered as a reliable indicator in diagnosing MAFLD.
Figure 3 The heatmap of the correlation between baseline variables and CMI using the Pearson’s correlation analysis among by sex. *P<0.05;**P<0.01;***P<0.001.
Dose-Response Relationship Between CMI and MAFLD by Sex
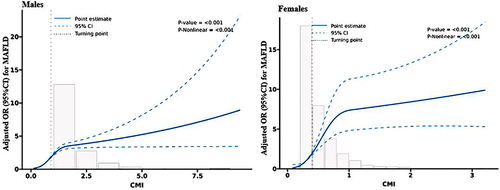
displays the relationship between CMI and MAFLD risk in all participants. The horizontal line shows the 5th, 35th, 65th, and 95th percentiles of CMI, while the blue line represents the multivariable-adjusted ORs for MAFLD with knots located at the 5th, 35th, 65th, and 95th percentiles of CMI. Analysis showed a non-linear correlation between CMI and MAFLD risk (all P for non-linearity < 0.001). Multivariable adjusted restricted cubic spline analysis revealed that increased CMI values significantly increased MAFLD risk when CMI was above its median.
Figure 4 Restricted cubic spline of the association between CMI and MAFLD risk by sex. The association was adjusted for age, smoking, drinking, WC, BMI, WHtR, diabetes, hypertension, dyslipidemia, AST, ALT, WBC, NE and LY. The medians CMI of males (0.9) and females (0.4) were chosen as a reference. The plot showed an increased risk of MAFLD with the elevated CMI, which were above the medians of CMI.
Multivariate Logistic Regression Assessing CMI on the Risk of MAFLD
In multivariate logistic regression analyses, CMI expressed as either continuous variables or quartiles, significantly associated with MAFLD in all models (). After adjusting for potential confounding factors, the ORs (95% CI) for per SD increase of CMI were 2.72 (2.35–3.15) for males and 3.26 (2.36–4.51) for females (all P-value<0.001). Upon dividing CMI into quartiles, its association with MAFLD risk remained statistically significant, subjects in the highest quartile of CMI exhibited a 15.82-fold (95% CI:11.84–21.14) MAFLD risk in males and 22.60-fold (95% CI:9.52–53.65) MAFLD risk in females. Furthermore, all participants tended to have increased odds of developing MAFLD with an elevated quartile of CMI (all P for trend<0.001).
Table 3 Adjusted Associations Between CMI Quartiles and MAFLD Risk by Gender
Diagnostic Capacity of Obesity-Related Indices and TG in Predicting MAFLD
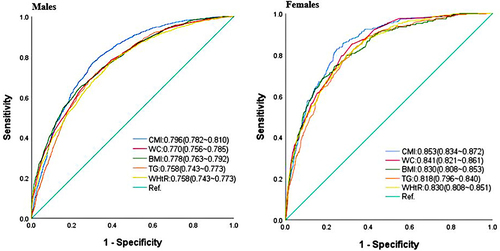
The ROC curves and optimal cutoff points of obesity-related indices and TG were plotted in and to predict MAFLD based on sex. In males, the highest AUC was displayed by CMI (0.796, 95% CI: 0.782–0.810), followed by WC (0.770, 95% CI: 0.756–0.785), BMI (0.778, 95% CI: 0.763–0.792), TG (0.758, 95% CI: 0.743–0.773), and WHtR (0.758, 95% CI: 0.743–0.773). Similarly, in females, CMI had the highest AUC (0.853, 95% CI: 0.834–0.872), followed by WC (0.841, 95% CI: 0.821–0.861), BMI (0.830, 95% CI: 0.808–0.853), TG (0.818, 95% CI: 0.796–0.840), and WHtR (0.830, 95% CI: 0.808–0.851). It is noteworthy that, in both sexes, CMI was more accurate than other obesity-related indexes and TG in distinguishing MAFLD
Table 4 AUCs of Various Indexes for Discriminating MAFLD by Sex
Figure 5 ROC curve comparison of obesity-related indices and TG in predicting MAFLD by sex.
Discussion
This retrospective study based on the general population aimed to explore the relationship between CMI and MAFLD in both sexes. The results of the multivariate regression analysis revealed that individuals with high CMI had a significantly increased risk of MAFLD. Moreover, CMI was found to be the most reliable predictor of MAFLD in both sexes, compared to obesity-related indicators and TG.
Recent research has indicated that MAFLD, a 2020 redefinition of NAFLD, is more than just a name change.Citation38 Our study found that the metabolic indicators, such as serum FBG, HDL-C, LDL-C, TC, TG, ALT, AST and CMI, of subjects in the MAFLD group were higher than those in the control group. A separate study of adults over 40 years old with MAFLD revealed that metabolic disorders were more pronounced.Citation39 It is believed that hepatic steatosis, a systemic metabolic disorder, is caused by increased lipid acquisition and/or decreased lipid metabolism.Citation40 This leads to lipids being transported to various organs of the body, resulting in visceral obesity and abnormalities in various metabolic-related indicators.Citation41
A recent cross-sectional study involving 3239 females investigated the association between various blood lipid-related indexes in predicting NAFLD. The results showed that the area under the curve (AUC) of CMI was significantly higher than the other indexes, including triglyceride glucose index (TyG), TG/HDL-C, TC/HDL-C, and LDL-C/HDL-C. This suggests that CMI could be a recommended index in the screening of NAFLD in women, as it is useful for detecting populations that are at high risk of NAFLD.Citation34 Additionally, another study explored the association of lipid accumulation product (LAP) and CMI with the NAFLD risk, and found that these indexes are convenient for the screening and quantification of NAFLD among Chinese adults, with a greater association with NAFLD in women than in men.Citation33
Our study found that a higher CMI quartile was markedly and independently correlated with an enhanced MAFLD risk in both males and females. The CMI, a newly developed index based on TG/HDL-C and WHtR values,Citation27 has been related to obesity-related metabolic diseases such as cardiovascular disease and chronic conditions like diabetes and hypertension.Citation30,Citation31 WHtR is a measure of abdominal obesity that is associated with lipid content and distribution, and is more effective than WC and BMI in evaluating fatty liver disease.Citation42 Studies have also shown that TG/HDL-C is closely related to insulin resistance, obesity, and metabolic disorders, and can be used to predict NAFLD.Citation20,Citation43,Citation44 Abdominal obesity can lead to high levels of glucose and lipid oxidation, resulting in an accumulation of fatty acids in the liver.Citation45,Citation46 Insulin resistance can also increase the secretion of VLDL and TG, while reducing HDL-C levels.Citation47,Citation48 Furthermore, insulin resistance can promote the development of NAFLD by decomposing TG in adipose tissue and enhancing TG synthesis in the liver.Citation49,Citation50 ROC analyses have indicated that CMI has a satisfactory diagnostic performance.
The ROC analysis showed that CMI was more effective in identifying MAFLD among females than males. This is in line with a study in China that suggested CMI as a reliable indicator for screening women for NAFLD.Citation34 It is reasonable to assume that CMI’s performance may be affected by age, as metabolism, body composition, and coexisting diseases change with age.Citation51–53 As for gender differences, this may be due to the difference in fatty acid accumulation and metabolism, as females tend to have more visceral lipolysis and fatty acid delivery to visceral fat than males.Citation54 Additionally, the different hormones between the sexes may affect fat distribution, which in turn affects the relationship between CMI and MAFLD.Citation55
This study had several noteworthy limitations. This single-center study and cross-sectional design only enabled us to observe the correlation between CMI and MAFLD; consequently, longitudinal studies in multiple centers are essential to explore the causal relationship. Additionally, as the participants were recruited from a health check-up population in China, these findings may not be applicable to other racial or ethnic groups. Furthermore, due to the lack of parameters necessary to calculate the score of liver fibrosis, it was not possible to analyze the relationship between CMI and fibrosis. Lastly, even though the current study took measures to identify confounders, there may still be residual unmeasurable or unreported confounding variables, such as diet patterns and regular exercise.
Conclusion
This study delved into the correlation between CMI and MALFD and established that CMI had a superior predictive power for MAFLD, particularly in females. Moreover, the best cutoff values of CMI for predicting MAFLD in both genders were determined and demonstrated excellent diagnostic accuracy for MALFD. CMI, which is composed of traditional blood lipid indexes and anthropometric indexes, is advantageous as it is easy to obtain, inexpensive, and has high diagnostic accuracy. Therefore, CMI is clinically beneficial for early identification of MAFLD and is worthy of clinical utilization.
Data Sharing Statement
The datasets used and/or analyzed during the current study are available from the corresponding author (Baiqing Xu, Email: [email protected]) upon reasonable request.
Author Contributions
All authors made a significant contribution to the work reported, whether that is in the conception, study design, execution, acquisition of data, analysis and interpretation, or in all these areas; took part in drafting, revising or critically reviewing the article; gave final approval of the version to be published; have agreed on the journal to which the article has been submitted; and agree to be accountable for all aspects of the work.
Disclosure
The authors declare no potential competing interests in this work.
Acknowledgments
We also thank all staff involved in this study for their painstaking efforts in conducting the data collection.
Additional information
Funding
References
- Eslam M, Newsome PN, Sarin SK, et al. A new definition for metabolic dysfunction-associated fatty liver disease: an international expert consensus statementJ. J Hepatol. 2020;73(1):202–209. doi:10.1016/j.jhep.2020.03.039
- Eslam M, Sanyal AJ, George J. MAFLD: a consensus-driven proposed nomenclature for metabolic associated fatty liver disease. Gastroenterology. 2020;158(7):1999–2014. doi:10.1053/j.gastro.2019.11.312
- Eslam M, Sarin SK, Wong VW, et al. The Asian Pacific Association for the study of the liver clinical practice guidelines for the diagnosis and management of metabolic associated fatty liver disease. Hepatol Int. 2020;14(6):889–919. doi:10.1007/s12072-020-10094-2
- Yamamura S, Eslam M, Kawaguchi T, et al. MAFLD identifies patients with significant hepatic fibrosis better than NAFLD. Liver Int. 2020;40(12):3018–3030. doi:10.1111/liv.14675
- Lin S, Huang J, Wang M, et al. Comparison of MAFLD and NAFLD diagnostic criteria in real world. Liver Int. 2020;40(9):2082–2089. doi:10.1111/liv.14548
- Lee H, Lee YH, Kim SU, et al. Metabolic dysfunction-associated fatty liver disease and incident cardiovascular disease risk: a nationwide cohort study. Clin Gastroenterol Hepatol. 2021;19(10):2138–2147. doi:10.1016/j.cgh.2020.12.022
- Younossi Z, Anstee QM, Marietti M, et al. Global burden of NAFLD and NASH: trends, predictions, risk factors and prevention. Nat Rev Gastroenterol Hepatol. 2018;15(1):11–20. doi:10.1038/nrgastro.2017.109
- Sarin SK, Kumar M, Eslam M, et al. Liver diseases in the Asia-Pacific region: a lancet gastroenterology & hepatology commission. Lancet Gastroenterol Hepatol. 2020;5(2):167–228. doi:10.1016/S2468-1253(19)30342-5
- Kleiner DE, Brunt EM, Wilson LA, et al. Association of histologic disease activity with progression of nonalcoholic fatty liver disease. JAMA Netw Open. 2019;2(10):e1912565. doi:10.1001/jamanetworkopen.2019.12565
- Vilar-Gomez E, Calzadilla-Bertot L, Wai-Sun WV, et al. Fibrosis severity as a determinant of cause-specific mortality in patients with advanced nonalcoholic fatty liver disease: a multi-national cohort study. Gastroenterology. 2018;155(2):443–457. doi:10.1053/j.gastro.2018.04.034
- Gutiérrez-Cuevas J, Lucano-Landeros S, López-Cifuentes D, et al. Epidemiologic, genetic, pathogenic, metabolic, epigenetic aspects involved in NASH-HCC: current therapeutic Strategies. Cancers. 2022;15(1). doi:10.3390/cancers15010023
- Sun D-Q, Jin Y, Wang T-Y, et al. MAFLD and risk of CKD. Metabolism. 2021;115:154433. doi:10.1016/j.metabol.2020.154433
- Drozdz K, Nabrdalik K, Hajzler W, et al. Metabolic-Associated Fatty Liver Disease (MAFLD), diabetes, and cardiovascular disease: associations with fructose metabolism and gut microbiota. Nutrients. 2021;14(1):103. doi:10.3390/nu14010103
- Heeren J, Scheja L. Metabolic-associated fatty liver disease and lipoprotein metabolism. Mol Metab. 2021;50:101238. doi:10.1016/j.molmet.2021.101238
- Gutiérrez-Cuevas J, Santos A, Armendariz-Borunda J. Pathophysiological molecular mechanisms of obesity: a link between MAFLD and NASH with cardiovascular diseases. Int J Mol Sci. 2021;22(21). doi:10.3390/ijms222111629
- Moura CG, Navin PJ, Fowler KJ, et al. Quantitative magnetic resonance imaging for chronic liver disease. Br J Radiol. 2021;94(1121):20201377. doi:10.1259/bjr.20201377
- Cho CS, Curran S, Schwartz LH, et al. Preoperative radiographic assessment of hepatic steatosis with histologic correlation. J Am Coll Surg. 2008;206(3):480–488. doi:10.1016/j.jamcollsurg.2007.08.020
- Katsiki N, Mikhailidis DP, Mantzoros CS. Non-alcoholic fatty liver disease and dyslipidemia: an update. Metabolism. 2016;65(8):1109–1123. doi:10.1016/j.metabol.2016.05.003
- Milic S, Lulic D, Stimac D. Non-alcoholic fatty liver disease and obesity: biochemical, metabolic and clinical presentations. World J Gastroenterol. 2014;20(28):9330–9337. doi:10.3748/wjg.v20.i28.9330
- Fan N, Peng L, Xia Z, et al. Triglycerides to high-density lipoprotein cholesterol ratio as a surrogate for nonalcoholic fatty liver disease: a cross-sectional study. Lipids Health Dis. 2019;18(1):39. doi:10.1186/s12944-019-0986-7
- Fukuda Y, Hashimoto Y, Hamaguchi M, et al. Triglycerides to high-density lipoprotein cholesterol ratio is an independent predictor of incident fatty liver; a population-based cohort study. Liver Int. 2016;36(5):713–720. doi:10.1111/liv.12977
- Kim-Dorner SJ, Deuster PA, Zeno SA, et al. Should triglycerides and the triglycerides to high-density lipoprotein cholesterol ratio be used as surrogates for insulin resistance? Metabolism. 2010;59(2):299–304. doi:10.1016/j.metabol.2009.07.027
- Tomas Z, Skaric-Juric T, Zajc PM, et al. Waist to height ratio is the anthropometric index that most appropriately mirrors the lifestyle and psychological risk factors of obesity. Nutr Diet. 2019;76(5):539–545. doi:10.1111/1747-0080.12520
- Ashwell M, Gunn P, Gibson S. Waist-to-height ratio is a better screening tool than waist circumference and BMI for adult cardiometabolic risk factors: systematic review and meta-analysis. Obes Rev. 2012;13(3):275–286. doi:10.1111/j.1467-789X.2011.00952.x
- Correa MM, Thume E, De Oliveira ER, et al. Performance of the waist-to-height ratio in identifying obesity and predicting non-communicable diseases in the elderly population: a systematic literature review. Arch Gerontol Geriatr. 2016;65:174–182. doi:10.1016/j.archger.2016.03.021
- Sheng G, Xie Q, Wang R, et al. Waist-to-height ratio and non-alcoholic fatty liver disease in adults. BMC Gastroenterol. 2021;21(1):239. doi:10.1186/s12876-021-01824-3
- Wakabayashi I, Daimon T. The “cardiometabolic index” as a new marker determined by adiposity and blood lipids for discrimination of diabetes mellitus. Clin Chim Acta. 2015;438:274–278. doi:10.1016/j.cca.2014.08.042
- Shi WR, Wang HY, Chen S, et al. Estimate of prevalent diabetes from cardiometabolic index in general Chinese population: a community-based study. Lipids Health Dis. 2018;17(1):236. doi:10.1186/s12944-018-0886-2
- Dursun M, Besiroglu H, Otunctemur A, et al. Association between cardiometabolic index and erectile dysfunction: a new index for predicting cardiovascular disease. Kaohsiung J Med Sci. 2016;32(12):620–623. doi:10.1016/j.kjms.2016.10.003
- Wang H, Chen Y, Guo X, et al. Usefulness of cardiometabolic index for the estimation of ischemic stroke risk among general population in rural China. Postgrad Med. 2017;129(8):834–841. doi:10.1080/00325481.2017.1375714
- Wang H, Chen Y, Sun G, et al. Validity of cardiometabolic index, lipid accumulation product, and body adiposity index in predicting the risk of hypertension in Chinese population. Postgrad Med. 2018;130(3):325–333. doi:10.1080/00325481.2018.1444901
- Wang HY, Shi WR, Yi X, et al. Value of reduced glomerular filtration rate assessment with cardiometabolic index: insights from a population-based Chinese cohort. BMC Nephrol. 2018;19(1):294. doi:10.1186/s12882-018-1098-8
- Zou J, Xiong H, Zhang H, et al. Association between the cardiometabolic index and non-alcoholic fatty liver disease: insights from a general population. BMC Gastroenterol. 2022;22(1):20. doi:10.1186/s12876-022-02099-y
- Wang J, Su Z, Feng Y, et al. Comparison of several blood lipid-related indexes in the screening of non-alcoholic fatty liver disease in women: a cross-sectional study in the Pearl River Delta region of southern China. BMC Gastroenterol. 2021;21(1):482. doi:10.1186/s12876-021-02072-1
- Jia W, Weng J, Zhu D, et al. Standards of medical care for type 2 diabetes in China 2019. Diabetes Metab Res Rev. 2019;35(6):e3158. doi:10.1002/dmrr.3158
- Chen Y, Hu S, Wu L, et al. Clinical practice guidelines for hypertension in China: a systematic review of the methodological quality. BMJ Open. 2015;5(7):e8099. doi:10.1136/bmjopen-2015-008099
- Vekic J, Zeljkovic A, Stefanovic A, et al. Obesity and dyslipidemia. Metabolism. 2019;92:71–81. doi:10.1016/j.metabol.2018.11.005
- Eslam M, Ratziu V, George J. Yet more evidence that MAFLD is more than a name change. J Hepatol. 2021;74(4):977–979. doi:10.1016/j.jhep.2020.12.025
- Zeng J, Qin L, Jin Q, et al. Prevalence and characteristics of MAFLD in Chinese adults aged 40 years or older: a community-based study. Hepatobiliary Pancreat Dis Int. 2022;21(2):154–161. doi:10.1016/j.hbpd.2022.01.006
- Ipsen DH, Lykkesfeldt J, Tveden-Nyborg P. Molecular mechanisms of hepatic lipid accumulation in non-alcoholic fatty liver disease. Cell Mol Life Sci. 2018;75(18):3313–3327. doi:10.1007/s00018-018-2860-6
- Mundi MS, Velapati S, Patel J, et al. Evolution of NAFLD and Its Management. Nutr Clin Pract. 2020;35(1):72–84. doi:10.1002/ncp.10449
- Lin IT, Lee MY, Wang CW, et al. Gender differences in the relationships among metabolic syndrome and various obesity-related indices with nonalcoholic fatty liver disease in a Taiwanese population. Int J Environ Res Public Health. 2021;18(3). doi:10.3390/ijerph18030857
- Yang Y, Wang B, Yuan H, et al. Triglycerides to high-density lipoprotein cholesterol ratio is the best surrogate marker for insulin resistance in nonobese middle-aged and elderly population: a cross-sectional study. Int J Endocrinol. 2021;2021:6676569. doi:10.1155/2021/6676569
- Quispe R, Martin SS, Jones SR. Triglycerides to high-density lipoprotein-cholesterol ratio, glycemic control and cardiovascular risk in obese patients with type 2 diabetes. Curr Opin Endocrinol Diabetes Obes. 2016;23(2):150–156. doi:10.1097/MED.0000000000000241
- Xin Y, Wang Y, Chi J, et al. Elevated free fatty acid level is associated with insulin-resistant state in nondiabetic Chinese people. Diabetes Metab Syndr Obes. 2019;12:139–147. doi:10.2147/DMSO.S186505
- Medina-Urrutia A, Posadas-Romero C, Posadas-Sanchez R, et al. Role of adiponectin and free fatty acids on the association between abdominal visceral fat and insulin resistance. Cardiovasc Diabetol. 2015;14:20. doi:10.1186/s12933-015-0184-5
- Sparks JD, Sparks CE, Adeli K. Selective hepatic insulin resistance, VLDL overproduction, and hypertriglyceridemia. Arterioscler Thromb Vasc Biol. 2012;32(9):2104–2112. doi:10.1161/ATVBAHA.111.241463
- Choi SH, Ginsberg HN. Increased very low density lipoprotein (VLDL) secretion, hepatic steatosis, and insulin resistance. Trends Endocrinol Metab. 2011;22(9):353–363. doi:10.1016/j.tem.2011.04.007
- Zhang S, Du T, Zhang J, et al. The triglyceride and glucose index (TyG) is an effective biomarker to identify nonalcoholic fatty liver disease. Lipids Health Dis. 2017;16(1):15. doi:10.1186/s12944-017-0409-6
- Berk PD, Verna EC. Nonalcoholic fatty liver disease: lipids and insulin resistance. Clin Liver Dis. 2016;20(2):245–262. doi:10.1016/j.cld.2015.10.007
- Smith HJ, Sharma A, Mair WB. Metabolic communication and healthy aging: where should we focus our energy? Dev Cell. 2020;54(2):196–211. doi:10.1016/j.devcel.2020.06.011
- JafariNasabian P, Inglis JE, Reilly W, et al. Aging human body: changes in bone, muscle and body fat with consequent changes in nutrient intake. J Endocrinol. 2017;234(1):R37–R51. doi:10.1530/JOE-16-0603
- Correa-Rodriguez M, Gonzalez-Jimenez E, Fernandez-Aparicio A, et al. Dietary energy density is associated with body mass index and fat mass in early adulthood. Clin Nurs Res. 2021;30(5):591–598. doi:10.1177/1054773819883192
- Meredith-Jones K, Taylor R, Brown R, et al. Age- and sex-specific visceral fat reference cutoffs and their association with cardio-metabolic risk. Int J Obes. 2021;45(4):808–817. doi:10.1038/s41366-021-00743-3
- Pasquali R, Oriolo C. Obesity and androgens in women. Front Horm Res. 2019;53:120–134. doi:10.1159/000494908