Abstract
Objectives
To determine cutoff values for body mass index (BMI), waist circumference (WC), waist-to-hip ratio (WHR), and waist-to-height ratio (WHtR) as indicators of metabolic abnormalities in the adult Jordanian population.
Methods
A structured questionnaire was administered to collect relevant information. Anthropometric measurements and biochemical measurements were carried out. Receiver-operating characteristic curve analyses were used to examine the overall discriminatory power of the four anthropometric indices.
Results
WC cutoff values varied from 88.5 to 91.8 cm in men and from 84.5 to 88.5 cm in women. The BMI cutoff values varied from 26.2 to 27.2 kg/m2 in men and from 27.2 to 30.0 kg/m2 in women. The WHR cutoff values varied from 0.88 to 0.90 in men and from 80.0 to 0.83 in women. The WHtR cutoff values varied from 0.50 to 0.51 in men and women. Of all anthropometric indices, WHtR had the strongest association with each metabolic abnormality in men and women.
Conclusion
BMI, WC, WHR, and WHtR were found to be associated with cardiovascular disease risk factors, with WHtR being the better predictor. We recommend that health care professionals use WHtR, with a cutoff value of 0.5 for screening and counseling Jordanian people.
Introduction
Anthropometric indices, including body mass index (BMI), waist circumference (WC), waist-to-hip ratio (WHR), and waist-to-height ratio (WHtR), are all useful for providing important information on cardiovascular disease (CVD) risk, and have been shown to be associated with CVD risk factors, including hypertension, dyslipidemia, and diabetes.Citation1–Citation3 Body mass index (BMI) is a simple measure of body size and is the most widely used method to estimate the prevalence of obesity in a population. Nevertheless, it is a crude index that does not take into account the distribution of body fat. On the other hand, WC, WHR, and WHtR are used as a surrogate for body fat centralization.Citation4,Citation5
The best index of obesity that is predictive for CVD risk remains controversial. Some studies have found that total body fat or BMI, rather than distribution of body fat, is the stronger predictor of metabolic risk.Citation6,Citation7 Other studies have reported that body fat distribution is a more powerful predictor than BMI for CVD risk factors, diseases, and mortality.Citation8–Citation10 Abdominal fat accumulation, as measured by WC or WHR, has been shown to be associated with metabolic and CVD risk, type 2 diabetes mellitus, hypertension, coronary artery disease, and stroke,Citation8,Citation9,Citation11–Citation13 and a stronger association was found with abdominal adiposity than with overall adiposity as measured by BMI.Citation14–Citation17
WC is a good simple anthropometric index of abdominal visceral adipose tissue,Citation5 and is increasingly being accepted as the best anthropometric indicator of metabolic and cardiovascular risk.Citation3,Citation19,Citation20 Because the WC measurement has been criticized for not taking into account differences in body height, the WHtR value is suggested as an alternative.Citation1,Citation2,Citation21
The anthropometric-metabolic risk relationship is influenced by age, gender, and ethnic differences. The predictive power of some anthropometric indices is population-dependentCitation22 and is likely to be different in different ethnic groups.Citation23–Citation27 Because populations may differ in the level of risk associated with a particular anthropometric measure, establishing gender- and ethnicity-specific cutoffs is necessary and should be based on their relationship with obesity-related CVD risk factors. The International Diabetes Federation has suggested a redefinition of the metabolic syndrome using WCs adapted for different ethnic groups,Citation28 and recommends the use of European cutoff values for WC measurements in people from Middle East Arab populations until more ethnic-specific data are available. In this study, we aimed to determine cutoff values of BMI, WC, WHR, and WHtR as indicators of metabolic abnormalities in the adult Jordanian population and determine their associations with the presence of metabolic abnormalities.
Materials and methods
Sampling
A national population-based household sample was selected from the 12 governorates of Jordan. A complex multistage sampling technique was used to select the households, taking into consideration the geographic distribution of the population as well as urban-rural residence. Because the population is covered by an extensive network of health centers and because the study procedures have to take place in a medical setting, the selection of households was health center-oriented. The health director in each governorate was contacted and asked to identify at least two health centers in which to conduct the study procedures. He was asked to select the health centers so that urban and rural areas in each governorate were represented and the selected centers had enough space to host the study team, participants, and equipment. A total of 31 health centers were identified, and people served by these centers were targeted. A systematic sample of households was selected from the population served by the selected health centers. The number of selected households was approximately proportional to the population in each region.
In each selected area, one day before data collection, two-membered teams (a male and a female each) visited the selected households, explained the purpose of the study, and invited all members aged older than seven years to attend the health centers on the day after an overnight fast. Subjects on regular medications were asked not to take their medications early on that day and to bring all their medications with them to the survey site. The present report deals exclusively with 4590 adults aged over 18 years who responded and agreed to participate in this study.
Data collection
All field work was carried out between July 1st and November 30, 2009. Participants attended the health centers in the morning (8–11 am), with a minimum fasting time of 10 hours. A pilot-tested structured questionnaire was prepared and administered by trained interviewers to collect the relevant information necessary to answer the current research question and other selected research questions that will be addressed in future publications. The questionnaire sought information on demographics, medical history, and medication use.
Measurements and laboratory analysis
Anthropometric measurements, including weight, height, hip, and WC were measured with the subjects wearing light clothing and no shoes according to the World Health Organization report.Citation29 WC was measured to the nearest centimeter using a nonstretchable tailors’ measuring tape at the midpoint between the bottom of the rib cage and above the top of the iliac crest during minimal respiration. Hip circumference was measured at the widest part of the body below the waist. Waist and hip circumferences were measured using a circumference measuring tape (Seca 200, Hamburg, Germany). BMI was calculated as the ratio of weight in kilograms to the square of height in meters. Readings of systolic and diastolic blood pressure were taken with the subject seated and the arm at heart level, after at least five minutes of rest, using a standardized mercury sphygmomanometer.Citation30
For laboratory analysis and all biochemical measurements, two sets of fasting blood samples were drawn from a cannula inserted in the antecubital vein and put into sodium fluoride potassium oxalate tubes for glucose and into lithium heparin vacuum tubes for lipids. Samples were centrifuged at 3000 rpm for 10 minutes within one hour at the survey site, and plasma was transferred to separate labeled tubes and transferred immediately in cold boxes filled with ice to the Central Laboratory of the National Center for Diabetes and Endocrinology. All biochemical measurements were carried out by the same team of laboratory technicians and using the same method throughout the study period.
Lipid parameters, ie, total cholesterol, high-density lipoprotein (HDL), low-density lipoprotein (LDL), and triglyceride (TG), and glucose were analyzed for all samples using enzymatic assays. Glucose levels were determined using the enzymatic reference method with hexokinase.Citation31 TG values were obtained using COBAS Integra 700 (Roche Diagnostics Ltd, Indianapolis, IN) with the cassette COBAS Integra TG (Roche Diagnostics Ltd) using an enzymatic colorimetric method with glycerol phosphate oxidase and 4-aminophenazone.Citation32 Total cholesterol was analyzed using an enzymatic colorimetric method with COBAS Integra Cholesterol Gen.2 (Roche Diagnostics Ltd). HDL and LDL values were obtained on COBAS Integra 700 using a homogeneous enzymatic colorimetric assay.Citation33,Citation34 The assays were conducted according to the manufacturer’s instructions.
Definition of variables
Metabolic abnormalities were defined according to the International Diabetes Federation definition,Citation28 as follows: elevated TG level ≥ 150 mg/dL (1.7 mmol/L), or specific treatment for this lipid abnormality; low HDL cholesterol < 40 mg/dL (1.03 mmol/L) in males and <50 mg/dL (1.29 mmol/L) in females, or specific treatment for this lipid abnormality; high blood pressure, ie, systolic blood pressure ≥ 130 mmHg or diastolic blood pressure ≥ 85 mmHg, or treatment of previously diagnosed hypertension; high fasting plasma glucose ≥ 100 mg/dL (5.6 mmol/L), or previously diagnosed type 2 diabetes.
Statistical analysis
Data were analyzed using the Statistical Package for Social Sciences software (version 15; SPSS Inc., Chicago, IL). The distributions of continuous anthropometric and clinical variables were checked by plotting histograms and tested using the Shapiro–Wilk W test. The assumption of normality was met for all studied variables. Means and standard deviations were used to describe continuous variables. The differences in anthropometric and clinical characteristics between men and women were analyzed using the Student’s t-test. The data analysis was performed in men and women separately. Receiver-operating characteristic (ROC) curve analysesCitation35 were used to examine the overall discriminatory power, sensitivity and specificity, and corresponding cutoff points of each of the four anthropometric indices for each metabolic abnormality. The overall performance of each anthropometric test for detecting individual metabolic abnormalities was assessed by computing the area under the curve (AUC). For each metabolic abnormality, the AUCs for all anthropometric indices were compared and tested for significant differences using MedCalc version 11.3. (MedCalc Software, Mariakerke, Belgium). The best cutoff points for each anthropometric index were determined at the point on the curve where the sum of sensitivity and specificity was highest. Age-adjusted partial correlation analyses were performed to quantify the independent associations between anthropometric indices. Each anthropometric index was dichotomized for each metabolic abnormality based on the cutoff values established in this study. Multivariate logistic regression analyses were performed to evaluate the associations between the anthropometric indices and individual metabolic abnormalities after adjusting for other variables including age, marital status, income, smoking, and physical activity. Backward stepwise logistic regression analysis was performed using metabolic abnormalities as dependent variables. Because the indices were intercorrelated, only one out of the four indices was introduced into the logistic regression equation at each analysis. A P value of less than 0.05 was considered statistically significant.
Results
A total of 4590 subjects (1128 men and 3462 women) aged over 18 years, with a mean age of 41.8 (13.4) years were included in this study. shows their anthropometric and clinical characteristics according to gender. There were significant differences in anthropometric and clinical parameters between men and women. Men had significantly higher mean weight, height, WC, WHR, WHtR, systolic blood pressure, diastolic blood pressure, fasting blood glucose, and TG levels than women. Other parameters were significantly higher for women compared with those for men. Men had significantly higher prevalence rates of high fasting blood glucose (34.4% versus 23.6%), high blood pressure (52.9% versus 36.6%), elevated TG (62.8% versus 44.1%), and low HDL (70.3% versus 64.2%) than women (see ). The age- and gender-adjusted rates for all metabolic abnormalities were higher for those living in urban areas compared with those living in rural areas.
Figure 1 Prevalence rates of metabolic abnormalities according to the International Diabetes Federation definition for men and women.
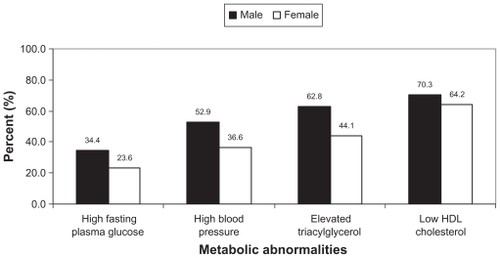
Table 1 Anthropometric and clinical characteristics of 4590 Jordanian adults (1128 men and 3462 women) aged over 18 years according to gender
According to age-adjusted partial correlations among the anthropometric indices, BMI, WC, and WHtR were moderately to strongly intercorrelated in men and women. BMI and WHR were weakly correlated, especially among women.
The calculated AUCs of anthropometric indices for distinguishing subjects with metabolic abnormalities are summarized in . For men, there was no significant difference in anthropometric indices to discriminate between subjects based on high blood pressure or low HDL. In regard to elevated TG level, WC and WHtR performed significantly better than BMI. All other indices performed better than BMI for detection of high fasting blood glucose. For women, all other indices performed better than WHR to detect high blood pressure and low HDL. BMI performed the worst to detect high fasting blood glucose. WHtR performed the best for detection of elevated TG levels.
Table 2 Calculated areas under the ROC curves and their 95% CI of anthropometric indices for detecting metabolic abnormalities
The anthropometric cutoff values for detecting each metabolic abnormality for men and women are shown in . The WC cutoff values varied according to metabolic abnormalities from 88.5 to 91.8 cm in men and from 84.5 to 88.5 cm in women. The BMI cutoff values varied from 26.2 to 27.2 kg/m2 in men and from 27.2 to 30.0 kg/m2 in women. The WHR cutoff values varied from 0.88 to 0.90 in men and from 80.0 to 0.83 in women. The WHtR cutoff values varied from 0.50 to 0.51 in men and women.
Table 3 Anthropometric parameters cutoff values for detecting high fasting blood glucose, high blood pressure, elevated triacylglycerol level, and low HDL for men and women
Anthropometric indices were tested separately in logistic regression models as main predictor variables for each outcome variable (). Significant associations were observed between each anthropometric parameter and all metabolic abnormalities. The strength of the association in the regression analysis varied according to gender, anthropometric index, and metabolic abnormality. Of all anthropometric indices, WHtR had the strongest association with each metabolic abnormality in men and women, being the strongest for elevated TG in men and high fasting blood glucose in women. For all logistic regression analyses, there were no significant interactions between anthropometric measures and age.
Table 4 Relationship between the four anthropometric indices with metabolic abnormalities in multivariate analysis
Discussion
Based on the AUC, the ability of anthropometric measures to identify subjects with metabolic abnormalities varied according to gender and according to the studied metabolic abnormality in men and women. The finding that none of the anthropometric measures appeared better than the others for detection of all or at least most of the studied metabolic abnormalities may be explained by the moderate-to-strong correlations between these anthropometric measures. When we compared anthropometric measures in regression analysis, the strength of the association varied according to gender, anthropometric index, and metabolic abnormality. In our study, women had higher BMI and lower WC than men. This finding is expected in our population because men are taller than women. Furthermore, BMI calculation is solely dependent on the net weight and height of the individual, and does not consider the distribution of muscle and bone mass. BMI also does not differentiate between body fat and muscle mass. This may result in misleading information with regard to the amount of fat in an individual. Of all anthropometric indices, WHtR had the strongest association with each metabolic abnormality in men and women. There were no significant interactions between anthropometric measures and age, suggesting that the associations did not vary substantially as a function of age and that the results can be generalized to Jordanian adults older than 18 years.
Previous studies have reached different conclusions about which anthropometric index is the best for detecting the risk of metabolic abnormalities. This could be related to the fact that the predictive power of each anthropometric index depends on the studied populationCitation22 and ethnicity.Citation4
Studies in some populations, including in Japan, Canada, and Australia,Citation36–Citation41 have reported WHR to be a better indicator of CVD risk than BMI. WHR has been shown to be a better predictor of coronary heart disease than WC and BMI in a prospective study of Finnish men aged 42–60 years.Citation42 Furthermore, WHR has been shown to predict CVD risk factors more accurately than BMI, but not WC, in a study of adult Canadian men.Citation43 WHR could provide useful clinical information to identify subjects with CVD risk factors because it reflects most of the lifestyle-related risk factors of an individual.Citation44
While some studies have shown WHtR to be a better predictor of CVD risk factors,Citation1–Citation3,Citation26,Citation35 other studies showed that WC is a better predictor of CVD risk factors.Citation5,Citation16 Studies in the US have reported that WC is a better predictor than WHR.Citation17,Citation23 On the other hand, some studies have reported that total fat and abdominal fat distribution play a similar role in cardiovascular disease,Citation46,Citation47 and other studies have found that total fat, rather than its distribution, is a more significant predictor of metabolic risk.Citation6,Citation7
The discrepancy in the findings of different studies may be explained by differences in study populations and ethnic groups. Furthermore, studies differed in the site of WC measurement. It has been reported that the ability of WC to predict CVD risk factors differs according to the site of waist measurement. In our study, we measured WC according to the World Health Organization recommendation, ie, at the midpoint between the lower border of the rib cage and the iliac crest.
Our results indicated that ranges of cutoff points for each of these anthropometric indices may be considered. Cutoff points were dependent on gender and metabolic abnormality. Lower cutoff points of BMI and higher cutoff points of WC and WHR were more appropriate for men. Cutoff points for WHtR in men were similar to those for women.
A number of different thresholds for anthropometric indices were suggested. The World Health Organization criteria (1999) defined central obesity as a WHR > 0.90 in males and > 0.85 in females, or BMI > 30 kg/m2.Citation48 According to World Health Organization recommendations, the BMI threshold for increasing disease risk in Caucasian populations is 25 kg/m2 for both men and women, and this value was suggested to be 23 kg/m2 in Asian men and women. The US National Cholesterol Education Program Adult Treatment Panel III (NCEP-ATP III) defined central obesity as WC ≥ 102 cm in males and ≥88 cm in females.Citation49 The 2005 International Diabetes Federation consensus definition of the metabolic syndrome used ethnic-specific cutpoints for waist circumference.Citation50 A WC cutoff of 80–85 cm for men and 75–80 cm for women of Korean or Asian–Pacific background was suggested.Citation3,Citation51 In other studies,Citation2,Citation52 a cutoff value of 0.5 for WHtR has been proposed as a boundary value.
For BMI, cutoff values varied from 26.2 to 27.2 kg/m2 in men and from 27.2 to 30.0 kg/m2 in women. The global standard of a BMI of 25 for measurement of overweight for both genders falls below these ranges. Values of WC fall into a wider range (from 88.5 to 91.8 cm in men and from 84.5 to 88.5 cm in women). For men, the upper limit in the range of WC for Jordanians is lower than the cutoff values defined by the NCEP-ATP III (102 cm) and the International Diabetes Federation 2005 recommendation (94 cm for European men). The International Diabetes Federation cutoff value defined for Asian men (90 cm) falls within the range of WC for Jordanian men. For women, the WC cutoff point of 88 cm is close to our upper limit of 88.5 cm. The cutoff values of WHR for men and women (from 0.88 to 0.90 in men and from 80.0 to 0.83 in women) were close to those defined by World Health Organization criteria. Furthermore, the cutoff values of WHtR (0.5 to 0.51 in men and women) were close to those defined by others.Citation2,Citation52
The finding that WC cutoff limits for the Jordanian population are lower than those for the Western population might be explained by ethnic differences in body composition and by the fact that race/ethnic groups often differ in socioeconomic status, cultural factors, diet, physical activity levels, and lifestyle. The choice of which to use could depend on other factors. In Jordan, one should consider that measuring hip circumference in community settings and in the clinic situation is difficult for cultural reasons. Furthermore, inaccurate measurements are expected when undertaken in fully clothed subjects.
The main limitation of this study was the use of cross-sectional data to compare the ability of anthropometric indices to detect CVD risk factors. Prospective studies are needed to provide stronger evidence on the predictive power of anthropometric measures. One of the strengths of this study is that we used a representative sample of Jordanian adults which enhances the validity of our findings.
In conclusion, BMI, WC, WHR, and WHtR were found to be associated with CVD risk factors, with WHtR being the better predictor. We recommend that health care professionals in Jordan use WHtR with a cutoff value of 0.5 for screening and counseling people who face higher metabolic risks during physical examinations for many reasons: the value of 0.5 offers a simple but effective index for identifying metabolic abnormalities, in that a single rule of “keeping WC below half of height” may be applied by health professionals to both men and women; closer agreement of values between men and women; comparing AUC for anthropometric indices with metabolic abnormalities, WHtR was either similar to or better than other anthropometric indices to detect metabolic abnormalities; in logistic regression, WHtR had the strongest association with all metabolic abnormalities in both genders; height is a component of this index and this is important because height may influence the observation of fat accumulation and/or distribution; and several reports have indicated that WHtR corresponds better with metabolic risk than other indices.
Acknowledgments
The authors acknowledge financial support from the Scientific Research Fund at the Ministry of Higher Education and Scientific Research, Jordan.
Disclosure
The authors report no conflicts of interest in this work.
References
- Hsieh SD Yoshinaga H Abdominal fat distribution and coronary heart disease risk factors in men – waist to height ratio as a simple and useful predictor Int J Obes Relat Metab Disord 1995 19 585 589 7489031
- Hsieh SD Yoshinaga H Waist to height ratio as a simple and useful predictor of coronary heart disease risk factors in women Intern Med 1995 34 1147 1152 8929639
- Ko GTC Chan JCN Woo J Simple anthropometric indexes and cardiovascular risk factors in Chinese Int J Obes Relat Metab Disord 1997 21 995 1001 9368822
- Gallagher D Visser M Sepulveda D Pierson RN Harris T Heymsfield SB How useful is body mass index for comparison of body fatness across age, sex, and ethnic groups? Am J Epidemiol 1996 143 228 239 8561156
- Pouliot MC Despres JP Lemieux S Waist circumference and abdominal sagittal diameter: Best simple anthropometric indexes of abdominal visceral adipose tissue accumulation and related cardiovascular risk in men and women Am J Cardiol 1994 73 460 468 8141087
- Mykkanen L Laakso M Pyorala K Association of obesity and distribution of obesity with glucose tolerance and cardiovascular risk factors in the elderly Int J Obes Relat Metab Disord 1992 16 695 704 1328093
- Spiegelman D Israel RG Bouchard C Willett WC Absolute fat mass, percent body fat, and body-fat distribution: Which is the real determinant of blood pressure and serum glucose? Am J Clin Nutr 1992 55 1033 1044 1595574
- Stevens J Keil JE Rust PF Tyroler HA Davis CE Gazes PC Body mass index and body girths as predictors of mortality in black and white women Arch Intern Med 1992 152 1257 1262 1599355
- Folsom AR Kaye SA Sellers TA Body fat distribution and 5-year risk of death in old women JAMA 1993 269 483 487 8419667
- Pi-Sunyer FX Obesity: Criteria and classification Proc Nutr Soc 2000 59 505 509 11115784
- Despres JP Moorjani S Lupien PJ Tremblay A Nadeau A Bouchard C Regional distribution of body fat, plasma lipoproteins, and cardiovascular disease Arteriosclerosis 1990 10 497 511 2196040
- Reeder BA Senthilselvan A Despres JP The association of cardiovascular disease risk factors with abdominal obesity in Canada CMAJ 1997 157 39 45 9220941
- Ducimetiere P Richard J Cambien F The pattern of subcutaneous fat distribution in middle-aged men and the risk of coronary heart disease: The Paris Prospective Study Int J Obes 1986 10 229 240 3759330
- Haffner S Mitchell B Stern M Hazuda H Patterson J Public health significance of upper body adiposity for non-insulin dependent diabetes mellitus in Mexican Americans Int J Obes Relat Metab Disord 1992 16 177 184 1317826
- Richelsen B Pedersen SB Associations between different anthropometric measurements of fatness and metabolic risk parameters in non-obese, healthy, middle-aged men Int J Obes Relat Metab Disord 1995 19 169 174 7780492
- Han T van Leer E Seidell J Lean M Waist circumference action levels in the identification of cardiovascular risk factors: Prevalence study in a random sample BMJ 1995 311 1401 1405 8520275
- Zhu S Wang Z Heshka S Heo M Faith MS Heymsfield SB Waist circumference and obesity-associated risk factors among whites in the third National Health and Nutrition Examination Survey: Clinical action thresholds Am J Clin Nutr 2002 76 743 749 12324286
- Despres JP Prud’homme D Pouliot MC Tremblay A Bouchard C Estimation of deep abdominal adipose-tissue accumulation from simple anthropometric measurements in men Am J Clin Nutr 1991 54 471 477 1877502
- World Health Organization Physical Status: The use and interpretation of anthropometry WHO Technical Report Series 854 Geneva, Switzerland World Health Organization 1995
- Lemos-Santos MG Valente JG Goncalves-Silva RM Sichieri R Waist circumference and waist-to-hip ratio as predictors of serum concentration of lipids in Brazilian men Nutrition 2004 20 857 862 15474872
- Ashwell M Lejeune S McPherson K Ratio of waist circumference to height may be better indicator of need for weight management BMJ 1996 312 377 8611847
- Molarius A Seidell JC Selection of anthropometric indicators for classification of abdominal fatness – a critical review Int J Obes Relat Metab Disord 1998 22 719 727 9725630
- Ko GT Tang J Chan JC Lower BMI cut-off value to define obesity in Hong Kong Chinese: An analysis based on body fat assessment by bioelectrical impedance Br J Nutr 2001 85 135 136 11280336
- Ko GTC Chan JCN Cockram CS Woo J Prediction of hypertension, diabetes, dyslipidaemia or albuminuria using simple anthropometric indexes in Hong Kong Chinese Int J Obes Relat Metab Disord 1999 23 1136 1142 10578203
- Molarius A Seidell JC Visscher TLS Hofman A Misclassification of high-risk older subjects using waist action levels established for young and middle-aged adults results from the Rotterdam Study J Am Geriatr Soc 2000 48 1638 1645 11129755
- Kubena KS McIntosh WA Georghiades MB Landmann WA Anthropometry and health in the elderly J Am Diet Assoc 1991 91 1402 1407 1939978
- Woo J Kwok T Lau E Li M Yu LM Body composition in Chinese subjects relationship with age and disease Arch Gerontol Geriatr 1997 26 23 32 18653123
- Alberti KG Zimmet P Shaw J IDF Epidemiology Task Force Consensus Group The metabolic syndrome – a new worldwide definition Lancet 2005 366 1059 1062 16182882
- World Health Organization Measuring Obesity Classification and description of anthropometric data Report on a WHO Consultation on the Epidemiology of Obesity WHO report EURICP=Nut 125 Copenhagen, Denmark World Health Organization 1987
- World Health Organization MONICA Manual Geneva, Switzerland World Health Organization 1990
- Neeley WE Simple automated determination of serum or plasma glucose by a hexokinase-glucose-6-phosphate dehydrogenase method Clin Chem 1972 18 509 515 5026763
- McGowan MW Artiss JD Strandbergh DR Zak B A peroxidase-coupled method for the colorimetric determination of serum triglycerides Clin Chem 1983 29 538 542 6825269
- Sugiuchi H Uji Y Okabe H Direct measurement of high-density lipoprotein cholesterol in serum with polyethylene glycol-modified enzymes and sulfated alpha-cyclodextrin Clin Chem 1995 41 717 723 7729051
- Sugiuchi H Irie T Uji Y Homogeneous assay for measuring low-density lipoprotein cholesterol in serum with triblock copolymer and alpha-cyclodextrin sulfate Clin Chem 1998 445 522 531 9510857
- van der Schouw YT Verbeek AL Ruijs JH ROC curves for the initial assessment of new diagnostic tests Fam Pract 1992 9 506 511 1490547
- Hartz A Grubb B Wild R The association of waist hip ratio and angiographically determined coronary artery disease Int J Obes Relat Metab Disord 1990 14 657 665
- Kissebah AH Krakower GR Regional adiposity and morbidity Physiol Rev 1994 74 761 811 7938225
- Kortelainen ML Sarkioja T Coronary atherosclerosis and myocardial hypertrophy in relation to body fat distribution in healthy women: An autopsy study on 33 violent deaths Int J Obes Relat Metab Disord 1994 21 43 49 9023600
- Kotchen JM Cox-Ganser J Wright CJ Kotchen TA Gender differences in obesity-related cardiovascular disease risk factors among participants in a weight loss program Int J Obes Relat Metab Disord 1993 17 145 151 8385074
- Ito H Nakasuga K Ohshima A Detection of cardiovascular risk factors by indices of obesity obtained from anthropometry and dual-energy X-ray absorptiometry in Japanese individuals Int J Obes Relat Metab Disord 2003 27 232 237 12587004
- Welborn TA Dhaliwal SS Bennett SA Waist-hip ratio is the dominant risk factor predicting cardiovascular death in Australia Med J Aust 2003 179 580 585 14636121
- Lakka HM Lakka TA Tuomilehto J Salonen JT Abdominal obesity is associated with increased risk of acute coronary events in men Eur Heart J 2002 23 706 713 11977996
- Dobbelsteyn CJ Joffres MR MacLean DR Flowerdew G the Canadian Heart Surveys Research Group A comparative evaluation of waist circumference, waist-to-hip ratio and body mass index as indicators of cardiovascular risk factors: The Canadian Heart Health Surveys Int J Obes Relat Metab Disord 2001 25 652 661 11360147
- Han TS Bijan FC Lean MEJ Seidell JC Separate associations of waist and hip circumference with lifestyle factors Int J Epidemiol 1998 27 422 430 9698130
- Rissanen P Hamalainen P Vanninen E Tenhunen-Eskelinen M Uusitupa M Relationship of metabolic variables to abdominal adiposity measures by different anthropometric measurements and dual-energy X-ray absorptiometry in obese middle-aged women Int J Obes Relat Metab Disord 1997 21 367 371 9152738
- Ledoux M Lambert J Reeder BA Despres JP Correlation between cardiovascular disease risk factors and simple anthropometric measures. Canadian Heart Health Surveys Research Group CMAJ 1997 157 46 53
- Lundgren H Bengtsson C Blohme G Lapidus L Sjostrom L Adiposity and adipose tissue distribution in relation to incidence of diabetes in women: Results from a prospective population study in Gothenburg, Sweden Int J Obes 1989 13 413 423 2793297
- World Health Organization Definition, Diagnosis and Classification of Diabetes Mellitus and its Complications Part 1: Diagnosis and classification of diabetes mellitus Provisional Report of a WHO Consultation Geneva, Switzerland World Health Organization 1999
- Expert Panel on Detection, Evaluation, and Treatment of High Blood Cholesterol in Adults Executive Summary of the Third Report of the National Cholesterol Education Program (NCEP) Expert Panel on Detection, Evaluation, and Treatment of High Blood Cholesterol in Adults (Adult Treatment Panel III) JAMA 2001 285 2486 2497 11368702
- The International Diabetes Federation The IDF consensus worldwide definition of the metabolic syndrome 2005 Available at: http://www.idf.org/webdata/docs/MetSyndrome_FINAL.pdf Accessed on 2010 Oct 26
- Zhou BF Predictive values of body mass index and waist circumference for risk factors of certain related diseases in Chinese adults: Study on cut-off points of body mass index and waist circumference in Chinese adults Biomed Environ Sci 2002 15 83 96 12046553
- Ho SY Lam TH Janus ED Waist to stature ratio is more strongly associated with cardiovascular risk factors than other simple anthropometric indices Ann Epidemiol 2003 13 683 691 14599732