
Abstract
Background
Optical coherence tomography angiography (OCT-A) has emerged as a novel, fast, safe and non-invasive imaging technique of analyzing the retinal and choroidal microvasculature in vivo. OCT-A captures multiple sequential B-scans performed repeatedly over a specific retinal area at high speed, thus enabling the composition of a vascular map with areas of contrast change (high flow zones) and areas of steady contrast (slow or no flow zones). It therefore provides unique insight into the exact retinal or choroidal layer and location at which abnormal blood flow develops. OCTA has evolved into a useful tool for understanding a number of retinal pathologies such as diabetic retinopathy, age-related macular degeneration, central serous chorioretinopathy, vascular occlusions, macular telangiectasia and choroidal neovascular membranes of other causes. OCT-A technology is also increasingly being used in the evaluation of optic disc perfusion and has been suggested as a valuable tool in the early detection of glaucomatous damage and monitoring progression.
Objective
To review the existing literature on the applications of optical coherence tomography angiography in neurodegenerative diseases.
Summary
A meticulous literature was performed until the present day. Google Scholar, PubMed, Mendeley search engines were used for this purpose. We used 123 published manuscripts as our references. OCT-A has been utilized so far to describe abnormalities in multiple sclerosis (MS), Alzheimer’s disease, arteritic and non-arteritic optic neuropathy (AION and NAION), Leber’s hereditary optic neuropathy (LHON) papilloedema, Parkinson’s disease, Huntington’s disease, amyotrophic lateral sclerosis (ALS), Wolfram syndrome, migraines, lesions of the visual pathway and cerebral autosomal dominant arteriopathy with subcortical infarcts and leukoencephalopathy (CADASIL). It appears that OCT-A findings correlate quite well with the severity of the aforementioned diseases. However, OCT-A has its own limitations, namely its lack of wide-field view of the peripheral retina and the inaccurate interpretation due to motion artifacts in uncooperative groups of patients (e.g. children). Larger prospective longitudinal studies will need to be conducted in order to eliminate the aforementioned limitations.
Introduction
Optical Coherence Tomography Angiography (OCT-A) is a recently introduced imaging modality which is used mainly for the assessment of the integrity of the retinal vasculature in a wide range of retinal vascular diseases.Citation1–Citation5 OCT-A has also been utilized for the assessment of the blood perfusion of the optic nerve head in patients suffering from glaucoma.Citation6
The use of OCT-A in the assessment of the retinal vasculature was approved by the Food and Drug Administration (FDA) approximately 4 years ago. The principles of OCT-A imaging are the same with the conventional OCT.Citation7
This newly introduced imaging modality has some advantages compared to the conventional retinal imaging modalities. Firstly, it allows an en-face high resolution and enhanced depth imaging of the retinal vascular network.Citation8 Unlike fluorescein or indocyanine green angiography, OCT-A is non-invasive. This means that the patients do not have to receive intravenous injections of a dye and this essentially eliminates all the side effects that the conventional retinal angiography techniques have including anaphylaxis, nausea, vomiting, rash, urine and skin discoloration. As a result, OCT-A is also much safer and better tolerated compared to fluorescein or indocyanine green angiography. In addition, the fluorescein and indocyanine green dye injection have been found to create obscurations of the retinal imaging and this may result in poor quality pictures and subsequently inability to address relevant changes in the retinal vascular network, such as capillary loss, early neovascular membrane formation or vessel distortion.Citation9–Citation13 On the other hand, OCT-A does not require injections of dye and therefore the quality of the images obtained seems to be superior compared to the ones obtained by fluorescein or indocyanine green angiography.
Given all the above significant advantages of OCT-A, its use has been gaining increasing popularity among the Medical Retina Specialists. At the same time, there is a lot of debate as to whether OCT-A could also be used in Neuro-ophthalmology and Neurology.
The retinal vascular network exhibits striking similarities with the vascular network of the brain.Citation14,Citation15 Due to the limitations faced in terms of accessing the brain vasculature, the vascular network of the eye could potentially serve as a mirror reflecting the changes of the brain vasculature in other neurodegenerative diseases. This has prompted the use of OCT-A in animal models for the study of brain injury and stroke.Citation16 Furthermore, there have been recent publications where the use of OCT-A was explored in other neurological and neuro-ophthalmological diseases.Citation17–Citation28
In this manuscript, our aim is to summarize the basic principles and algorithms of OCT-A. We also aim to summarize the salient findings that have been published so far about its use in the fields of Neuro-ophthalmology and Neurology, which are two scientific fields with significant overlap. Furthermore, we would like to point out the limitations in the use of OCT-A. Finally, we would like to make suggestions on how to expand its application in diseases, where its use has been limited or absent so far.
Materials and Methods
We tried to perform a thorough and extensive review of the current literature up until the present day (May 2020). Google Scholar, PubMed, Mendeley search engines were used for this purpose. The terms “optical coherence tomography” “optical coherence tomography angiography”, “Neuro-ophthalmology” and “Neurology” were typed in the aforementioned search engine tools in order to identify publications that are related to the use of OCT-A. Other associated terms were also used including optic neuropathy, visual pathway, neurodegeneration, cognitive impairment, demyelination, diabetic retinopathy, Alzheimer’s, papilloedema, Parkinson’s disease, Huntington’s disease, Amyotrophic lateral sclerosis (ALS) and stroke. We used approximately 130 published manuscripts as our references, which were published mainly from 2015 until the present day and were pertinent to the topic and contained descriptions specifically about OCT and OCT-A and their applications in neurological and neuro-ophthalmological conditions. The rationale behind our focus from the year of 2015 onwards was the fact that OCT-A was granted FDA approval that year.
Basic Principles and Algorithms in OCT-A
There are a few algorithms which are utilized by different OCT-A devices currently available in the market to obtain images of the retinal vasculature. These include ultrahigh-sensitive optical microangiography (OMAG, Cirrus HD-OCT 5000™, Carl Zeiss Meditec. Inc),Citation29 split-spectrum amplitude decorrelation angiography (SSADA, Optovue RTVue XR Avanti™, Optovue Inc., Fremont, CA),Citation30 OCT Angiography Ratio Analysis (OCTARA, Topcon DRI OCT Triton Swept source OCT™, Topcon, Japan), and full-spectrum amplitude decorrelation algorithm (FS-ADA, Spectralis OCT2 module prototype™, Heidelberg Engineering, Germany)Citation31 (). These commercially available devices produce A-scan images that are three-dimensional (3 × 3 mm2 A lines in cross-sectional images or 1 pixel in the enface image in less than 3 s.). The frequency of the A-scan varies among the commercially available devices mentioned above. The A-scan images then are merged and produce the B-scan images.Citation7 The commercially available OCT-A devices can produce images with wide field of view, but the lateral resolution of the images is poorer.Citation7 For wide field of view and simultaneously high-resolution images, swept source OCT-A devices can be utilizedCitation32,Citation33 or wide-field montages.Citation29
Table 1 Commercially Available OCT-A Appliances
In order to detect blood flow in the OCT images, the B-scan images are repeated at the same cross-sectional area with similar scanning protocols that are used in other OCT-A devices.Citation33,Citation34 In fact, blood flow detection is essentially achieved by the detection of motion of the red blood cells. SSADA utilizes de-correlation values between the repeated B-scans.Citation35 An increase in these values suggests blood flow, whereas areas of reduced values represent areas of non-perfusion.Citation35 Unlike SSADA, OCTARA utilizes intensity ratio analysis to detect blood flow, whereas FS-ADA utilizes motion contrast.Citation7,Citation36
As it was mentioned in the beginning of the manuscript, the principles of OCT-A imaging are the same with the conventional OCT. This allows the acquisition of images of the retinal vascular network of a specific retinal layer through segmentation.Citation37 The OptovueTM exploits this principle by dividing the retina to five different regions: a) The Inner Retina (from ganglion cell layer to inner plexiform layer) b) The Middle Retina (from inner nuclear layer to outer plexiform layer) c) The outer retina (from outer nuclear layer to external limiting membrane) d) The Choriocapillaris e) The choroid.Citation1,Citation7 These regions can be assessed for the presence of new vessels, loss of capillary perfusion and increased vessel tortuosity by using qualitative data.Citation38–Citation40 The OptovueTM software also contains the ability to use quantitative data through fractal analysis or pixel counting methods to assess the fovea avascular zone (FAZ), parafoveal area and areas of foveal non-perfusion but also other peripheral retinal areas as well by using de-correlation values.Citation30,Citation35
OCT-A in Healthy Individuals
There have been publications that describe the appearances and flow of the retinal vasculature in otherwise healthy individual volunteers.Citation41 The findings were very valuable to establish how a normal vasculature should be and, subsequently, this helps identify the abnormalities on OCT-A that are attributed to a pathological entity e.g. vein occlusion. In summary, OCT-A in otherwise normal controls reveals an even blood flow in both the deep and superficial vascular plexuses and clear visualization of the retinal and choroidal layers.Citation30 These OCT-A findings have been also confirmed in the histological examination of post-mortem specimens.Citation42
After having described the basic principles and algorithms of OCT-A, its advantages over the conventional angiography retinal imaging techniques and how a normal OCT-A looks, we will try to summarize the abnormal OCT-A findings in different neuro-ophthalmological disorders. After extensive literature search in Google Scholar and PubMed, OCT-A has been utilized so far to describe abnormalities in multiple sclerosis (MS), Alzheimer’s disease, arteritic and non-arteritic optic neuropathy (AION and NAION), Leber’s hereditary optic neuropathy (LHON), papilloedema and pseudopapilloedema, diabetic retinopathy, Parkinson’s disease and its variants, amyotrophic lateral sclerosis (ALS), Huntington’s disease and finally in miscellaneous neurological disorders.
MS
MS is a chronic neurodegenerative disorder that is characterized by an inflammatory process that leads to demyelination in different regions of the central nervous system (CNS). Optic neuritis can be the initial symptom in approximately 25% of patients and up to 50% of MS patients will suffer from at least one episode of optic neuritis during the course of their disease.Citation7,Citation20 In post-mortem histological specimen examination, it has been demonstrated that there are demyelinating plaques within the optic nerve.Citation43,Citation44
Conventional OCT imaging studies have demonstrated that the ganglion cell layer and the inner plexiform layer in MS individuals is significantly thinner compared to non-MS patients.Citation45 The extent of thinning of the inner retinal layers seems to reflect quite accurately the extent of the neurodegenerative processes occurring within the CNS.Citation45
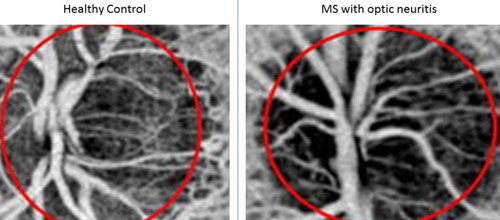
OCT-A findings in MS include significant reduction of the blood flow within the parafoveal region and the optic nerve headCitation17,Citation20 (). Lanzillo et al developed Expanded Disability Status Scale Scores.Citation19 The scores successfully correlated the thickness of the vascular network and the thickness of the inner retinal layers with the level of disability of MS patients.Citation19
Figure 1 Left Side: Disc OCT-A of a healthy control subject. Right side: Disc OCT-A of an optic neuritis disc showing reduced density of the optic nerve head blood vessel network. This implies reduced blood flow on the optic nerve head.
It is still not clear why the blood flow of the retina and optic nerve is reduced in MS patients. One postulated pathophysiological mechanism is that the death of the ganglion cell axons and subsequent reduction of retinal tissue volume lead to reduced metabolic demands and therefore reduced blood supply to the retina and optic nerve.Citation17,Citation18 Another theory is that the inflammatory demyelinating process affects directly the integrity of the vascular endothelium of both the optic nerve and the retina, which results in reduced blood flow.Citation46 This is based on the fact that the cerebral and retinal vasculature exhibit very similar anatomy and physiologyCitation14,Citation15 and that MRIs of MS patients have demonstrated reduced blood flow within the grey and white matter.Citation47,Citation48 However, this hypothesis has not been proven yet.
Alzheimer’s Disease
Alzheimer’s disease is a neurodegenerative disorder which causes significant cognitive impairment and is the most common cause of dementia in the elderly population. The main histological feature is the gradual accumulation of an abnormally folded protein called beta-amyloid in the CNS.Citation21 There is a strong link between Alzheimer’s, cardiovascular risk factors and reduced blood flow of the brain parenchyma.Citation49,Citation50 Of note, it has also been observed that beta-amyloid protein can accumulate within the retina of patients that suffer from Alzheimer’s in a similar manner to the brain parenchyma.Citation51 Given these observations and the similarities of the retinal and cerebral vascular network, it has been postulated that the changes of the retinal vasculature in Alzheimer’s patients could serve as a biomarker for the severity and progression of the disease.Citation7,Citation52
It is postulated that these changes are a consequence of the deposition of beta-amyloid plaques in the retina. The plaques apply compressive forces onto the retinal layers and but also the blood vessels, leading to reduced blood flow, hypoxia and lack of glucose and other nutrients, all of which are essential “fuel” for the highly metabolically active retinal cells.Citation21
As a result, the hypoxic retina responds by producing vascular endothelial growth factors (VEGF) to promote angiogenesis and re-establish its blood supply. Nevertheless, the b-amyloid plaques prevent the process of angiogenesis, because they also form a mechanical barrier for the secretion of vascular endothelial growth factors (VEGF) confining them within the plaques and not allowing VEGF to reach adjacent healthy retina.Citation21
The aforementioned pathophysiological mechanisms may be able to explain why some studies have found that the vascular density of the superficial and deep vascular plexus has been significantly lower in Alzheimer’s patients compared to healthy controls.Citation21,Citation23 In addition, the FAZ of Alzheimer’s patients seems to be significantly compromised probably due to the compressive forces and the mechanical restriction posed on the retinal vascular network by the diffuse aggregation of b-amyloid plaques.Citation23
As a consequence, the OCT-A demonstrates diminished blood flow that will eventually lead to thinning and death of retinal cells. It appears that the ganglion cell layer is more profoundly affected by the ischaemia, and the thinning and atrophy of the ganglion cell layer correlate quite well with the severity of Alzheimer’s disease.Citation52
Of note, only the vascular changes of the deep vascular retinal plexus seem to demonstrate a strong association with the loss of ganglion cell layer in Alzheimer’s patients.Citation7 One proposed explanation is that the superficial vascular plexus is less sensitive to the accumulation of beta-amyloid plaques due to the larger size of its vessels compared to the deep plexus.Citation23
Anterior Ischaemic Optic Neuropathy
Anterior ischaemic optic neuropathy can be divided in arteritic (AION) and non-arteritic (NAION). Arteritic suggests an inflammatory process within the lumen of the artery and the most common cause for this is giant cell arteritis. On the other hand, NAION is associated with cardiovascular risk factors such as hypertension, diabetes, hypercholesterolaemia.Citation27 OCT-A is able to show a reduction in the blood flow of the optic nerve head in both conditions but it cannot differentiate between the twoCitation27 ().
Figure 2 Upper left and lower left images demonstrate the appearance of a healthy optic disc. Upper right and lower right images demonstrate the attenuation and peripapillary capillary drop out of the optic nerve head vascular network in a patient with NAION.
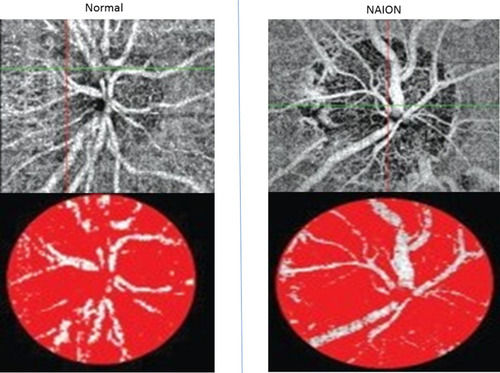
In NAION, it has been found that there is significant sectorial capillary density reduction and subsequent decrease in the blood flow to the corresponding region of the optic nerve head.Citation24,Citation25 The extent of the loss of blood flow has been reported to correlate quite well with the amount of peripheral visual field loss and the reduction in visual acuity in NAION patients.Citation27,Citation28 Macular hypo-perfusion and significant thinning of the inner retinal layers (mainly the ganglion cell and inner plexiform layers) have also been described.Citation7,Citation53
LHON
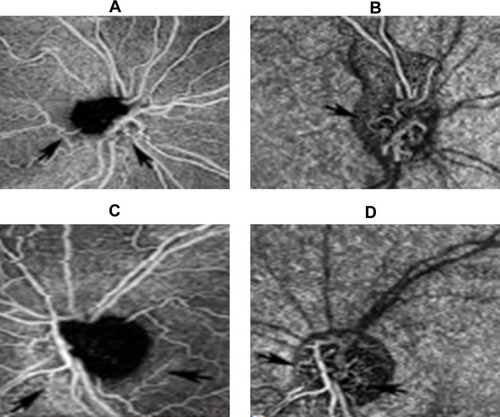
This is a genetic disorder which is inherited via the maternal mitochondrial DNA. It affects mainly young males and presents initially with unilateral disc swelling and profound visual loss in the affected eye. After a few weeks or months, the fellow eye becomes involved and eventually both discs become pale and atrophic. The optic disc vessels are telangiectatic and they do not leak on fundus fluorescein angiography.Citation54 OCT-A reveals loss of peripapillary vessels and increased vessel tortuosity of the remaining ones, which leads to reduction in the blood flow of the optic nerve head and eventually to loss of nerve fibers and disc atrophy ().
Figure 3 OCT-A images of a patient with Leber hereditary optic neuropathy.
Disc Swelling Due to Raised Intracranial Pressure
True disc swelling due to idiopathic intracranial hypertension (papilloedema) or secondary to other causes may lead to a significant increase of the retinal nerve fiber layer (RNFL) thickness but also disruption of the inner layers.Citation55 In cases of papilloedema, there is inhibition of the axoplasmic flow along the axons of the ganglion cells within the inner retina and also aggregation of cellular debris.Citation56 On the other hand, pseudo-papilloedema of the optic disc does not demonstrate such histological features but ophthalmoscopically can resemble true oedema. Hence, it can be quite challenging to differentiate between the two clinical entities. Nevertheless, the distinction is mandatory, as true disc swelling may suggest an underlying condition that not only threatens the patient’s sight but also his/her life. OCT and OCT-A may be quite valuable tools in order to distinguish between papilloedema and pseudo-papilloedema.
In papilloedema, the gangion cells that compose the inferior and superior quadrants of the optic nerve head are chiefly affected, because their axons are larger in caliper.Citation56–Citation58 Carta et al demonstrated a statistically significant increase in the average RNFL thickness and in the RNFL thickness of the nasal quadrant of optic discs with papilloedema compared to discs with pseudo-papilloedema and also in healthy controls.Citation56
OCT-A in a papilloedema case reported in literature has shown that there is increased vessel tortuosity and density along with increasing size of the affected vessels.Citation26 Furthermore, Fard et al demonstrated that OCT-A in papilloedema demonstrated increased whole image density and nasal peripapillary density compared to discs with pseudo-papilloedema.Citation59 This was particularly obvious in papilloedema grades 1 and 2.Citation59 In grade 3 or 4 papilloedema, the peripapillary capillary density was reduced and was not very useful to differentiate between grade 3 or 4 papilloedema from pseudo-papilloedema.Citation59 These observations were significant, as they suggest that OCT-A parameters can be of great value in cases where there is a diagnostic dilemma between early papilloedema and pseudo-papilloedema.Citation59
Diabetic Retinopathy
Diabetic retinopathy was thought to be only a microvascular complication of diabetes. However, more recent studies have postulated that it is a more complex entity, where neurodegenerative changes may play a pivotal role,Citation60–Citation67 especially during the initial stages of the disease.Citation64
Numerous manuscripts have introduced the term neurovascular unit (NVU) in an attempt to describe the function of the blood-brain barrier (BRB).Citation64–Citation67 Within the retina, the NVU represents an intimate communication between the neurosensory retinal cells (bipolar, horizontal, amacrine and ganglion cells), neuronal glial cells (Muller cells and astrocytes), vascular channels (endothelial cells and pericytes) and immune cells (macrophages).Citation64–Citation67 The vascular network of the retina does not receive innervation from the autonomic nervous system, thus it is highly dependent on intrinsic regulatory mechanisms provided by the NVU which controls the blood flow within the retina.Citation68,Citation69 Therefore, the NVU acts as a crucial homeostatic mechanism within the retina.
During the early stages of the disease, it appears that the homeostatic role of the NVU is compromised and this precedes the vascular changes.Citation60–Citation67 These processes trigger an increase in the extracellular concentration of glutamate and subsequent imbalance in the secretion of other neuroprotective factors within the retina.Citation60–Citation67 As a result, there is increased reactive gliosis and neurosensory retinal cell apoptosis, which subsequently lead to low-grade inflammation, impaired haemodynamic response and disruption of the BRB. Eventually, the BRB break down will lead to the manifestation of microvascular impairment observed in diabetic retinopathy.Citation60–Citation67 There are numerous neuroprotective factors that are implicated in the bridging between the neurodegenerative changes and the vascular changes.Citation60–Citation67
OCT-A can help identify vascular changes in diabetic patients, mainly microaneurysms and capillary drop out.Citation64,Citation70 Of note, these changes can in fact be detected in diabetics prior to the manifestation of clinically evident diabetic retinopathy as seen in diabetic screening photographs or during slit-lamp examination.Citation71 In addition, these changes are more prominent in the deep capillary plexus that in the superficial.Citation71 The early detection of such changes on the OCT-A reflects the neurodegenerative processes occurring at the early stages of diabetic retinopathy. This important clue could be used as a biomarker for detecting changes before they become clinically evident and this can also be used as a guide to develop drugs which can have neuroprotective effect within the retina and prevent the appearance and progression of diabetic retinopathy.
Another important fact that needs to be highlighted is that there are studies suggesting that type 2 diabetics share similar pathophysiological pathways leading to retinal neurodegeneration with Alzheimer’s disease.Citation72,Citation73 Therefore, OCT-A in diabetics could potentially be useful as a screening tool for the identification in type 2 diabetics that are more vulnerable to develop cognitive impairment, which on its own may hinder the ability of these individuals to comply with lifestyle changes and treatment regimes.Citation64,Citation72 Larger scale prospective studies, however, will be required to validate this hypothesis.
Parkinson's Disease and Its Variants
OCT has also been used to study the changes in the retinal layers and optic nerve in Parkinson’s disease and its variants, which are Progressive Supranuclear Palsy (PSP) and Multiple System Atrophy (MSA).Citation74–Citation95
Parkinson’s disease is a disorder affecting the basal ganglia within the CNS, where dopamine is a very crucial neurotransmitter. Dopamine plays also a pivotal role within the retina regulating different visual processes. This is the reason why there were studies that tried to find a correlation between the changes between the RNFL thickness and the severity of the disease.
Altintas et al and Inzelberg et al described generalized RNFL thinning in patients with Parkinson’s disease but there was no consensus between the two reports about the quadrants that were more profoundly affected.Citation75,Citation76 RNFL thinning was confirmed by other reports in Parkinson’s patients with both mild and severe disease.Citation74,Citation77 Furthermore, there were reports that described the correlation between the extent of the RNFL thinning and the disease progression,Citation78,Citation79 however this was disputed by two other reports.Citation80,Citation81 Due to the controversial findings among the different reports, a meta-analysis was conducted to assess the validity of the different data and reported that there was RNFL thinning in all quadrants in parkinsonian patients.Citation82
Another area of interest was the attempt to correlate the changes in the foveal area with the severity of Parkinson’s disease. The results were controversial as with the RNFL thickness. In 2014, Garcia-Martin et al reported increased foveal thinning,Citation83 but a subsequent study by Shrier et al disputed the above finding.Citation84 The same study notably found a difference in the foveal thickness between the two eyes of the same patients that were included in that study.Citation84 Cubo et al described both increased foveal thinning and asymmetry in foveal thickness.Citation85 Another interesting finding of Cubo et al study was that the foveal thinning was more profound in the contralateral side of the more affected limb.Citation85 Finally, Spund et al suggested that patients with Parkinson’s exhibit not only foveal thinning but also broadening of their foveal pit, which could potentially serve as a biomarker for the disease.Citation86
Other studies also attempt to find a correlation between the severity of Parkinson’s disease and the thickness of individual retinal layers. Albrecht et al described increased inner nuclear retinal layer thickness in individuals with Parkinson’s disease.Citation87 Garcia Martin et al confirmed this but also reported thinning of the outer plexiform layer (OPL), inner plexiform layer (IPL), ganglion cell layer (GCL) and RNFL.Citation78 However, another study by Schneider et al disputed the above findings.Citation88
One study focused on assessing the choroidal thickness in patients suffering from Parkinson’s disease and reported that the choroidal thickness in such individuals was increased.Citation89 Nevertheless, more prospective studies are required to further validate this finding.
In addition to the above controversial findings, we also performed a literature search looking specifically for the use of OCT-A in Parkinson’s disease and not only the conventional OCT. In a small prospective study, Kwapong et al reported reduced microvascular density in most areas of the whole retina.Citation90 In addition, the same report described strong correlation between the reduced vascular density of the superficial vascular retinal layer and the thinning of the inner plexiform and ganglion cell layers in patients suffering from Parkinson’s disease.Citation90
With regards to PSP, Albrecht et al reported generalized decrease in the total macular volume in PSP patients.Citation87 This finding was observed in a later study, which used OCT but also scanning laser polarimetry.Citation91 The same study also reported changes in parafoveal areas, reductions of the central minimum and thinning of the RNFL as measured by two devices, which were independent of disease severity and duration.Citation91 Schneider et al also suggested that PSP individuals exhibited increased thickness of their OPL with simultaneous thinning of the outer nuclear layer (ONL) compared to healthy controls.Citation88 Schneider et al further suggested that the OPL/ONL volume ratio was highly sensitive (91%) and specific (88%) in the distinction between PSP (<5.03) and MSA (>5.03).Citation88 However, we could not find any manuscripts mentioning the use of OCT-A specifically in PSP apart from the conventional disc OCT.
In MSA, a meta-analysis published in 2017 reported that there is a significant decrease in the RNFL thickness in the inferior, superior and nasal quadrant but less prominent in the temporal quadrant.Citation92 This means that the macular ganglion cell complex which is located at the temporal quadrant of the RNFL is less likely to be compromised.Citation92 These changes follow a completely different pattern from Parkinson’s disease and therefore they can be used as a means of distinction between Parkinson’s disease and MSA.Citation92 In addition, there have been two reports published prior to this meta-analysis suggesting a correlation of the RNFL thinning and disease severity in MSA patients.Citation93,Citation94 Similarly, to PSP, despite our thorough and extensive search, we could not find any manuscripts mentioning the use of OCT-A specifically in MSA apart from the conventional OCT.
Despite the occasionally contradicting findings among the different studies as described above, it appears that OCT and OCT-A could evolve into useful tools in monitoring disease progression in the whole spectrum of parkinsonian syndromes and also in differentiating between Parkinson’s, PSP and MSA.
Cerebral Autosomal Dominant Arteriopathy with Subcortical Infarcts and Leukoencephalopathy
Cerebral autosomal dominant arteriopathy with subcortical infarcts and leukoencephalopathy (CADASIL) is a rare autosomal dominant condition attributed to Notch-3 mutations.Citation96 It is characterized by the aggregation of osmiophilic material within the brain vasculature, thickening of the vessel wall and lumen stenosis.Citation97 It is the most common hereditary cause for ischaemic strokes manifesting at an average age of 49.Citation98 In the absence of other cardiovascular risk factors, CADASIL is considered a genetic model to understand small vessel disease.Citation99
Due to the morphological similarities between the retinal and the brain vasculature, studies have focused on studying the changes observed in the retinal vascular network and how these can be linked to the alteration of cerebral blood flow in CADASIL patients. The first report was released in 2014 by Alten et al, where conventional OCT was used.Citation99 The study demonstrated increased RNFL thickness due to increased retinal vessel diameter, thickened venous lumina and reduced arterial lumina.Citation99 The choroidal vessels were unaffected.Citation99 These findings were in consensus with previous histological findings.Citation100 However, assessment of the retinal blood flow or the optic nerve head with OCT-A was not done, as OCT-A was not FDA approved until 2015. However, it was the first study that attempted to use multimodal imaging to assess morphological features of the retinal vasculature in CADASIL individuals and compare those with healthy controls. Fang et al confirmed these observations and found a link between retinal vessel changes and changes detected on MRI scans of such patients.Citation101
After the FDA granted approval for the use of OCT-A in 2015, the same study group assessed the macular retinal and optic nerve head blood flow and choriocapillaris blood flow in CADASIL individuals with OCT-A.Citation98 The study suggested a reduction in the blood flow of the deep retinal vein plexus of the macula, but the blood flow of the optic nerve head, choriocapillaris and the superficial vascular plexus were not affected.Citation98 The study group attributed these changes to the loss of pericytes occurring due to the Notch-3 mutations.Citation98 However, the blood flow changes did not lead to clinical symptoms of impaired visual function. The same study tried to correlate the OCT-A findings with the MRI brain findings in such patients. However, the study did not find any correlation between the MRI FLAIR sequence findings and the OCT-A findings.Citation98 To date, this is the only study that used OCT-A for the study of the retinal vasculature in CADASIL individuals.
Amyotrophic Lateral Sclerosis
Amyotrophic lateral sclerosis known also as “Lou Gehrig’s Disease” is a rare neurodegenerative disorder that affects both the lower and upper motor neurons.Citation102 A few studies attempted to use conventional OCT to investigate the involvement of the optic nerve and whether this could be used as a biomarker for the early detection of ALS. There were reports that suggested RNFL thinning,Citation103–Citation108 however these observations have been disputed by other study groups.Citation109,Citation110
All the above studies yielded contradictory results because they were cross-sectional without follow-up results and also included ALS patients with different clinical manifestations, different stages of disease severity.Citation111 Rojas et al performed a prospective study with early ALS patients to assess the OCT findings in baseline visit and after a 6 month follow-up.Citation111 The results suggested an increased thickness of the inner macular ring temporally and inferiorly compared to healthy controls, progressive RNFL thinning after 6 months of follow-up and a moderate correlation between the OCT findings and the severity of the disease.Citation111 However, the follow-up period was relatively short and the number of eyes was also small.
None of the above reports and studies used specifically the OCT-A to assess blood flow of the macular region or the optic nerve in ALS patients. Some of these reports were published prior to 2015, when OCT-A received FDA approval for use in everyday clinical practice. Others published after the approval did not look into the retinal and optic nerve blood flow. Larger scale longitudinal prospective studies need to be conducted with both conventional OCT and OCT-A to elucidate more robust data. The general consensus is that OCT and OCT-A have the potential of becoming valuable tools in the early detection and monitoring of ALS patients.Citation112
Huntington’s Disease
This is another rare inherited fully penetrant neurodegenerative disorder leading to personality changes, dementia and chorea.Citation113
In our research, we found 3 papers describing the OCT findings in patients with Huntington’s disease.Citation114–Citation116 Again, the reports refer to conventional OCT and no OCT-A imaging was utilized to assess the blood flow of the retina and the optic nerve head. The reports suggest temporal and superior RNFL thinning compared to healthy controls and also reduced macular thickness.Citation114–Citation116 As with ALS, these are small sample cross-sectional studies and larger scale prospective longitudinal studies with the implementation of both conventional OCT and also OCT-A must be conducted to obtain more reliable data.
Wolfram Syndrome
A study by Asanad et al assessed the use of OCT-A in patients with Wolfram syndrome, rare neurodegenerative disease including diabetes insipidus, diabetes mellitus, deafness, and optic neuropathy.Citation117,Citation118 The OCT-A demonstrated reduced blood flow of the radial peripapillary capillary plexus (RPC) and superficial capillary plexus (SCP), which correlated well with the corresponding RNFL thinning.Citation118 The authors postulate a mitochondrial involvement related to the observed OCT-A findings.Citation117,Citation118
Lesions of the Visual Pathway
In another case-control observational study, Parozanni et al used both conventional OCT and OCT-A to assess optic nerve and macular changes between 26 patients suffering from optic nerve axonal degeneration secondary to posterior optic pathway glioma involving the chiasma, the postchiasmatic visual pathway, or both (but not involving optic nerves) and 24 gender- and age-matched healthy participants.Citation119 The study demonstrated markedly reduced RNFL thickness between the patients and the control group.Citation119 Macular deep capillary plexus (DCP) and RPC were also reduced and the reduction correlated with the observed corresponding RNFL thinning.Citation119 SCP perfusion did not demonstrate statistically significant differences between the two groups.Citation119 The authors suggest that the compressive lesions lead to the death and loss of axons, which reduced retinal metabolic demands and subsequently lead to vascular remodeling and reduced blood perfusion and they postulate that the Muller cells may be the culprit for this cascade of events.Citation119
Migraines
There have been also reports to assess the use of OCT-A and its ability to detect vascular changes in the retina of patients with migraines with aura and without aura.Citation120,Citation121 Chang et al described that patients with migraine with aura exhibited enlarged foveal avascular zone (FAZ), reduced parafoveal SCP blood flow and reduced RPC superiorly compared to those without aura and also compared to healthy controls.Citation120 The authors did not observe any changes in OCT-A of patients with migraine without aura and healthy controls.Citation120 They postulate that these findings may make patients with migraines with aura more prone to retinal vascular occlusion, ischaemic optic neuropathies and normal tension glaucoma.Citation120
Ulusoy et al agreed with the findings of the above study about patients suffering with migraines with aura, but in their study, they also observed changes in the blood flow in the macular and optic nerve region in patients without aura as well.Citation121 The authors also tried to correlate these findings with white matter hyperintensities observed in the MRI brain of patients with migraines with and without aura.Citation121 The authors observed there was a statistically significant correlation of the OCT-A findings and the MRI findings only in the migraine with aura group.Citation121
A study published in April 2020 looked at patients with migraines without aura.Citation122 The study reported no statistically significant difference between the patient group and the control group with regard to ganglion cell complex, foveal, and retinal nerve fiber layer thicknesses.Citation122 In addition, the study reported no statistically significant differences in the superficial or deep vascular perfusion densities of the optic disc between the groups. Furthermore, this study contradicted the findings of Chang et al, as the migraine without aura group exhibited a statistically significant enlargement of the FAZ and reduced macular blood flow compared to the healthy controls.Citation122 The migraine without aura group was further divided into two subgroups, one with white matter hyperintensities and one without.Citation122 There was no significant difference concerning the FAZ size or vascular densities between the migraine groups.Citation122 The authors acknowledge that their study was a small sample cross-sectional study and has limitations and they are in the process of conducting a follow-up study to investigate further.Citation122
In summary, the published manuscripts about the use of OCT-A in the assessment of the retinal and optic nerve perfusion have yielded contradictory results for the same reason as for other aforementioned conditions. They are cross-sectional studies with small sample sizes and therefore larger scale prospective longitudinal studies with the implementation of both conventional OCT and also OCT-A must be conducted to obtain more reliable data.
Limitations in the Use of OCT-A
Since OCT-A was introduced in 2015, the current data available about its applications stem from studies that contain small sample sizes and this limits the level of evidence and the validity of the findings.Citation123 There is still a significant learning curve in terms of interpretation and there is no unanimous protocol as to which parameters should be taken into account and this may lead to false-positive or -negative results that affect the validity of the findings and yield contradictory results among different study groups.Citation117
Another important limitation is that many of these neurodegenerative disorders can affect the mental capacity of such patients and subsequently their cooperation when OCT-A images are obtained. As a result, this may lead to poor quality images that can lead to inaccurate interpretation due to motion artifacts.Citation123 Since OCT-A demands high levels of patient cooperation and attentiveness, it may not be quite useful imaging tools in children due to their very short attention span.Citation117 Furthermore, the commercially available OCT-A devices are not able to provide a wide field of view of the vasculature of the peripheral retina and the views are very limited to the posterior pole.Citation123 This prevents us from studying meticulously the whole retinal periphery and this has also led to numerous studies that are confined to the macular and optic nerve head regions so far. In addition, not all amount of light can be transmitted through the erythrocytes and this mainly affects the precise depiction of the choroidal vasculature, since the melanosomes of the retinal pigment epithelium not only absorb but also induce light scattering.Citation117
Another important limitation is that many of these patients usually are elderly and they may suffer from other conditions such as hypertensive retinopathy, diabetic retinopathy, primary open-angle glaucoma, vein occlusions and macular degeneration. The OCT-A findings in retinal vascular disease have a significant amount of overlapping with the retinal changes induced by the neurodegenerative disorders and therefore it is quite challenging to describe accurately the real extent of the contributions of each pathological entity due to substandard segmentation carried out by the current OCT-A software available.Citation123 In the same context, other macular or optic nerve lesions, such as epiretinal membranes or myelinated nerve fiber layers can obscure the images obtained by the OCT-A devices.Citation117,Citation123
Finally, the size of the retinal capillaries varies from 5μm to 10 μm. These numbers are at the lower levels of the transverse resolution of the OCT-A beams and this might affect the calculations of the vessel density.Citation123
Conclusion
In summary, we advocate that OCT-A can play a pivotal role in the detection and monitoring of a wide range of neurodegenerative disorders. OCT-A can provide valuable data about the structural changes of the retinal and optic nerve vascular network and this can be used for the development of biomarkers to monitor the disease progression and also to develop potential future treatments which could halt or reverse the progression of such diseases that are currently incurable. However, there are many shortcomings which prevent the wider use of OCT-A for the above purposes. Larger prospective longitudinal studies will need to be conducted in order to optimize the quality of the OCT-A images and the accurate interpretation of the data.
Disclosure
The authors report no conflicts of interest in this work. The authors alone are responsible for the content and writing of the paper.
References
- Roisman L, Goldhardt R. OCT angiography: an upcoming non-invasive tool for diagnosis of age-related macular degeneration. Curr Ophthalmol Rep. 2017;5:136–140. doi:10.1007/s40135-017-0131-629051844
- Balaratnasingam C, Yannuzzi LA, Spaide RF. Possible choroidal neovacularization in macular telangiectasia type 2. Retina. 2015;35:2317–2322. doi:10.1097/IAE.000000000000088726465619
- Coscas F, Glacet-Bernard A, Miere A, et al. Optical coherence tomography angiography in retinal vein occlusion: evaluation of superficial and deep capillary plexa. Am J Ophthalmol. 2016;161:160–167. doi:10.1016/j.ajo.2015.10.00826476211
- Wakabayashi T, Sato T, Hara-Ueno C, et al. Retinal microvasculature and visual acuity in eyes with branch retinal vein occlusion: imaging analysis by optical coherence tomography angiography. Invest Opthalmol Vis Sci. 2017;58:2087. doi:10.1167/iovs.16-21208
- Spaide RF. Volume-rendered optical coherence tomography of diabetic retinopathy pilot study. Am J Ophthalmol. 2015;160:1200–1210. doi:10.1016/j.ajo.2015.09.01026384548
- Jia Y, Wei E, Wang X, et al. Optical coherence tomography angiography of optic disc perfusion in glaucoma. Ophthalmology. 2014;121(7):1322–1332. doi:10.1016/j.ophtha.2014.01.02124629312
- Wang L, Murphy O, Caldito NG, Calabresi PA, Saidha S. Emerging applications of Optical Coherence Tomography Angiography (OCTA) in neurological research. Eye Vis. 2018;5:11. doi:10.1186/s40662-018-0104-3
- Carpineto P, Mastropasqua R, Marchini G, Toto L, Di Nicola M, Di Antonio L. Reproducibility and repeatability of foveal avascular zone measurements in healthy subjects by optical coherence tomography angiography. Br J Ophthalmol. 2016;100:671–676. doi:10.1136/bjophthalmol-2015-30733026377414
- Hwang TS, Jia Y, Gao SS, et al. Optical coherence tomography angiography features of diabetic retinopathy. Retina. 2015;35(11):2371–2376. doi:10.1097/IAE.000000000000071626308529
- Matsunaga D, Yi J, Puliafito CA, Kashani AH. OCT angiography in healthy human subjects. Ophthalmic Surg Lasers Imaging Retina. 2014;45:510–515. doi:10.3928/23258160-20141118-0425423629
- Stanga PE, Lim JI, Hamilton P. Indocyanine green angiography in chorioretinal diseases: indications and interpretation: an evidence-based update. Ophthalmology. 2003;110(1):15–21. doi:10.1016/S0161-6420(02)01563-412511340
- Ito YN, Mori K, Young-Duvall J, Yoneya S. Aging changes of the choroidal dye filling pattern in indocyanine green angiography of normal subjects. Retina. 2001;21(3):237–242. doi:10.1097/00006982-200106000-0000711421013
- Teussink MM, Breukink MB, van Grinsven MJ, et al. OCT angiography compared to fluorescein and indocyanine green angiography in chronic central serous chorioretinopathy. Invest Ophthalmol Vis Sci. 2015;56:5229–5237. doi:10.1167/iovs.15-1714026244299
- London A, Benhar I, Schwartz M. The retina as a window to the brain-from eye research to CNS disorders. Nat Rev Neurol. 2013;9:44–53. doi:10.1038/nrneurol.2012.22723165340
- Patton N, Aslam T, Macgillivray T, Pattie A, Deary IJ, Dhillon B. Retinal vascular image analysis as a potential screening tool for cerebrovascular disease: a rationale based on homology between cerebral and retinal microvasculatures. J Anat. 2005;206(4):319–348. doi:10.1111/j.1469-7580.2005.00395.x15817102
- Wang RK, Hurst S. Mapping of cerebro-vascular blood perfusion in mice with skin and skull intact by optical micro-angioGraphy at 1.3 mum wavelength. Opt Express. 2007;15:11402–11412. doi:10.1364/OE.15.01140219547498
- Wang X, Jia Y, Spain R, et al. Optical coherence tomography angiography of optic nerve head and parafovea in multiple sclerosis. Br J Ophthalmol. 2014;98:1368–1373. doi:10.1136/bjophthalmol-2013-30454724831719
- Feucht N, Maier M, Lepennetier G, et al. Optical coherence tomography angiography indicates associations of the retinal vascular network and disease activity in multiple sclerosis. Mult Scler. 2019;25:224–234. doi:10.1177/135245851775000929303033
- Lanzillo R, Cennamo G, Criscuolo C, et al. Optical coherence tomography angiography retinal vascular network assessment in multiple sclerosis. Mult Scler. 2018;24:1706–1714. doi:10.1177/135245851772946328933233
- Spain RI, Liu L, Zhang X, et al. Optical coherence tomography angiography enhances the detection of optic nerve damage in multiple sclerosis. Br J Ophthalmol. 2018;102:520–524. doi:10.1136/bjophthalmol-2017-31047728814415
- Bulut M, Kurtuluş F, Gözkaya O, et al. Evaluation of optical coherence tomography angiographic findings in alzheimer’s type dementia. Br J Ophthalmol. 2018;102:233–237. doi:10.1136/bjophthalmol-2017-31047628600299
- den Haan J, Janssen SF, van de Kreeke JA, Scheltens P, Verbraak FD, Bouwman FH. Retinal thickness correlates with parietal cortical atrophy in early-onset alzheimer’s disease and controls. Alzheimers Dement. 2017;10:49–55. doi:10.1016/j.dadm.2017.10.005
- Jiang H, Wei Y, Shi Y, et al. Altered macular microvasculature in mild cognitive impairment and alzheimer disease. J Neuroophthalmol. 2018;38:292–298. doi:10.1097/WNO.000000000000058029040211
- Balducci N, Morara M, Veronese C, et al. Optical coherence tomography angiography in acute arteritic and non-arteritic anterior ischemic optic neuropathy. Graefes Arch Clin Exp Ophthalmol. 2017;255:2255–2261. doi:10.1007/s00417-017-3774-y28861697
- Fard MA, Suwan Y, Moghimi S, et al. Pattern of peripapillary capillary density loss in ischemic optic neuropathy compared to that in primary open-angle glaucoma. PLoS One. 2018;13:e0189237. doi:10.1371/journal.pone.018923729320503
- Ghasemi Falavarjani K, Tian JJ, Akil H, Garcia GA, Sadda SR, Sadun AA. Swept-source optical coherence tomography angiography of the optic disk in optic neuropathy. Retina. 2016;36(Suppl 1):S168–S177. doi:10.1097/IAE.000000000000125928005675
- Ling JW, Yin X, Lu QY, Chen YY, Lu PR. Optical coherence tomography angiography of optic disc perfusion in non-arteritic anterior ischemic optic neuropathy. Int J Ophthalmol. 2017;10:1402–1406. doi:10.18240/ijo.2017.09.1228944200
- Song Y, Min JY, Mao L, Gong YY. Microvasculature dropout detected by the optical coherence tomography angiography in nonarteritic anterior ischemic optic neuropathy. Lasers Surg Med. 2018;50:194–201. doi:10.1002/lsm.2271228986994
- Zhang Q, Lee CS, Chao J, et al. Wide-field optical coherence tomography based microangiography for retinal imaging. Sci Rep. 2016;6:22017. doi:10.1038/srep2201726912261
- Jia Y, Bailey ST, Hwang TS, et al. Quantitative optical coherence tomography angiography of vascular abnormalities in the living human eye. Proc Natl Acad Sci U S A. 2015;112(18):E2395–E2402. doi:10.1073/pnas.150018511225897021
- Moussa M, Leila M, Khalid H, Lolah M. Detection of silent type I choroidal neovascular membrane in chronic central serous chorioretinopathy using en face swept-source optical coherence tomography angiography. J Ophthalmol. 2017;2017:6913980. doi:10.1155/2017/691398029348931
- Zhang Q, Wang RK, Chen C-L, et al. Swept source optical coherence tomography angiography of neovascular macular telangiectasia type 2. Retina. 2015;35(11):2285–2299. doi:10.1097/IAE.000000000000084026457402
- Miller AR, Roisman L, Zhang Q, et al. Comparison between spectral-domain and swept-source optical coherence tomography angiographic imaging of choroidal neovascularization. Invest Ophthalmol Vis Sci. 2017;58:1499–1505. doi:10.1167/iovs.16-2096928273316
- Zhang Q, Huang Y, Zhang T, et al. Wide-field imaging of retinal vasculature using optical coherence tomography-based microangiography provided by motion tracking. J Biomed Opt. 2015;20:066008. doi:10.1117/1.JBO.20.6.06600826102573
- Huang Y, Zhang Q, Thorell MR, et al. Swept-source OCT angiography of the retinal vasculature using intensity differentiation-based optical microangiography algorithms. Ophthalmic Surg Lasers Imaging Retina. 2014;45:382–389. doi:10.3928/23258160-20140909-0825230403
- Munk MR, Giannakaki-Zimmermann H, Berger L, et al. OCT-angiography: a qualitative and quantitative comparison of 4 OCT-A devices. PLoS One. 2017;12(5):e0177059. doi:10.1371/journal.pone.017705928489918
- Chen CL, Wang RK. Optical coherence tomography based angiography [Invited]. Biomed Opt Express. 2017;24(8):1056–1082. doi:10.1364/BOE.8.001056
- de Carlo TE, Bonini Filho MA, Baumal CR, et al. Evaluation of preretinal neovascularization in proliferative diabetic retinopathy using optical coherence tomography angiography. Ophthalmic Surg Lasers Imaging Retina. 2016;47(2):115–119. doi:10.3928/23258160-20160126-0326878443
- Dansingani KK, Freund KB. Optical coherence tomography angiography reveals mature, tangled vascular networks in eyes with neovascular age-related macular degeneration showing resistance to geographic atrophy. Ophthalmic Surg Lasers Imaging Retina. 2015;46:907–912. doi:10.3928/23258160-20151008-0226469229
- Chen Z, Huang D, Izatt JA, et al. Volume-rendering optical coherence tomography angiography of macular telangiectasia type 2 (ophthalmology 2015;122:2261-9). Ophthalmology. 2016;123(3):e24. doi:10.1016/j.ophtha.2015.10.013
- Yu J, Jiang C, Wang X, et al. Macular perfusion in healthy Chinese: an optical coherence tomography angiogram study. Invest Ophthalmol Vis Sci. 2015;56:3212–3217. doi:10.1167/iovs.14-1627026024105
- Choi W, Mohler KJ, Potsaid B, et al. Choriocapillaris and choroidal microvasculature imaging with ultrahigh speed OCT angiography. PLoS One. 2013;8(12):e81499. doi:10.1371/journal.pone.008149924349078
- Ikuta F, Zimmerman HM. Distribution of plaques in seventy autopsy cases of multiple sclerosis in the United States. Neurology. 1976;26(6 PT 2):26–28. doi:10.1212/WNL.26.6_Part_2.26944889
- Toussaint D, Périer O, Verstappen A, Bervoets S. Clinicopathological study of the visual pathways, eyes, and cerebral hemispheres in 32 cases of disseminated sclerosis. J Clin Neuroophthalmol. 1983;3:211–220.6226722
- Saidha S, Al-Louzi O, Ratchford JN, et al. Optical coherence tomography reflects brain atrophy in multiple sclerosis: a four-year study. Ann Neurol. 2015;78:801–813. doi:10.1002/ana.2448726190464
- Plumb J, McQuaid S, Mirakhur M, Kirk J. Abnormal endothelial tight junctions in active lesions and normal-appearing white matter in multiple sclerosis. Brain Pathol. 2002;12:154–169. doi:10.1111/j.1750-3639.2002.tb00430.x11958369
- Doche E, Lecocq A, Maarouf A, et al. Hypoperfusion of the thalamus is associated with disability in relapsing remitting multiple sclerosis. J Neuroradiol. 2017;44:158–164. doi:10.1016/j.neurad.2016.10.00127865557
- Narayana PA, Zhou Y, Hasan KM, Datta S, Sun X, Wolinsky JS. Hypoperfusion and T1-hypointense lesions in white matter in multiple sclerosis. Mult Scler. 2014;20:365–373. doi:10.1177/135245851349593623836878
- Vos SJ, Verhey F, Frölich L, et al. Prevalence and prognosis of alzheimer’s disease at the mild cognitive impairment stage. Brain. 2015;138(Pt 5):1327–1338. doi:10.1093/brain/awv02925693589
- Yamashita KI, Taniwaki Y, Utsunomiya H, Taniwaki T. Cerebral blood flow reduction associated with orientation for time in amnesic mild cognitive impairment and Alzheimer's disease patients. J Neuroimaging. 2014;24:590–594. doi:10.1111/jon.1209624593247
- Snyder PJ, Johnson LN, Lim YY, et al. Nonvascular retinal imaging markers of preclinical Alzheimer’s disease. Alzheimers Dement. 2016;4:169–178.
- Garcia-Martin E, Bambo MP, Marques M, et al. Ganglion cell layer measurements correlate with disease severity in patients with alzheimer’s disease. Acta Ophthalmol. 2016;94(6):e454–e459. doi:10.1111/aos.1297726895692
- Akbari M, Abdi P, Fard MA, et al. Retinal ganglion cell loss precedes retinal nerve fiber thinning in nonarteritic anterior ischemic optic neuropathy. J Neuroophthalmol. 2016;36:141–146. doi:10.1097/WNO.000000000000034526835663
- Takayama K, Ito Y, Kaneko H, Kataoka K, Ra E, Terasaki H. Optical coherence tomography angiography in Leber hereditary optic neuropathy. Acta Ophthalmol. 2017;95:e344–e345. doi:10.1111/aos.1324427778481
- Goldhagen BE, Bhatti MT, Srinivasan PP, Chiu SJ, Farsiu S, El-Dairi MA. Retinal atrophy in eyes with resolved papilledema detected by optical coherence tomography. J Neuroophthalmol. 2015;35:122–126. doi:10.1097/WNO.000000000000021025742060
- Carta A, Mora P, Aldigeri R, et al. Optical coherence tomography is a useful tool in the differentiation between true edema and pseudoedema of the optic disc. PLoS One. 2018;13:e0208145. doi:10.1371/journal.pone.020814530496251
- Mikelberg FS, Drance SM, Schulzer M, Yidegiligne HM, Weis MM. The normal human optic nerve: axon count and axon diameter distribution. Ophthalmology. 1989;96(9):1325–1328. doi:10.1016/S0161-6420(89)32718-72780002
- Pan BX, Ross-Cisneros FN, Carelli V, et al. Mathematically modeling the involvement of axons in Leber’s hereditary optic neuropathy. Invest Ophthalmol Vis Sci. 2012;53(12):7608–7617. doi:10.1167/iovs.12-1045223060142
- Fard M, Sahraiyan A, Jalil J, et al. Optical coherence tomography angiography in papilledema compared with pseudopapilledema. Invest Ophthalmol Vis Sci. 2019;60(1):168–175. doi:10.1167/iovs.18-2545330640969
- Abcouwer SF, Gardner TW. Diabetic retinopathy: loss of neuroretinal adaptation to the diabetic metabolic environment. Ann N Y Acad Sci. 2014;1311::174–190. doi:10.1111/nyas.1241224673341
- Simó R, Hernández C. Neurodegeneration in the diabetic eye: new insights and therapeutic perspectives. Trends Endocrinol Metab. 2014;25(1):23–33. doi:10.1016/j.tem.2013.09.00524183659
- Simó R, Hernández C. Novel approaches for treating diabetic retinopathy based on recent pathogenic evidence. Prog Retin Eye Res. 2015;48:160–180. doi:10.1016/j.preteyeres.2015.04.00325936649
- Stitt AW, Curtis TM, Chen M, et al. The progress in understanding and treatment of diabetic retinopathy. Prog Retin Eye Res. 2016;51:156–186. doi:10.1016/j.preteyeres.2015.08.00126297071
- Simó R, Stitt AW, Gardner WT. Neurodegeneration in diabetic retinopathy: does it really matter? Diabetologia. 2018;61:1902–1912. doi:10.1007/s00125-018-4692-130030554
- Hawkins BT, Davis TP. The blood-brain barrier/neurovascular unit in health and disease. Pharmacol Rev. 2005;57(2):173–185. doi:10.1124/pr.57.2.415914466
- Antonetti DA, Klein R, Gardner TW. Diabetic retinopathy. N Engl J Med. 2012;366(13):1227–1239. doi:10.1056/NEJMra100507322455417
- Gardner TW, Davila JR. The neurovascular unit and the pathophysiologic basis of diabetic retinopathy. Graefes Arch Clin Exp Ophthalmol. 2017;255(1):1–6. doi:10.1007/s00417-016-3548-y27832340
- Newman EA. Functional hyperemia and mechanisms of neurovascular coupling in the retinal vasculature. J Cereb Blood Flow Metab. 2013;33(11):1685–1695. doi:10.1038/jcbfm.2013.14523963372
- Metea MR, Newmman EA. Signalling within the neurovascular unit in the retina. Exp Physiol. 2007;92:635–640. doi:10.1113/expphysiol.2006.03637617434916
- Spaide RF, Fujimoto JG, Waheed NK, Sadda SR, Staurenghi G. Optical coherence tomography angiography. Prog Retin Eye Res. 2018;64:1–55. doi:10.1016/j.preteyeres.2017.11.00329229445
- Hasegawa N, Nozaki M, Takase N, Yoshida OY. New insights into microaneurysms in the deep capillary plexus detected by optical coherence tomography angiography in diabetic macular edema. Invest Ophthalmol Vis Sci. 2016;57:OCT348–OCT355. doi:10.1167/iovs.15-1878227409492
- Simó R, Ciudin A, Simó-Servat O, Hernández C. Cognitive impairment and dementia: a new emerging complication of type 2 diabetes—the diabetologist’s perspective. Acta Diabetol. 2017;54(5):417–424. doi:10.1007/s00592-017-0970-528210868
- Sundstrom JM, Hernández C, Weber S, et al. Proteomic analysis of early diabetic retinopathy reveals mediators of neurodegenerative brain diseases. Invest Ophthamol Vis Sci. 2018;59(6):2264–2274. doi:10.1167/iovs.17-23678
- Kirbas S, Turkyilmaz K, Tufekci A, Durmus M. Retinal nerve fiber layer thickness in Parkinson’s disease. J Neuroophthalmol. 2013;33(1):62–65. doi:10.1097/WNO.0b013e318270174523100041
- Altintas Ö, Iseri P, Ozkan B, Caglar Y. Correlation between retinal morphological and functional findings and clinical severity in Parkinson’s disease. Doc Ophthalmol. 2008;116(2):137–146. doi:10.1007/s10633-007-9091-817962989
- Inzelberg R, Ramirez JA, Nisipeanu P, Ophir A. Retinal nerve fiber layer thinning in Parkinson’s disease. Vision Res. 2004;44(24):2793–2797. doi:10.1016/j.visres.2004.06.00915342223
- La Morgia C, Barboni P, Rizzo G, et al. Loss of temporal retinal nerve fibers in Parkinson’s disease: a mitochondrial pattern? Eur J Neurol. 2013;20(1):198–201. doi:10.1111/j.1468-1331.2012.03701.x22436028
- Garcia-Martin E, Larrosa JM, Polo V, et al. Distribution of retinal layer atrophy in patients with Parkinson’s disease and association with disease severity and duration. Am J Ophthalmol. 2014;157(2):470–478. doi:10.1016/j.ajo.2013.09.02824315296
- Jimenez B, Ascaso FJ, Cristobal JA, Lopez Del Val J. Development of a prediction formula of Parkinson’s disease severity by optical coherence tomography. Mov Disord. 2014;29(1):68–74. doi:10.1002/mds.2574724458320
- Aaker GD, Myung JS, Ehrlich JR, Mohammed M, Henchcliffe C, Kiss S. Detection of retinal changes in Parkinson’s disease with spectral-domain optical coherence tomography. Clin Ophthalmol. 2010;6(4):1427–1432.
- Archibald NK, Clarke MP, Mosimann UP, Burn DJ. Retinal thickness in Parkinson’s disease. Parkinsonism Relat Disord. 2011;17(6):431–436. doi:10.1016/j.parkreldis.2011.03.00421454118
- Yu J-G, Feng Y-F, Xiang Y, et al. Retinal nerve fiber layer thickness changes in Parkinson disease: a meta-analysis. PLoS One. 2014;9(1):e85718. doi:10.1371/journal.pone.008571824465663
- Garcia-Martin E, Rodriguez-Mena D, Satue M, et al. Electrophysiology and optical coherence tomography to evaluate Parkinson’s disease severity. Invest Ophthalmol Vis Sci. 2014;55(2):696–705. doi:10.1167/iovs.13-1306224425856
- Shrier EM, Adam CR, Spund B, Glazman S, Bodis-Wollner I. Interocular asymmetry of foveal thickness in Parkinson’s disease. J Ophthalmol. 2012;2012:728457. doi:10.1155/2012/72845722900149
- Cubo E, Tedejo RP, Rodriguez Mendez V, Lopez Pena MJ, Trejo Gabriel YGJM. Retina thickness in Parkinson’s disease and essential tremor. Mov Disord. 2010;25:2461–2462. doi:10.1002/mds.2321520669291
- Spund B, Ding Y, Liu T, et al. Remodeling of the fovea in Parkinson’s disease. J Neural Transm. 2013;120(5):745–753. doi:10.1007/s00702-012-0909-523263598
- Albrecht P, Muller A-K, Sudmeyer M, et al. Optical coherence tomography in parkinsonian syndromes. PLoS One. 2012;7(4):e34891. doi:10.1371/journal.pone.003489122514688
- Schneider M, Muller H-P, Lauda F, et al. Retinal single-layer analysis in parkinsonian syndromes: an optical coherence tomography study. J Neural Transm. 2014;121(1):41–47. doi:10.1007/s00702-013-1072-323907408
- Satue M, Obis J, Alarcia R, et al. Retinal and choroidal changes in patients with Parkinson’s disease detected by swept-source optical coherence tomography. Curr Eye Res. 2018;43(1):109–115. doi:10.1080/02713683.2017.137011629111842
- Kwapong WR, Ye H, Peng C, et al. Retinal microvascular impairment in the early stages of Parkinson’s disease. Invest Ophthalmol Vis Sci. 2018;;59(10):4115–4122. doi:10.1167/iovs.17-2323030098201
- Litvan I, Mangone CA, McKee A, et al. Natural history of progressive supranuclear palsy (Steele-Richardson-Olszewski syndrome) and clinical predictors of survival: a clinicopathological study. J Neurol Neurosurg Psychiatry. 1996;60:615–620. doi:10.1136/jnnp.60.6.6158648326
- Mendoza-Santiesteban C, Gabilondo I, Palma JA, Norcliffe-Kaufmann L, Kaufmann H. The retina in multiple system atrophy: systematic review and meta-analysis. Front Neurol. 2017;24(8):206. doi:10.3389/fneur.2017.00206
- Ahn J, Lee JY, Kim TW. Retinal thinning correlates with clinical severity in multiple system atrophy. J Neurol. 2016;263:2039–2047. doi:10.1007/s00415-016-8230-027416856
- Mendoza-Santiesteban CE, Palma JA, Martinez J, Norcliffe-Kaufmann L, Hedges RT 3rd, Kaufmann H. Progressive retinal structure abnormalities in multiple system atrophy. Mov Disord. 2015;30:1944–1953. doi:10.1002/mds.2636026359930
- Jellinger KA, Seppi K, Wenning GK. Grading of neuropathology in multiple system atrophy: proposal for a novel scale. Mov Disord. 2005;20(Suppl 12):S29–S36. doi:10.1002/mds.2053716092088
- Joutel A, Corpechot C, Ducros A, et al. Notch3 mutations in CADASIL, a hereditary adult-onset condition causing stroke and Dementia. Nature. 1996;383(6602):707–710. doi:10.1038/383707a08878478
- Tikka S, Mykkanen K, Ruchoux MM, et al. Congruence between NOTCH3 mutations and GOM in 131 CADASIL Patients. Brain. 2009;132(Pt 4):933–939. doi:10.1093/brain/awn36419174371
- Nelis P, Kleffner I, Burg M, et al. OCT-angiography reveals reduced vessel density in the deep retinal plexus of CADASIL patients. Sci Rep. 2018;25(8):8148. doi:10.1038/s41598-018-26475-5
- Alten F, Motte J, Ewering C, et al. Multimodal retinal vessel analysis in CADASIL patients. PLoS One. 2014;5(9):e112311. doi:10.1371/journal.pone.0112311
- Haritoglou C, Hoops J, Stefani F, Mehraein P, Kampik A, Dichgans M. Histopathological abnormalities in ocular blood vessels of CADASIL patients. Am J Ophthalmol. 2004;138(2):302–305. doi:10.1016/j.ajo.2004.02.07315289148
- Fang JX, Yu M, Wu Y, et al. Study of enhanced depth imaging optical coherence tomography in cerebral autosomal dominant arteriopathy with subcortical infarcts and leukoencephalopathy. Chin Med J (Engl). 2017;130:1042–1048. doi:10.4103/0366-6999.20493528469098
- Wijesekera LC, Leigh PN. Amyotrophic lateral sclerosis. Orphanet J Rare Dis. 2009;4(1):3. doi:10.1186/1750-1172-4-319192301
- Simonett JCJ, Siddique N, Armstrong JL, Fawzi AA, Siddique T, Volpe NJ. Ocular Manifestations and Optic Nerve Changes in Patients with Amyotrophic Lateral Sclerosis (ALS). ARVO; 2013.
- Mukherjee N, McBurney-Lin S, Kuo A, Bedlack R, Tseng H, Bhattacharya S. Retinal thinning in amyotrophic lateral sclerosis patients without ophthalmic disease. PLoS One. 2017;12(9):e0185242. doi:10.1371/journal.pone.018524228945811
- Rohani M, Meysamie A, Zamani B, Sowlat MM, Akhoundi FH. Reduced retinal nerve fiber layer (RNFL) thickness in ALS patients: a window to disease progression. J Neurol. 2018;265(7):1557–1562. doi:10.1007/s00415-018-8863-229713825
- Simonett JM, Huang R, Siddique N, et al. Macular sub-layer thinning and association with pulmonary function tests in amyotrophic lateral sclerosis. Sci. Rep. 2016;6(1):29187. doi:10.1038/srep2918727383525
- Hübers A, Müller HP, Dreyhaupt J, et al. Retinal involvement in amyotrophic lateral sclerosis: a study with optical coherence tomography and diffusion tensor imaging. J. Neural Transm. 2016;123(3):281–287. doi:10.1007/s00702-015-1483-426582428
- Volpe NJ, Simonett J, Fawzi AA, Siddique T. Opthalmic manifestations of amyotrophic lateral sclerosis (an American ophthalmological society thesis). Trans Am Ophthalmol Soc. 2015;113:1–15.
- Mukherjee NKA, Bedlack R, Tseng H. Imaging Amyotrophic Lateral Sclerosis (ALS) Neurodegeneration Through the Eye. Orlando, Florida: ARVO; 2014.
- Roth NM, Saidha S, Zimmermann H, et al. Optical coherence tomography does not support optic nerve involvement in amyotrophic lateral sclerosis. Eur J Neurol. 2013;20(8):1170–1176. doi:10.1111/ene.1214623582075
- Rojas P, de Hoz R, Ramirez IA, et al. Changes in retinal OCT and their correlations with neurological disability in early ALS patients, a follow-up study. Brain Sci. 2019;9(12):337. doi:10.3390/brainsci9120337
- Cerveró A, Casado A, Riancho J. Retinal changes in amyotrophic lateral sclerosis: looking at the disease through a new window. J Neurol. 2019;2. doi:10.1007/s00415-019-09654-w
- McColgan P, Tabrizi SJ. Huntington’s disease: a clinical review. Eur J Neurol. 2018;25(1):24–34. doi:10.1111/ene.1341328817209
- Kersten HM, Danesh-Meyer HV, Kilfoyle DH, Roxburgh RH. Optical coherence tomography findings in huntington’s disease: a potential biomarker of disease progression. J Neurol. 2015;262:2457–2465. doi:10.1007/s00415-015-7869-226233693
- Andrade C, Beato J, Monteiro A, et al. Spectral-domain optical coherence tomography as a potential biomarker in huntington’s disease. Mov Disord. 2016;31:377–383. doi:10.1002/mds.2648626853218
- Gatto E, Parisi V, Persi G, et al. Optical Coherence Tomography (OCT) study in argentinean huntington’s disease patients. Int J Neurosci. 2018;128(12):1157–1162. doi:10.1080/00207454.2018.148980729912591
- Wylęgała A. Principles of OCTA and applications in clinical neurology. Curr Neurol Neurosci Rep. 2018;18:96. doi:10.1007/s11910-018-0911-x30338429
- Asanad S, Wu J, Nassisi M, Ross-Cisneros NF, Sadun AA. Optical coherence tomography-angiography in Wolfram syndrome: a mitochondrial etiology in disease pathophysiology. Can J Ophthalmol. 2019;54:e27–e30. doi:10.1016/j.jcjo.2018.04.00230851792
- Parrozzani R, Leonardi F, Frizziero L, et al. Retinal vascular and neural remodeling secondary to optic nerve axonal degeneration. Ophthalmol Retin. 2018;2(8):827–835. doi:10.1016/j.oret.2017.12.001
- Chang MY, Phasukkijwatana N, Garrity S, et al. Foveal and peripapillary vascular decrement in migraine with aura demonstrated by optical coherence tomography angiography. Invest Ophthalmol Vis Sci. 2017;58(12):5477–5484. doi:10.1167/iovs.17-2247729059314
- Ulusoy M, Horasanli B, Kal A. Retinal vascular density evaluation of migraine patients with and without aura and association with white matter hyperintensities. Acta Neurol Belg. 2019;119(3):411–417. doi:10.1007/s13760-019-01094-730762208
- Tasli GN, Ersoy A. Altered macular vasculature in migraine patients without aura: is it associated with ocular vasculature and white matter hyperintensities? J Ophthalmol. 2020;13(2020):3412490.
- Grewal DS, Fine HF, Fekrat S. Is OCT angiography useful in neurodegenerative diseases? Ophthalmic Surg Lasers Imaging Retina. 2019;50(5):269–273. doi:10.3928/23258160-20190503-0231100156