 ?Mathematical formulae have been encoded as MathML and are displayed in this HTML version using MathJax in order to improve their display. Uncheck the box to turn MathJax off. This feature requires Javascript. Click on a formula to zoom.
Abstract
Novel advanced spray-dried and co-spray-dried inhalable lung surfactant-mimic phospholipid and poly(ethylene glycol) (PEG)ylated lipopolymers as microparticulate/nanoparticulate dry powders of biodegradable biocompatible lipopolymers were rationally formulated via an organic solution advanced spray-drying process in closed mode using various phospholipid formulations and rationally chosen spray-drying pump rates. Ratios of dipalmitoylphosphatidylcholine (DPPC) and dipalmitoylphosphatidylethanolamine PEG (DPPE-PEG) with varying PEG lengths were mixed in a dilute methanol solution. Scanning electron microscopy images showed the smooth, spherical particle morphology of the inhalable particles. The size of the particles was statistically analyzed using the scanning electron micrographs and SigmaScan® software and were determined to be 600 nm to 1.2 μm in diameter, which is optimal for deep-lung alveolar penetration. Differential scanning calorimetry (DSC) and powder X-ray diffraction (PXRD) were performed to analyze solid-state transitions and long-range molecular order, respectively, and allowed for the confirmation of the presence of phospholipid bilayers in the solid state of the particles. The residual water content of the particles was very low, as quantified analytically via Karl Fischer titration. The composition of the particles was confirmed using attenuated total-reflectance Fourier-transform infrared (ATR-FTIR) spectroscopy and confocal Raman microscopy (CRM), and chemical imaging confirmed the chemical homogeneity of the particles. The dry powder aerosol dispersion properties were evaluated using the Next Generation Impactor™ (NGI™) coupled with the HandiHaler® dry powder inhaler device, where the mass median aerodynamic diameter from 2.6 to 4.3 μm with excellent aerosol dispersion performance, as exemplified by high values of emitted dose, fine particle fraction, and respirable fraction. Overall, it was determined that the pump rates defined in the spray-drying process had a significant effect on the solid-state particle properties and that a higher pump rate produced the most optimal system. Advanced dry powder inhalers of inhalable lipopolymers for targeted dry powder inhalation delivery were successfully achieved.
Introduction
The lung is an ideal target for targeted drug delivery, due to the potential to deliver therapeutic aerosols, which allows for uniform drug distribution, the avoidance of first-pass metabolism, a rapid onset of action, and high drug concentrations within the lung.Citation1–Citation4 Furthermore, the presence of drug at the site of pathology with minimal systemic absorption leads to decreased side effects.Citation5 Inhalation aerosols enable therapeutic effects to be achieved at much lower drug doses compared to other routes of administration offering inherently longer residence time in the lungs, which can reduce dosing frequency and increase patient compliance.Citation2,Citation5–Citation8 Aerosol formulations have been investigated for many pulmonary diseases including cystic fibrosis, asthma, chronic obstructive pulmonary disease, lung infections, and lung cancer.Citation9–Citation15 Inhalation aerosols for the treatment of pulmonary diseases date back to ancient timesCitation7,Citation16 and many inhalation products exist, of which dry powder inhalers (DPIs) are the fastest-growing segment. DPI formulations offer many advantages, including storing the drug in a dry state, leading to long-term stability,Citation17 the ability to encapsulate various types of therapeutics,Citation18 and the ease of DPI implementation.Citation6,Citation19
Dry powder aerosol formulations of nanoparticles and microparticles are of significant interest for direct lung delivery.Citation14,Citation20,Citation21 In particular, the use of phospholipids as multifunctional biocompatible biodegradable excipients for the delivery of therapeutics to the lungs is an attractive option.Citation22 Phospholipids have been shown to improve particle migration to the lung periphery, owing to the reduction in surface tension provided by these biosurfactants,Citation23–Citation27 especially to poorly water-soluble drugs. The use of phospholipids in pulmonary delivery is logical in that lung surfactant is a mixture primarily comprised of phospholipids and smaller amounts of lung surfactant-specific surface-active proteins. In particular, dipalmitoylphosphatidylcholine (DPPC) is the primary phospholipid component in lung surfactant, making up 55%–60% of the mixture. DPPC serves a vital role in reducing the work of breathing, and pulmonary immunity modulation, and is used in several successful lung surfactant replacement nanopharmaceutical products.Citation14 In addition to DPPC being an innate component of the lung, it offers advantages in drug delivery owing to its transition temperature. Transition temperatures of phospholipids are highly dependent on the saturation and length of carbon chains and DPPC (a diacyl 16-saturated carbon chain phospholipid) has a transition temperature of 41°C (above physiological body temperature of 37°C) when fully hydrated, which may offer controlled drug release.Citation1,Citation14,Citation28
The use of poly(ethylene glycol) (PEG)-based liposomal formulations has been motivated by the advantage of having biocompatible self-assembled drug-delivery systems that can evade the recognition and uptake by cells in the immune system while prolonging the residence time of the liposomes and providing sustained drug release.Citation14,Citation29–Citation32 In addition, PEG has been recently demonstrated to have inherent mucus-penetrating properties.Citation33 Unlike other types of inhaled particles, the fate of phospholipid-based particles can have a similar fate to native lipids. The processing, uptake, and recycling of phospholipid particles occurs through the same mechanism as endogenous surfactant via alveolar type II pneumocytes.Citation29 In addition, there are successful nanopharmaceutical products containing PEGylated phospholipid for intravenous administration, as it is an FDA-approved excipient.Citation14,Citation20,Citation21,Citation32 Sterically stabilized nanomicelles comprised of PEGylated phospholipids with encapsulated drug for the treatment of acute lung injury by the intravenous route have been reported.Citation34,Citation35
The spray-drying method is an advanced high-throughput pharmaceutical manufacturing process that is used to efficiently produce and tailor respirable particles in the solid state.Citation2,Citation8,Citation14,Citation36 Spray-drying has been used in the microencapsulation of bioactive molecules, as well as in the preparation of drug-delivery systems composed of a large variety of biodegradable polymers and excipients.Citation37–Citation39 It has also been used as a scalable method in the bulk preparation of drug–lipid mixtures.Citation37,Citation40,Citation41 The unique features and tunable parameters of spray-drying allow for the precise tuning of the particle properties as a result of rational design and engineering. The use of an organic solvent allows for much lower moisture content and smaller particle size (down to 400 nm). This along with the inherently lower surface tension of the solvent combined with dilute solution concentrations allows particle formulation in the solid state in the inhalable range.
The rational design and development of inhalable lung surfactant-mimic DPPC and PEGylated phospholipid with varying PEG chain length as respirable microparticles and nanoparticles as one-component spray-dried (SD) and two-component co-SD DPIs for targeted pulmonary nanomedicine are reported for the first time in this comprehensive and systematic study. The novel aspects of this study include organic solution advanced spray-drying in closed mode, the rational design and formulation of lung surfactant-mimic DPPC together with dipalmitoylphos-phatidylethanolamine (DPPE)-PEG of varying PEG chain lengths as respirable dry powder particles, optimization for targeted pulmonary nanomedicine delivery as inhalable microparticles and nanoparticles in the solid state, and systematic comprehensive analyses. The rational design and optimization of these advanced dry powder inhalation aerosol nanomedicine formulations as aerosolized lung surfactant-mimic and lipopolymers as DPIs is important to allow for better understanding of the physicochemical properties and interactions of these particles formulated by advanced organic spray-drying and co-spray-drying processes in closed mode. To the authors’ knowledge, this is the first report on a comprehensive and systematic study on the advanced formulation and characteristics of various combinations of DPPC and PEGylated phospholipids comprised of various PEG lengths for targeted pulmonary nanomedicine as inhaled dry powder aerosols.
Materials and methods
Materials
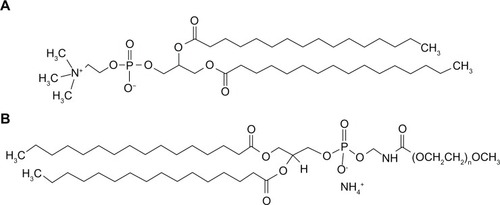
Synthetic DPPC (molecular weight 734.039 g/mol, >99% purity) and DPPE-PEG (molecular weights: 2749.391 g/mol, 3716.304 g/mol, and 5741.510 g/mol, which correspond to 2000, 3000, and 5000 molecular weight PEG lengths per compound; >99% purity) were obtained from Avanti Polar Lipids (Alabaster, AL). Their corresponding chemical structures are shown in (ChemSketch 12.01; Advanced Chemistry Development, Toronto, Canada). Methanol (high-performance liquid chromatography [HPLC] grade, American Chemical Society [ACS]-certified and chloroform [HPLC grade, ACS certified]) was obtained from Fisher Scientific (Pittsburgh, PA). Hydranal-Coulomat AD was from Sigma-Aldrich (St Louis, MO). Ultrahigh-purity (UHP) dry nitrogen gas was from Scott-Gross (Lexington, KY). All materials were used as stored in the freezer at –23°C and used as received.
Figure 1 Chemical structures of (A) dipalmitoylphosphatidylcholine and (B) dipalmitoylphosphatidylethanolamine methoxy-poly(ethylene glycol).
Notes: n = 45, 67, and 113 for 2000, 3000, and 5000 MW poly(ethylene glycol), respectively, where n denotes the number of ethylene glycol oligomers present.
Organic solution advanced spray-drying and co-spray-drying in closed mode from dilute solution
Advanced spray-drying of single-component DPPC and PEGylated phospholipids and co-spray drying of DPPC:PEGylated two-component systems from dilute organic solution was performed with a B-290 Büchi Mini Spray Dryer coupled with a B-295 Inert Loop and highperformance cyclone (all from Büchi Labortechnik, Flawil, Switzerland) in closed mode using UHP dry nitrogen gas as the atomizing gas. The feed solutions were prepared by dissolving various amounts of DPPC and/or DPPE-PEG in methanol to form dilute organic solutions of 0.1% w/v. Based on our previous organic solution advanced spray-drying work,Citation42 the following spray-drying conditions were used: atomization gas flow rate of 600 L/hour, aspiration rate of 35 m3/hour, inlet temperature of 150°C (maintained in the first spray-drying process), and three different pump rates, designated as “low P,” “med P,” and “high P” pump rates, which corresponded to 3 mL/minute (10%), 15 mL/minute (50%), and 30 mL/minute (100%), respectively. shows the various formulated particle systems and their corresponding DPPC and DPPE-PEG amounts and types, pump rates, and outlet temperatures (which represent the secondary drying process temperatures). The nozzle diameter (composed of stainless steel) was 0.7 mm, and the spray-dried particles were separated from the drying gas (UHP nitrogen) in the high-performance cyclone and collected in a sample collector. All SD and co-SD powders were stored in glass vials sealed with parafilm in glass desiccators over Drierite (Xenia, OH) desiccant in the freezer at –23°C under ambient pressure.
Table 1 Formulated spray-dried and co-spray-dried particle systems, their corresponding DPPC and/or DPPE-PEG amounts, and spray-drying conditions where low P, medium P, and high P correspond to 10%, 50%, and 100% pump rates, respectively
Scanning electron microscopy for morphology and shape analysis
The shape and surface morphology of particles was evaluated by scanning electron microscopy (SEM), using a Hitachi S-4300 microscope (Tokyo, Japan). Samples were placed on double-sided adhesive carbon tabs and were adhered to aluminum stubs (TedPella, Redding, CA) which were coated with a gold/palladium alloy thin film using an Emscope SC400 sputter coating system at 20 μA for 1 minute under argon gas. The electron beam with an accelerating voltage of 5–10 kV was used at a working distance of 13.3–15.3 mm. Images were captured at several magnifications.
Particle sizing and size distribution using SEM
The mean size, standard deviation, and size range of the particles were determined digitally using SigmaScan® 5.0 software (Systat, San Jose, CA). Representative micrographs for each particle sample at 5000× magnification were analyzed by measuring the diameter of at least 100 particles per image with the SigmaScan software.
Powder X-ray diffraction
Using similar conditions previously reported by the authors,Citation42 powder X-ray diffraction (PXRD) patterns of powder samples were measured by a Rigaku Multifex X-ray diffractometer (The Woodlands, TX) with a slit-detector Cu Kα radiation source (40 kV, 44 mA, and λ = 1.5406 Å). The scan range was 5.0–50.0 2θ (°) with a scan rate of 2.0°/minute at ambient temperature. The sample was placed on a horizontal quartz glass sample holder plate.
Differential scanning calorimetry
Thermal analysis and phase-transition measurements were carried out using a TA Q200 differential scanning calorimetry (DSC) system (TA Instruments, New Castle, DE) equipped with T-Zero® technology and an automated computer-controlled RSC-90 cooling accessory. Using similar conditions previously reported by the authors,Citation42 1–3 mg of powder was weighed into hermetic anodized aluminum T-Zero® DSC pans and were hermetically sealed with the T-Zero® hermetic sealer. UHP dry nitrogen gas was used as the purging gas at 50 mL/minute. The heating range was 0°C-250°C at a heating scan rate of 5.00°C/minute.
Karl Fischer coulometric titration
The water content of all powders was chemically quantified by Karl Fisher (KF) coulometric titration, using similar conditions previously reported by the authors.Citation42 The measurements were performed with a 737 KF Coulometer coupled with 703 Ti Stand (Metrohm, Antwerp, Belgium). Approximately 5 mg of powder was dissolved in a known volume of chloroform. The sample solution was injected into the reaction cell that contained Hydranal KF reagent and the water content was then calculated from the resulting reading.
Attenuated total-reflectance fourier-transform infrared spectroscopy
Attenuated total-reflectance Fourier-transform infrared spectroscopy (ATR-FTIR) was performed using a Varian 7000e step-scan spectrometer (Agilent Technologies, Santa Clara, CA). The powder was placed on the diamond ATR crystal, covered with a glass coverslip, and held in place with a specialized clamp. ATR crystal and IR spectra were obtained at an 8 cm−1 spectral resolution between 700 and 4000 cmr−1. The data were collected and analyzed using Varian Resolutions software.
Hot-stage microscopy under cross-polarizers
Using similar conditions previously reported by the authors,Citation42 hot-stage microscopy (HSM) studies were completed using a BX51 polarized microscope (Olympus, Tokyo, Japan) equipped with an Instec STC200 heating unit and S302 hot stage (Boulder, CO). The polarized light was filtered by a γ 530 nm U-TP530 filter lens. Powder samples were mounted on a cover glass and heated from 25°C to 250°C at a heating scan rate of 5°C/minute. The heating program was controlled by WinTemp software, and images were digitally captured via a SPOT Insight digital camera (Diagnostic Instruments, Sterling Heights, MI).
Confocal Raman microscopy and spectroscopy
Confocal Raman microspectroscopy (CRM) was performed using an Aramis confocal dispersive Raman spectrometer and fluorescence microscope system (Horiba Jobin Yvon, Edison, NJ), using similar conditions previously reported by the authors.Citation43 The system is equipped with an Olympus BX41 confocal optical microscope and an Olympus U-LH 100 W Hg lamp and U-RFL-T power source used for fluorescence excitation and bright-field illumination. All optical images and Raman spectra were obtained using a 50× objective. Raman spectra and spectral maps were acquired using a 633 nm HeNe laser. Spectral maps were obtained with the stage moved in increments of 2 μm. Each map point was acquired using 2 seconds of detector exposure time, with 32 accumulations acquired per point using a grating of 600 grooves/mm and a center wavenumber of 1200 cmr1 (for spectra in the fingerprint region) and two accumulations acquired per point, with a grating of 950 grooves/mm and a center wavenumber of 2900 cmr–1 (for the C–H stretching region). A confocal hole of 500 μm and a slit width of 100 μm were used. Spectra covering the range of 200–4000 cmr–1 were obtained in automatic scanning mode using the 950 groove/mm grating. Spectra were subjected to baseline correction and smoothing prior to further analysis.
Aerosol dispersion performance analysis by Next Generation Impactor™ (NGI™)
In accordance with the United States Pharmacopeia chapter 601 specifications on aerosols,Citation44 the aerosol-dispersion properties of the dry powder particles as DPIs were determined using the Next Generation Impactor™ (NGI™) with a stainless steel induction port (ie, United States Pharmacopeia throat) attachment (model 170; MSP, Shoreview, MN), equipped with specialized stainless steel NGI™ gravimetric insert cups (MSP). The NGI™ was coupled with a Copley TPK 2000 critical flow controller (Copley Scientific, Nottingham, UK), which was connected to an HCP5 vacuum pump (Copley Scientific). The airflow rate, Q, was measured and adjusted prior to each experiment using a DFM 2000 flow meter (Copley Scientific).
The aerosolization studies were experimentally designed by Design Expert® 8.0.7.1 software (Stat-Ease, Minneapolis, MN). Glass-fiber filters (55 mm, type A/E; Pall Life Sciences, Exton, PA) were placed in the stainless steel NGI™ gravimetric insert cups for NGI™ stages 1–7 to minimize bounce or reentrapment.Citation45 Three hydroxypropyl methylcellulose hard capsules (size 3, Quali-V®; Qualicaps, Whitsett, NC) were each loaded with 10 mg of powder and were then loaded into a high-resistance (ie, high sheer stress) human DPI device, the HandiHaler® (Boehringer Ingelheim, Ridgefield CT), and tightly inserted into the induction port. The NGI™ was run at a controlled flow rate at Q = 60 L/minute with a delay time of 10 seconds (NGI™ Flow controller) prior to the capsules being needle-pierced open by the HandiHaler® mechanism, where the particles were then drawn into the inertial impactor for 10 seconds. This was done with a total of three capsules per sample for a total of 30 mg total per run. For each 30 mg run, the amount of particles deposited onto each stage was determined gravimetrically by measuring the difference in mass of the glass filters after particle deposition. For the NGI™ Q = 60 L/minute, the effective cutoff diameters for each impaction stage were calibrated by the manufacturer and stated as: Stage 1 (8.06 μm); Stage 2 (4.46 μm); Stage 3 (2.82 μm); Stage 4 (1.66 μm); Stage 5 (0.94 μm); Stage 6 (0.55 μm); and Stage 7 (0.34 μm). The fine particle dose (FPD), fine particle fraction (FPF), respirable fraction (RF), and emitted dose (ED) were calculated as follows:
The mass mean aerodynamic diameter (MMAD) and geometric standard deviation (GSD) were determined using a mathematical program written by Dr Warren Finlay. All experiments were triplicated (n = 3).
Results
SEM, particle sizing, and size distribution
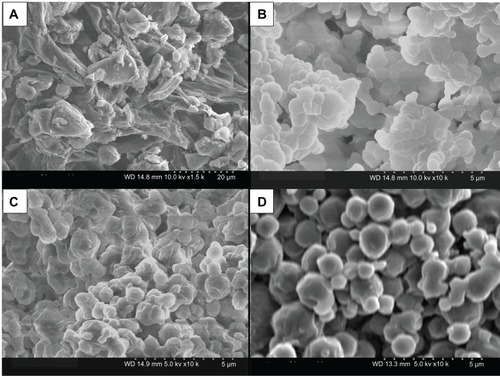
Formulated particle and surface morphologies were visualized and analyzed via SEM. – include SEM micrographs of the particles at 10,000× and corresponding raw DPPC or DPPE-PEG at 1000×. Their corresponding size (diameter), standard deviation, and range are exhibited in , as determined using SigmaScan® software. 100 DPPC (pure one-component DPPC)-formulated particles are smooth and spherical, and their diameter increased with increasing pump rate (diameters of 0.642 ± 0.188, 0.790 ± 0.292, and 0.960 ± 0.499 μm for low P, medium P, and high P, respectively). Formulated 95 DPPC:5 DPPE-PEG2k particle size also increased with increasing pump rate; however, only the high P formulation exhibited spherical morphology and a diameter of 1.166 ± 0.676 μm. Low P and high P particle systems were rough and agglomerated and their diameter could not be determined. Similarly, 95 DPPC:5 DPPE-PEG3k and 95 DPPC:5 DPPE-PEG5k formulated particle sizes increased with increasing pump rate, and the high P formulations were spherical with diameters of 1.200 ± 0.931 μm and 1.161 ± 0.595 μm, respectively. The low P and medium P formulations for both systems were agglomerated and rough, and their diameters were not determined. Also, the surface roughness of the high P particle formulations seemed to be rough. This was a result of charging of the particles during SEM, as their initial morphology prior to image capture was smooth and spherical. Overall, the particle sizes exhibited by all formulated microparticulate/nanoparticulate powders were in the respirable size range.
Table 2 Particle-size parameters of spray-dried DPPC and co-spray-dried DPPC:DPPE-PEG particles (mean ± standard deviation)
Figure 2 (A–D) Scanning electron micrographs of raw dipalmitoylphosphatidylcholine (DPPC) and spray-dried 100 DPPC particles at three pump rates. (A) Raw DPPC, magnification 1000×; (B) DPPC particles at 10% (low P) pump rate, magnification 10,000×; (C) DPPC particles at 50% (medium P) pump rate, magnification 10,000×; (D) DPPC particles at 100% (high P) pump rate, magnification 10,000×.
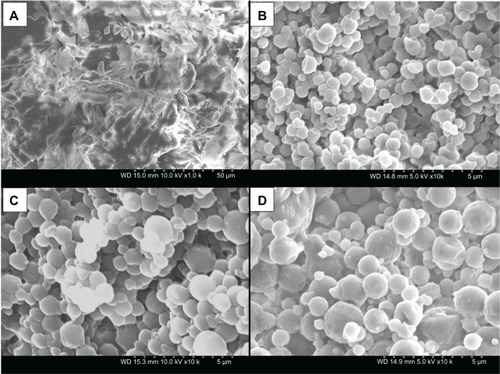
Figure 3 (A–D) Scanning electron micrographs of raw dipalmitoylphosphatidylethanolamine poly(ethylene glycol)-2k 95 DPPC:5 DPPE-PEG2k and co-spray-dried 95 dipalmitoylphosphatidylcholine (DPPC):5 DPPE-PEG 2k particles at three pump rates. (A) Raw DPPE-PEG2k, magnification 1000×; (B) 95 DPPC:5 DPPE-PEG2k particles at 10% (low P) pump rate, magnification 10,000×; (C) 95 DPPC:5 DPPE-PEG2k particles at 50% (medium P) pump rate, magnification 10,000×; (D) 95 DPPC:5 DPPE-PEG2k particles at 100% (high P) pump rate, magnification 10,000×.
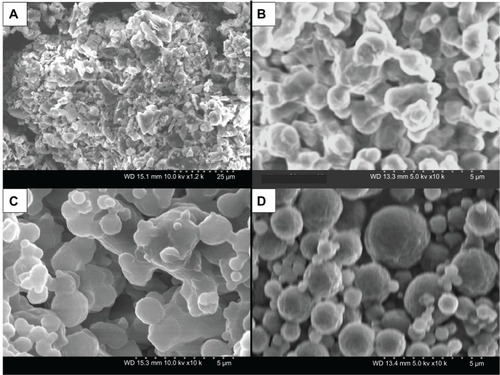
Figure 4 (A–D) Scanning electron micrographs of raw dipalmitoylphosphatidylethanolamine poly(ethylene glycol)-3k (DPPE-PEG3k) and co-spray-dried 95 dipalmitoylphosphatidylcholine (DPPC):5 DPPE-PEG3k particles at three pump rates. (A) Raw DPPE-PEG3k, magnification 1000×; (B) 95 DPPC:5 DPPE-PEG3k particles at 10% (low P) pump rate, magnification 10,000×; (C) 95 DPPC:5 DPPE-PEG3k particles at 50% (medium P) pump rate, magnification 10,000×; (D) 95 DPPC:5 DPPE-PEG3k particles at 100% (high P) pump rate, magnification 10,000×.
Figure 5 (A–D) Scanning electron micrographs of raw dipalmitoylphosphatidylethanolamine poly(ethylene glycol)-5k (DPPE-PEG5k) and co-spray-dried 95 dipalmitoylphosphatidylcholine (DPPC):5 DPPE-PEG 5k particles at three pump rates. (A) Raw DPPE-PEG5k, magnification 1000×; (B) 95 DPPC:5 DPPE-PEG 5k particles at 10% (low P) pump rate, magnification 10,000×; (C) 95 DPPC:5 DPPE-PEG 5k particles at 50% (medium P) pump rate, magnification 10,000×; (D) 95 DPPC:5 DPPE-PEG 5k particles at 100% (high P) pump rate, magnification 10,000×.
Powder X-ray diffraction
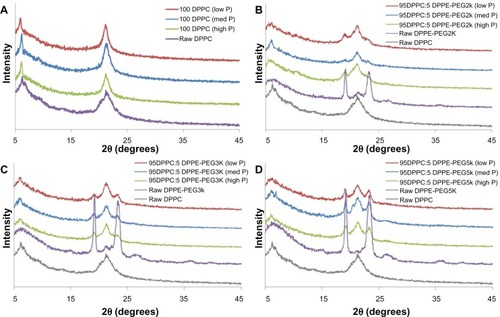
Powder X-ray diffractograms () showed the presence of a strong peak at 21° 2Θ for both raw DPPC and all formulated 100 DPPC particles, which corresponds to the presence of the lipid bilayer.Citation37 Raw DPPE-PEG showed the presence of strong peaks at 19° and 23° 2Θ, a small peak at 21° 2Θ, and smaller broad peaks above 25° 2Θ. The peaks at 19°, 23°, and above 25° 2Θ are similar to previous results for PEG powder,Citation46 whereas the peak at 21° 2Θ corresponds to the presence of a phospholipid bilayer. Upon spray-drying, the peaks above 25° 2Θ disappeared, whereas the peaks at 19° and 23° 2Θ remained for all formulated particle systems. Furthermore, the peak present at 21° 2Θ increased due to the influence of DPPC in the particle formulation. Although there was no correlation in peak intensity with spray-drying pump rates, the intensity of the peaks corresponding to PEG increased with increasing PEG chain length for the raw DPPE-PEG compounds.
Figure 6 Powder X-ray diffractograms of: (A) formulated spray-dried (SD) dipalmitoylphosphatidylcholine (DPPC) particles at three pump rates versus raw DPPC; (B) formulated co-SD DPPC: dipalmitoylphosphatidylethanolamine poly(ethylene glycol)-2k (DPPE-PEG2k) particles at three pump rates versus raw DPPC and raw DPPE-PEG2k; (C) formulated co-SD DPPC:DPPE-PEG3k particles at three pump rates versus raw DPPC and raw DPPE-PEG3k; (D) formulated co-SD DPPC:DPPE-PEG5k particles at three pump rates versus raw DPPC and raw DPPE-PEG5k.
Note: Low P, med P, and high P correspond to 10%, 50%, and 100% pump rates, respectively.
Differential scanning calorimetry
DSC thermograms for formulated particles and their corresponding raw counterparts can be seen in . Raw DPPC exhibited three endothermic peaks, including a crystal-to-gel (Tc) bilayer phase transition at ~47.1°C, pretransition peak corresponding to a gel-to-ripple (Tp) phase at ~67.0°C, and the bilayer main phase transition (Tm) to the liquid crystalline phase at ~72.0°C, where the hydrophobic acyl chain core melted. This is consistent with our earlier findings on raw DPPC powder.Citation24 The phase behavior of solid-state DPPC, fully hydrated DPPC, and at varying levels of water content in the solid state have been previously reported by the authors.Citation24–Citation26 Formulated 100 DPPC particles exhibited the characteristic bilayer main transition phase (Tm) at ~68°C, which corresponds to the bilayer main transition phase of raw DPPC confirming the presence of the phospholipid bilayer. The bilayer phase temperatures for SD DPPC were slightly lower than that of the raw DPPC, and it was determined that the heat of fusion of the formulated particles increased with increasing pump rate (24.8, 29.2, and 36.1 J/g for low P, medium P, and high P, respectively). Neither Tc nor Tp were observed in the thermograms for the SD DPPC particles, indicating that spray-drying rendered the bilayers in the gel state (not the crystalline state, as was observed with raw DPPC). All DPPC systems underwent decomposition around 160°C.
Figure 7 Differential scanning calorimetry thermograms of: (A) formulated spray-dried (SD) dipalmitoylphosphatidylcholine (DPPC) particles at three pump rates versus raw DPPC; (B) formulated co-SD DPPC:dipalmitoylphosphatidylethanolamine poly(ethylene glycol)-2k (DPPE-PEG2k) particles at three pump rates versus raw DPPE-PEG2k; (C) formulated co-SD DPPC:DPPE-PEG3k particles at three pump rates versus raw DPPE-PEG3k; (D) formulated co-SD DPPC:DPPE-PEG5k particles at three pump rates versus raw DPPE-PEG5k.
Note: Low P, med P, and high P correspond to 10%, 50%, and 100% pump rates, respectively.
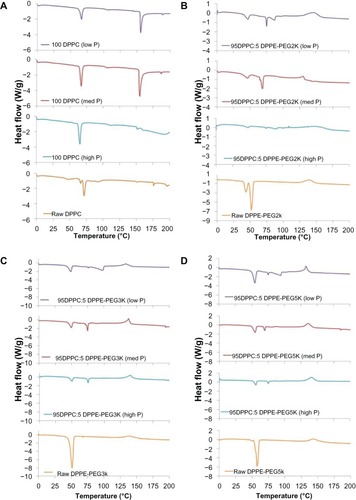
Raw DPPE-PEG2k exhibited two endothermic peaks, including a pretransition peak at 43.5°C and main phase transition at ~52.1°C. The co-SD 95 DPPC:5 DPPE-PEG2k particle systems exhibited two endothermic peaks: the first around 47°C, which corresponds to the DPPE-PEG main phase transition (Tc), and the second in the range of 70°C–75°C, which corresponds to the DPPC bilayer main phase transition – Tm. Furthermore, the low P sample exhibited a third endotherm near 90°C. Raw DPPE-PEG3k exhibited a single endothermic peak at 52.0°C, corresponding to the main phase transition. The 95 DPPC:5 DPPE-PEG3k particles exhibited two endothermic peaks near 49.5°C (corresponding to the DPPE-PEG3k transition phase) and 74°C (corresponding to the DPPC bilayer phase transition). For the DPPC bilayer phase transition peaks, the heat of fusion increased with increasing pump rate at 2.0, 10.7, and 17.0 J/g for low P, medium P, and high P, respectively. The low P particles had a third endotherm near 100°C. Similarly, raw DPPE-PEG5k exhibited a pretransition peak at 48.3°C and main phase transition at 57.9°C. The 95 DPPC:5 DPPE-PEG5k particles showed two endothermic peaks at 55.3°C and 73°C, which corresponded to the main phase transition of DPPE-PEG5k and DPPC, respectively. For the DPPC bilayer phase transition peaks, the heat of fusion increased with increasing pump rate at 2.6, 11.0, and 14.7 J/g for low P, medium P, and high P, respectively. The low P particles had a third endotherm near 100°C.
For the main phase transition temperatures corresponding to the DPPE-PEG peaks (first endotherms for formulated co-SD DPPC:DPPE-PEG particles), the temperature increased with increasing PEG molecular weight. Also, the peaks corresponding to DPPE-PEG in the formulated co-SD powders are broader and result in high heats of fusion in comparison to the DPPC-related peaks. Furthermore, all formulated co-SD 95 DPPC:5 DPPE-PEG and raw DPPE-PEG samples decomposed above 130°C.
Karl Fischer coulometric titration
The residual water content in the solid state of the formulated particles and their raw components are shown in . The water content of raw DPPC was 1.74% ± 0.15% (w/w) and ranged from 4.59% to 5.17% (w/w) for SD 100 DPPC particles. The water content for raw DPPE-PEG2k was 0.70% ± 0.21% (w/w) and ranged from 1.29% to 3.13% (w/w) for formulated co-SD 95 DPPC:5 DPPE-PEG2k particles. For raw DPPE-PEG3k, the water content was 0.60% ± 0.12% (w/w) and for formulated co-SD 95 DPPC:5 DPPE-PEG3k, particles ranged from 2.82% to 4.34% (w/w). Finally, the water content for raw DPPE-PEG5k was 1.01% ± 0.65% (w/w), whereas it ranged from 1.46% to 3.11% (w/w) for the formulated co-SD 95 DPPC:5 DPPE-PEG5k particles. There was no trend in the water-content values for formulated systems based on the spray-drying pump rates or type of DPPE-PEG used. All water-content values were low and well within an acceptable range for inhalable dry powder formulations.
Table 3 Water content of formulated spray-dried DPPC and co-spray-dried DPPC:DPPE-PEG particles and their raw counterparts analyzed via Karl Fischer coulometric titration (mean ± standard deviation, n = 3)
Cross-polarizing light hot-stage microscopy
Representative micrographs of raw DPPE-PEG3k and formulated co-SD 95 DPPC:5 DPPE-PEG3k (high P) particles are shown in and , respectively. Raw DPPE-PEG3k showed dark agglomerates lacking birefringency between 25°C and 55°C, which indicated a noncrystalline, amorphous material. A phase transition was visualized by HSM near 57°C to 58°C, which likely corresponded to the gel to liquid-crystal transition, as shown in the DSC thermogam at 52°C for raw DPPE-PEG3k in . Melting was visualized starting at 60°C by the formation of liquid droplets, with decomposition occuring above 150°C.
Figure 8 Representative hot-stage micrographs for raw dipalmitoylphosphatidylethanolamine poly(ethylene glycol)-3k.
Note: Scale bar = 3 mm.
Figure 9 Representative hot-stage micrographs for co-spray-dried 95 dipalmitoylphosphatidylcholine:5 dipalmitoylphosphatidylethanolamine poly(ethylene glycol)-3k (high P) particles.
Note: Scale bar = 3 mm.
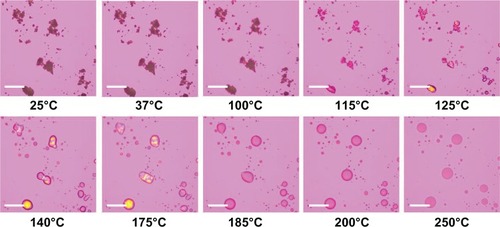
The micrographs for co-SD 95 DPPC:5 DPPE-PEG3k (high P) particles also showed dark agglomerates lacking birefringency between 25°C and 100°C, which indicated a noncrystalline, amorphous material. No visible phase transition was evident and melting started around 115°C, as shown by liquid droplet formation. Decomposition was evident above 185°C. This behavior corresponds closely to that observed for raw DPPC (data not shown), which is the primary component of these particles.
Attenuated total-reflectance fourier-transform infrared spectroscopy
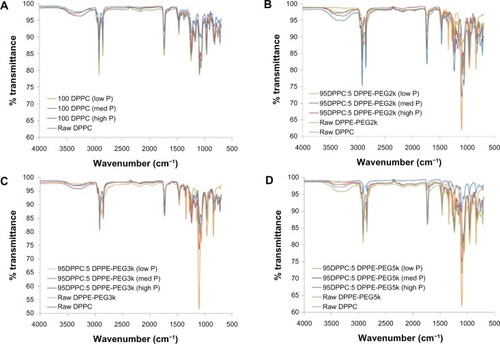
Formulated particles and their raw counterparts underwent ATR-FTIR analysis to determine the functional groups present in the systems, as shown in . For both the raw DPPC and SD 100 DPPC particles, the spectra indicated the same characteristic peaks for all systems and were the same as in previously reported literature.Citation47 The spectra for formulated co-SD 95 DPPC:5 DPPE-PEG particles, however, exhibited peaks corresponding to DPPC and/or DPPE-PEG. Interestingly, the characteristic peaks shown for raw DPPE-PEG were the same as previously shown for pure PEG,Citation48 showing the strong influence of the PEG presence in the analysis of these systems. Although there is the absence of a broad water peak (3200–3400 cm–1) for the raw DPPE-PEGs, this peak was present in both the raw DPPC and SD 100 DPPC particles as well as the formulated co-SD 95 DPPC:5 DPPE-PEG particles. While certain peaks relating to characteristic functional groups relate to DPPC or DPPE-PEG only, some are shared by both and have an influence on the formulated co-SD DPPC:DPPE-PEG particles. For instance, peaks present in the formulated DPPC:DPPE-PEG particles that are due to the influence of DPPC include those at 2924 cm–1 (–CH2 antisymmetrical stretching), 2852 cm–1 (–CH2 symmetrical stretching), 1250–1350 cm–1 (P=O stretching), and 721 cm–1 (–N+[CH3]3 symmetrical stretching). Peaks due to the influence of DPPE-PEG (PEG) include 2870 cm–1 (–CH3 symmetrical stretching), 1342 cm–1 (alcohols), and 1276 cm−1 (ethers). Peaks in the formulated particles due to the influence of DPPC and/or DPPE-PEG (present in all three) include 1720–1735 cm−1 (C–O ester stretching), 1465 cm−1 (–CH2 deformation, 1050–1150 cm−1 (–C–C–) and 960 cm−1 (–N+[CH3]3) antisymmetrical stretching).
Figure 10 Attenuated total-reflectance Fourier-transform infrared spectra of: (A) formulated spray-dried (SD) dipalmitoylphosphatidylcholine (DPPC) particles at three pump rates versus raw DPPC; (B) formulated co-SD DPPC:dipalmitoylphosphatidylethanolamine poly(ethylene glycol)-2k (DPPE-PEG2k) particles at three pump rates versus raw DPPC and raw DPPE-PEG2k; (C) formulated co-SD DPPC:DPPE-PEG3k particles at three pump rates versus raw DPPC and raw DPPE-PEG3k; (D) formulated co-SD DPPC:DPPE-PEG5k particles at three pump rates versus raw DPPC and raw DPPE-PEG5k.
Note: Low P, med P, and high P correspond to 10%, 50%, and 100% pump rates, respectively.
Confocal Raman microscopy and chemical imaging
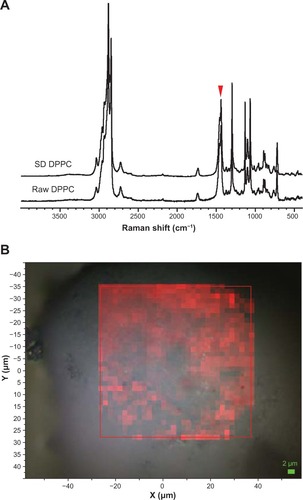
Confocal Raman microscopy (CRM) and chemical imaging was performed first on raw DPPC for comparison with formulated SD DPPC particles. The results are shown in . The full-range Raman spectra obtained via the microscope at several different points showed no difference between the raw and SD DPPC, as seen in the selected spectra shown in . Two 32 × 32 maps were made at regions of the Raman spectrum centered at 2900 and 1200 cm−1. A representative map of the region between 1400 and 1520 cm−1 is shown in and illustrates the observed results. The intensity variation observed in the red map was minor and showed no evidence of inhomogeneity within the particle. The variation is likely caused by sample height effects and minor density variations within the particle.
Figure 11 (A) Raman spectra obtained via confocal microscopy of raw dipalmitoylphosphatidylcholine (DPPC) and formulated spray-dried (SD) DPPC at 100% pump rate. The colored arrowhead shows the mapped bands. (B) Raman spectroscopic mapping showing the area of the Raman bands between 1400 and 1520 cm−1 (brighter-red colors indicate greater area) superimposed on a bright-field optical image of the surface of a particle of formulated SD DPPC (100% pump rate).
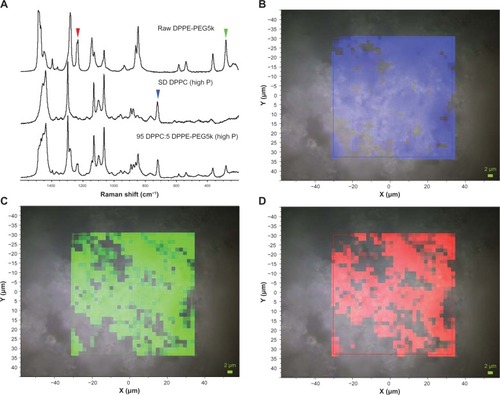
Raman microscopy and chemical imaging was also used to assess the homogeneity of formulated co-SD 95 DPPC:5 DPPE-PEG2k (high P) particles. Bands were identified that were specific for DPPC and DPPE-PEG2k, as shown in . Two regions were selected that were specific for DPPE-PEG2k, between 270 and 295 cm−1 and between 1225 and 1250 cm−1. For DPPC, a band at 700 and 740 cm−1 was chosen. The areas of these bands were extracted from a 32 × 32 Raman spectral map, and are shown in –D. The blue, green, and red maps align with the bands denoted by colored arrowheads in . The map intensity observed for the selected bands, which are specific to the two chemical components of the particle, is seen to correlate between the three maps, indicating that DPPC and DPPE-PEG2k are similarly distributed in the particle at the resolution limit of Raman microscopy. Variations in the band area are caused by sample height effects and density variations within the mapped particle. Formulated co-SD 95 DPPC:5 DPPE-PEG3k (high P) particles were examined in a similar manner using the same set of Raman bands, leading to the results shown in . Again, the colored maps correlate with each other and indicate that DPPC and DPPE-PEG3k are distributed similarly. Formulated 95 DPPC:5 DPPE-PEG5k (high P) particles were also examined using the same approach, as shown in , and also indicated a homogenous distribution of DPPC and DPPE-PEG5k.
Figure 12 (A) Raman spectra obtained via confocal microscopy of raw dipalmitoylphosphatidylethanolamine poly(ethylene glycol)-2k (DPPE-PEG2k), formulated spray-dried (SD) dipalmitoylphosphatidylcholine (DPPC), and formulated co-SD 95 DPPC:5 DPPE-PEG2k (high P). Colored arrowheads show mapped bands. (B) Raman spectroscopic mapping showing the area of the Raman bands between 700 and 740 cm−1 (brighter colors indicate greater area) superimposed on a bright-field optical image of the surface of a particle of formulated SD DPPC (100% pump rate). (C) Map showing the area of the Raman bands between 270 and 295 cm−1. (D) Map showing the area of the Raman bands between 1225 and 1250 cm−1.
Figure 13 (A) Raman spectra obtained via confocal microscopy of raw dipalmitoylphosphatidylethanolamine poly(ethylene glycol)-3k (DPPE-PEG3k), formulated spray-dried (SD) dipalmitoylphosphatidylcholine (DPPC), and formulated co-SD 95 DPPC:5 DPPE-PEG3k (high P). Colored arrowheads show mapped bands. (B) Raman spectroscopic mapping showing the area of the Raman bands between 700 and 740 cm−1 (brighter colors indicate greater area) superimposed on a bright-field optical image of the surface of a particle of formulated SD DPPC (100% pump rate). (C) Map showing the area of the Raman bands between 270 and 295 cm−1. (D) Map showing the area of the Raman bands between 1225 and 1250 cm−1.
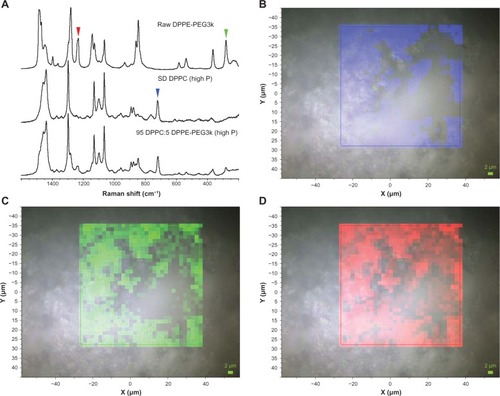
Figure 14 (A) Raman spectra obtained via confocal microscopy of raw dipalmitoylphosphatidylethanolamine poly(ethylene glycol)-5k (DPPE-PEG5k), formulated spray-dried (SD) dipalmitoylphosphatidylcholine (DPPC), and formulated co-SD 95 DPPC:5 DPPE-PEG5k (high P). Colored arrowheads show mapped bands. (B) Raman spectroscopic mapping showing the area of the Raman bands between 700 and 740 cm−1 (brighter colors indicate greater area) superimposed on a bright-field optical image of the surface of a particle of formulated SD DPPC (100% pump rate). (C) Map showing the area of the Raman bands between 270 and 295 cm−1. (D) Map showing the area of the Raman bands between 1225 and 1250 cm−1.
Aerosol dispersion performance analysis using the Next Generation Impactor™ (NGI™)
The aerosol properties of the formulated particles produced at the highest pump rate (high P) were evaluated using an NGI coupled with the HandiHaler® DPI device (FDA-approved). The MMAD and geometric standard deviation values were similar for all four systems that were analyzed, ranging between 4.0 and 4.5 μm and 2.1 and 2.7 μm, respectively. The fine-particle dose increased upon using PEGylated phospholipids where SD 100 DPPC was 23.8% and co-SD 95 DPPC:5 DPPE-PEG2k, 3k, and 5k were 29.4%, 30.2%, and 29.5%, respectively. The ED was similar for all four systems, ranging from 91.2% to 94.2%, whereas the RF% increased with increasing PEGylation of the particles. These RF% values were 60.3% for SD 100 DPPC and co-SD 95 DPPC:5 DPPE-PEG2k, 3k, and 5k were at 68.7%, 71.7% and 75.5%, respectively. demonstrates the actual aerosol dispersion performance of the engineered dry powder microparticulate/nanoparticulate aerosols showing the % deposition on each NGI™ stage. Aerosol deposition on each NGI™ stage is measured, and in particular deposition on the lower stages of stage 2 all the way to stage 7 (lowest stage) is observed.
Figure 15 Aerosol-dispersion performance as % deposition on each stage of the Next Generation Impactor at Q = 60 L/minute for: (A) 100 dipalmitoylphosphatidylcholine (DPPC) (high P), (B) 95 DPPC:5 dipalmitoylphosphatidylethanolamine poly(ethylene glycol)-2k (DPPE-PEG2k) (high P), (C) 95 DPPC:5 DPPE-PEG3k (high P), and (D) 95 DPPC:5 DPPE-PEG5k (high P).
Note: High P correspond to 100% pump rate.
Discussion
This comprehensive and systematic study illustrates the physicochemical properties of DPPC and DPPC:DPPE-PEG microparticles and nanoparticles rationally designed for the first time by an organic solution closed-mode advanced spray-drying. Furthermore, this study also demonstrates for the first time their aerosol dispersion performance as DPIs for targeted pulmonary nanomedicine delivery, with excellent properties for high aerosol dispersion performance as dry powder inhalation aerosols. A systematic experimental design resulted in the successful design, development, and optimization of twelve particle systems, which included pure one-component SD DPPC particles and two-component co-SD 95 mole% DPPC:5 mole% DPPE-PEG DPI particles (using three different PEG chain lengths) at three different pump rates. This study strived to elucidate the effects of the presence of DPPE-PEG, PEG chain length, and the effects of the pump rate.
Overall, the use of dilute organic solution (such as alcohols, which are considered “green” chemicals) imparts a smaller primary droplet size by virtue of lower surface tension in the range of 20–25 mN/m (in contrast to water, which has a high surface tension of 72 mN/m and hence produces larger primary droplets) with rationally designed advanced spray-drying conditions resulted in the optimization of particle characteristics necessary for effective dry powder delivery. In addition, organic solution advanced spray-drying in closed mode eliminates the need for water and minimizes the residual water content in the final powder. This is an important and novel aspect reported here, as minimizing the residual water content in the solid state improves aerosol dispersion performance and promotes solid-state stability. SEM analysis showed that the particles exhibited an ideal size range (0.5–1.5 μm), which is comparable to respirable treha-lose dry powder particles in the 0.75–0.99 μm range made by the novel process of organic solution advanced spray-drying in closed-mode, as earlier reported by these authors.Citation49 The size and morphology of particles utilized in the inhalation application is paramount in ensuring targeted delivery to specific lung regions, since particles in the stated size range are capable of delivering a payload to a specific lung region (such as the deep lung).Citation17,Citation45,Citation50–Citation52 While all particles that had measurable sizes were within an ideal size range, the morphology exhibited was not smooth and without agglomeration for the entire set of particles. In particular, SD particles that underwent the highest spray-drying rate of 30 mL/minute (high P systems) had the best morphology, whereas the low P and medium P systems were rough and agglomerated, which would limit the aerosolization and delivery of these particles via inhalation methods. Overall, the highest pump rate resulted in the most optimal particle set.
PXRD and DSC analysis showed that the organic solution advanced spray-drying in closed mode of dilute solutions with DPPC and/or DPPE-PEG resulted in particles that demonstrated the presence of the lipid bilayer structure (multilamellar) as evidence of the signature peaks for PXRD and the characteristic bilayer phase-transition values of Tc, T p, and Tm, in DSC thermograms.Citation24–Citation26 PXRD data were the same for both the raw and SD particles and proved the presence of both the lipid bilayer(s) and PEG within the SD systems, which were not affected by a change in pump rates. A relationship was seen between the intensity of the PXRD peaks corresponding to PEG (at 19° and 23° 2θ) and the PEG chain length, where the intensity increased with increasing PEG chain length. DSC thermograms of pure SD DPPC particles showed similar Tm values irrespective of spray-drying pump rates, which corresponded to raw DPPC without a pretransition peak. This bilayer phase transition was also present in co-SD DPPC:DPPE-PEG particles along with a secondary endothermic peak, which corresponded to that of pure raw DPPE-PEG, neither of which was dependent on the pump rate. The relationship between the endothermic peak values exhibited by the particles and the outlet temperatures from the spray-drying process was likely a significant factor in the successful formation of multilamellar particles using the fastest pump rate. The outlet temperatures for the low and medium pump rates (3 and 15 mL/minute, respectively) were above the phase-transition temperatures of the formulated PEGylated phospholipid particles, resulting in improper formation and agglomeration. A higher pump rate decreased the outlet temperature, while allowing for the formation of ideally sized, smooth particles that were not agglomerated and properties suitable for inhalation aerosol delivery as dry powders.
HSM enabled visualization as a function of temperature and confirmed the phase transitions of the raw DPPC and DPPE-PEGs, as well as the formulated SD DPPC and co-SD DPPC:DPPE-PEG SD particles. It also showed the stability of the particles at physiological temperatures. ATR-FTIR analysis on the SD particles in their dry state in comparison to their raw components confirmed the presence of both DPPC and DPPE-PEG where appropriate through the signature peaks of each of these materials without the destruction of particles that would occur using other FTIR methods. Furthermore, organic spray-drying resulted in low water content of the particles, which is necessary for effective particle delivery since residual water can have a significant influence on impeding the dispersion of dry powder during aerosolization.Citation53 These values were remarkably low for inhalation applications, and this is another novel advantage in organic solution spray-drying (ie, minimizes residual water content in the final powder). Raman microscopy and chemical imaging confirmed the chemical homogeneity of the particles.
Excellent aerosol dispersion performance () and optimal aerosol performance parameters () were demonstrated using the NGI™ coupled with the HandiHaler® DPI device and clearly indicated that the formulated particles would be optimal for efficient and predominant deposition into the deep lung region for targeted delivery as inhaled nanoparticles/microparticles as aerosolized powders. The MMAD values were within the range (1–5 μm) necessary for particles to deposit predominantly in the middle- to deep-lung regions and deposit by sedimentation due to gravitational settling.Citation1,Citation7,Citation8,Citation52 For example, it was reported that porous poly(lactic-co-glycolic) microparticles exhibited MMADs ranging from 4.5 to 6.6 μm,Citation5 whereas phospholipid/mannitol SD particles ranged from 1.25 to 1.77 μm.Citation37 Furthermore, the ED, FPF, and RF values were all high compared to other values reported in the literature.Citation54,Citation55 While not all of these aerosol performance parameters are often reported, FPF% values for porous poly(lactic-co-glycolic acid) particles were reported to be in the range of 10.7%–33.8%Citation5 and sodium alen-dronate from 34.4% to 62.0%.Citation38 The novel findings reported here indicate the significant potential of these lipopolymeric lung surfactant-mimic particles to be utilized to effectively deliver many different types of therapeutics to the lung as inhaled dry powder nanomedicine aerosols.
Table 4 Aerosol dispersion performance properties as aerosolized dry powders of PEGylated phospholipid particles including mass median aerodynamic diameter (MMAD), geometric standard deviation (GSD), fine particle dose (FPD), fine particle fraction (FPF), respirable fraction (RF), and emitted dose (ED) for inhalable microparticle/nanoparticle formulations all designed and produced at high P (mean ± standard deviation, n = 3)
Conclusion
This comprehensive and systematic study demonstrated for the first time that inhalable DPPC:DPPE-PEG microparticles and nanoparticles with differing PEG lengths were rationally designed and successfully produced using the advanced organic spray-drying process in closed mode for dilute alcohol solutions. The SD lung surfactant-mimic phospholipid and lipopolymeric particles produced from various rationally chosen pump rates showed that the highest pump rate (30 mL/minute) resulted in particles with smooth, spherical morphology and optimal characteristics for inhalation aerosol delivery as DPIs. This was a result of the lower outlet temperatures exhibited, which was below the transition temperature of these particles. Pharmaceutical processing conditions correlated in a meaningful manner with changes in important physicochemical and particle properties, such as morphology and transition temperatures, essential for targeted pulmonary delivery as DPIs. These novel particles as aerosolized dry powders of lung surfactant-mimic and biocompatible lipopolymeric microparticles/nanoparticles offer the potential to be used in the delivery of a wide variety of pulmonary drugs, owing to their inherent ability to encapsulate numerous types of drugs, controlled drug release, enhanced mucus penetration by phospholipid spreading and PEG penetration, and evasion of phagocytosis by immune cells.
Acknowledgments
The authors gratefully acknowledge financial support from the National Cancer Institute (NCI) grant number R25CA153954 and a National Cancer Institute Cancer Nanotechnology Training Center (NCI-CNTC) Postdoctoral Traineeship awarded to SAM. The content is solely the responsibility of the authors and does not necessarily represent the offcial views of the National Cancer Institute or the National Institutes of Health. The authors thank Dr Tonglei Li for PXRD and HSM access, and Dr J Zach Hilt for ATR-FTIR access.
Disclosure
The authors report no conflicts of interest in this work.
References
- CarvalhoTCCarbalhoSRMcConvilleJTFormulations for pulmonary administration of anticancer agents to treat lung malignanciesJ Aerosol Med Pulm Drug Deliv201124618021410326
- MansourHMRheeYSWuXNanomedicine in pulmonary deliveryInt J Nanomedicine2009429931920054434
- VaughnJMMcConvilleJTBurgessDSing dose and multiple dose studies of itraconazole nanoparticlesEur J Pharm Biopharm2006639510216516450
- GillSLöbenbergRKuTAzarmiSRoaWHPrennerEJNanoparticles: characteristics, mechanisms of action, and toxicity in pulmonary drug delivery – a reviewJ Biomed Nanotechnol20073107119
- YangYBajajNXuPOhnKTsifanskyMDYeoYDevelopment of highly porous large PLGA microparticles for pulmonary drug deliveryBiomaterials2009301947195319135245
- SharmaSWhiteDImondiAPlackeMEVailDMKrisMGDevelopment of inhalation agents for oncologic useJ Clin Oncol2001191839184711251016
- HickeyAJMansourHMDelivery of drugs by the pulmonary routeFlorenceATSiepmannJModern Pharmaceutics5th edNew YorkTaylor and Francis20092191219
- HickeyAJMansourHMFormulation challenges of powders for the delivery of small molecular weight molecules as aerosolsRathboneMJHadgraftJRobertsMSLaneMEModified-Release Drug Delivery Technology2nd edNew YorkInforma Healthcare20082573602
- ArnoldMMGonnanEMSchieberLJMunsonEJBerklandCNanoCipro encapsulation in monodisperse large porous PLGA microparticlesJ Control Release200712110010917604870
- CartieraMSFerreiraECCaputoCEganMECaplanMJSaltzmanWMPartial correction of cystic fibrosis defects with PLGA nanoparticles encapsulating curcuminMol Pharm20107869319886674
- MeenachSAKimYJKauffmanKJKanthamneniNBachelderEMAinslieKMSynthesis, optimization, and characterization of camptothecin-loaded acetalated dextran porous microparticles for pulmonary deliveryMol Pharm2012929029822149217
- OhYJLeeJSeoJYPreparation of budesonide-loaded porous PLGA microparticles and their therapeutic efficacy in a murine asthma modelJ Control Release2011150566221070826
- WuXALiXJMansourHMSurface analytical techniques in solidstate particle characterization for predicting performance in dry powder inhalersKona Powder Part J201028319
- MansourHMRheeYSParkCWDeLucaPPLipid nanoparticulate drug delivery and nanomedicineMoghisALipids in Nano-technologyUrbana (IL)American Oil Chemists Society (AOCS) Press2011221268
- WattsABMcConvilleJTWilliamsROAdvancements in dry powder delivery to the lungDrug Dev Ind Pharm20083494895918800256
- PattonJSByronPRInhaling medicines: delivering drugs to the body through the lungsNat Rev Drug Discov20076677417195033
- SungJCPulliamBLEdwardsDANanoparticles for drug delivery to the lungsTrends Biotechnol20072556357017997181
- LaubeBLJanssensHMde JonghFHCWhat the pulmonary specialist should know about inhalation therapiesEur Respir J2011371308133121310878
- XuZMansourHMHickeyAJParticle interations in dry powder inhaler unit processesJ Adhes Sci Technol201125451482
- RheeYSMansourHMNanopharmaceuticals I: nanocarrier systems in drug delivery. Invited paperInt J Nanotechnology2011884114
- WuXMansourHMNanopharmaceuticals II: application of nano-particles and nanocarrier systems in pharmaceutics and nanomedicine. Invited paperInt J Nanotechnology20118115145
- WillisLHayesDJMansourHMTherapeutic liposomal dry powder inhalation aerosols for targeted lung deliveryLung201219025126222274758
- GangulySMoolchandaniVRocheJAPhospholipid-induced in vivo particle migration to enhance pulmonary depositionJ Aerosol Med Pulm Drug Deliv200823181187
- MansourHMZografiGThe relationship between water vapor absorption and desorption by phospholipids and bilayer phase transitionsJ Pharm Sci20079637739617080427
- MansourHWangDSChenCSZografiGComparison of bilayer and monolayer properties of phospholipid systems containing dipalmitoylphosphatidylglycerol and dipalmitoylphosphatidylinositolLangmuir20011766226632
- MansourHMZografiGRelationships between equilibrium spreading pressure and phase equilibria of phospholipid bilayers and monolayers at the air-water interfaceLangmuir2007233809381917323986
- MansourHMDamodaranSZografiGCharacterization of the in situ structural and interfacial properties of the cationic hydrophobic heteropolypeptide, KL4, in lung surfactant bilayer and monolayer models at the air-water interface: implications for pulmonary surfactant deliveryMol Pharm2008568169518630875
- MabreySSturtevantJMInvestigation of phase transitions of lipids and lipid mixtures by high sensitivity differential scanning calorimetryProc Natl Acad Sci U S A197673386238661069270
- LabirisNRDolovichMBPulmonary drug delivery. Part I: physiological factors affecting therapeutic effectiveness of aerosolized medicationsBr J Clin Pharmacol20035658859914616418
- LabirisNRDolovichMBPulmonary drug delivery. Part II: the role of inhalant delivery devices and drug formulation in therapeutic effectiveness of aerosolized medicationsBr J Clin Pharmacol20035660061214616419
- IshiharaKNomuraHMiharaTKuritaKIwasakiYNakabayashiNWhy do phospholipid polymers reduce protein adsorption?J Biomed Mater Res1998393233309457564
- MansourHMSohnMAl-GhananeemADelucaPPMaterials for pharmaceutical dosage forms: molecular pharmaceutics and controlled release drug delivery aspectsInt J Mol Sci2010113298332220957095
- LaiSKO’HanlonDEHarroldSRapid transport of large polymeric nanoparticles in fresh undiluted human mucusProc Natl Acad Sci U S A20071041482148717244708
- SadikotRTRubinsteinILong-acting, multi-targeted nanomedicine: addressing unmet medical need in acute lung injuryJ Biomed Nanotechnol2009561461920201223
- LimSBRubinsteinISadikotRTArtwohlJEÖnyükselHA novel peptide nanomedicine against acute lung injury: GLP-1 in phospholipid micellesPharm Res20112866267221108040
- KikuchiHYamauchiHHirotaSA spray-drying method for mass production of liposomesChem Pharm Bull19913615221527
- AlvesGPSantanaMHAPhospholipid dry powders produced by spray drying processing: structural, thermodynamic and physical propertiesPowder Technol2004145139148
- CruzLFattalETassoLFormulation and in vivo evaluation of sodium alendronate spray-dried microparticles intended for lung deliveryJ Control Release201115237037521396412
- BosquillonCLombryCPreatVVanbeverRInfuence of formulation excipients and physical characterisitcs of inhalation dry powders on their aerosolization performanceJ Control Release20017032933911182203
- BiRShaoWWangQZhangNSpray-freeze-dried dry powder inhalation of insulin-loaded liposomes for enhanced pulmonary deliveryJ Drug Target20081663964818982512
- MastersKSpray Drying Handbook5th edHarlow, UKLongman1991
- LiXMansourHMPhysicochemical characterization and water vapor absorption of organic solution advanced spray dried trehalose microparticles and nanoparticles for targeted dry powder pulmonary inhalation deliveryAAPS Pharm Sci Tech20111214201430
- ParkCWRheeYSVogtFAdvances in microscopy and complementary imaging techniques to assess the fate of drugs ex-vivo in respiratory drug delivery: an invited paperAdv Drug Deliv Rev20126434435621920394
- Chapter 601. Aerosols, nasal sprays, metered-dose inhalers, and dry powder inhalers monographUSP 29-NF 24: United States Pharmacopoeia and the National Formulary: The Official Compendia of StandardsVol 29/24Rockville, MDUnited States Pharmacopeial Convention200626172636
- EdwardsDABen-JebriaALangerRRecent advances in pulmonary drug delivery using large, porous inhaled particlesJ Appl Physiol1998853793859688708
- KangERobinsonJParkKChengJXPaclitaxel distribution in poly(ethylene glycol)/poly(lactide-co-glycolic acid) blends and its release visualized by coherent anti-Stokes Raman scattering microscopyJ Control Release200712226126817574291
- JonesBGDickinsonPAGumbletonMKellawayIWThe inhibition of phagocytosis of respirable microspheres by alveolar and peritoneal macrophagesInt J Pharm2002236657911891071
- WuYPZuoFZhengZHDingXBPengYXA novel approach to molecular recognition surface of magnetic nanoparticles based on host-guest effectNanoscale Res Lett2009473874720596347
- Li X, Hayes D, Mansour HMTargeted lung delivery by inhalable multifunctional microparticulate/nanoparticulate aerosols for cystic fibrosis combination drug/mucolytic treatmentPediatric Pulmonology201134Suppl346
- AzarmiSRoaWHLobenbergRTargeted delivery of nanoparticles for the treatment of lung diseasesAdv Drug Deliv Rev20086086387518308418
- GautamATargeted delivery of therapeutics by aerosol for cancer of the lungCurr Cancer Drug Targets200335712570661
- EdwardsDAThe macrotransport of aerosol particles in the lung: aerosol deposition phenomenaJ Aerosol Sci199526293317
- HickeyAJMansourHMTelkoMTPhysical characterization of component particles included in dry powder inhalers. I. Strategy review and static characteristicsJ Pharm Sci2007961282130117455324
- VanbeverRBen-JebriaAMintzesJLangerCEdwardsDASustained release of insulin from insoluble inhaled particlesDrug Dev Res199948178185
- UngaroFDe RosaGMiroAQuagliaFLa RotondaMICyclodextrins in the production of large porous particles: development of dry powders for the sustained release of insulin to the lungsEur J Pharm Sci20062842343216806857