Abstract
Despite recent advances in radiotherapy, chemotherapy, and surgical techniques, glioblastoma multiforme (GBM) prognosis remains dismal. There is an urgent need for new therapeutic strategies. Nanoparticles of biodegradable polymers for anticancer drug delivery have attracted intense interest in recent years because they can provide sustained, controlled, and targeted delivery. Here, we investigate the mechanisms involved in the antiproliferative effect of indomethacin-loaded lipid-core nanocapsules (IndOH-LNC) in glioma cells. IndOH-LNC were able to reduce cell viability by inducing apoptotic cell death in C6 and U138-MG glioma cell lines. Interestingly, IndOH-LNC did not affect the viability of primary astrocytes, suggesting that this formulation selectively targeted transformed cells. Mechanistically, IndOH-LNC induced inhibition of cell growth and cell-cycle arrest to be correlated with the inactivation of AKT and β-catenin and the activation of GSK-3β. IndOH-LNC also induced G0/G1 and/or G2/M phase arrest, which was accompanied by a decrease in the levels of cyclin D1, cyclin B1, pRb, and pcdc2 and an increase in the levels of Wee1 CDK inhibitor p21WAF1. Additionally, IndOH-LNC promoted GBM cell differentiation, observed as upregulation of glial fibrillary acidic protein (GFAP) protein and downregulation of nestin and CD133. Taken together, the crosstalk among antiproliferative effects, cell-cycle arrest, apoptosis, and cell differentiation should be considered when tailoring pharmacological interventions aimed at reducing glioma growth by using formulations with multiples targets, such as IndOH-LNC.
Introduction
Gliomas are the most common central nervous system malignancy. Their highly invasive and diffuse nature leaves little opportunity for a cure.Citation1 The infiltrative growth pattern of these tumors precludes curative neurosurgery, and tumor cells are usually resistant to irradiation, chemotherapy, and/or immunotherapy, leading to a low survival rate for patients with glioma.Citation2 Furthermore, the blood–brain barrier presents a huge challenge for the effective entry of a majority of drugs, and thus severely restricts therapy for gliomas. Treatment options are very limited and, in most situations, ineffective. Therefore, there is an urgent need for novel and effective therapies to treat these tumors.
Growth inhibition and the induction of cell death are among the major objectives of anticancer therapies. Apoptosis has particular relevance for the therapeutic treatment of tumors because the process favors the phagocytic elimination of dead tumor cells in the absence of an inflammatory response, which is normally associated with necrotic cell death.Citation3 However, gliomas frequently develop resistance to apoptotic cell death. A number of deregulated signaling cascades mediate part of this resistance, including the phosphoinositide-3-kinase (PI3K/AKT) pathway.Citation4 Despite the molecular heterogeneity of malignant gliomas, PI3K/AKT is a common signal transduction pathway altered in many of these tumors by the loss of phosphatase and tensin homologue (PTEN), the overexpression of epidermal growth factor receptor, and/or an increase of PI3K/AKT activity due to mutations in its regulators.Citation4,Citation5 Thus, inhibiting these pathways may be a way to decrease intrinsic and drug-induced resistance in glioblastoma multiforme (GBM), sensitizing GBM cells to apoptotic cell death.
The loss of the regulatory control of the cell cycle, which leads to unrestrained cell proliferation, is a hallmark of cancer. The normal progression of the cell cycle requires the sequential expression of cyclins, which activate cyclin-dependent kinases (Cdk) to phosphorylate target proteins required for cell-cycle progression. Cyclin D1 is one of the positive cell-cycle regulators necessary for the transition of cells from G1 to S phase. Its overexpression is one of the most commonly observed alterations in cancer.Citation6 Recent studies have shown the role of cyclins not only as components of the cell cycle core machinery but also as cofactors for several transcription factors.Citation7 Understanding deregulated cell-cycle pathways has provided a basis for designing molecular targeted therapies as new combination therapies and drug-delivery systems. Additional efforts focus on the development of novel therapeutic approaches using agents that promote cancer cell differentiation.Citation8 Differentiation therapy changes the destructive behavior of cancer cells by reducing their proliferative capacity and inducing terminal differentiation and/or apoptosis.Citation9 Recently, differentiation-inducing therapy has been proposed as a new potential strategy to treat malignant gliomas.Citation10
The development of delivery systems able to alter the biological profiles of active compounds is of the utmost importance and requires a multidisciplinary approach. Nanotechnology is at the core of biotechnology and is likely to play a significant role in this regard. One of the most important nanotechnology applications developed over the past decade is the nanovehicle, a nanoscale compound used as a therapeutic tool and designed to accumulate at specific sites in the body in order to improve pharmacotherapeutic outcomes.Citation11 Hence, nanodrugs and nanodiagnostics have been developed to increase bioavailability profiles, enabling the administration of lower doses. This minimizes the adverse reactions found with conventional drugs administered in clinical practices and improves patient health.Citation12 In the field of cancer therapy, there are many clinical applications based on nanotechnologies with a major development in drug delivery systems, particularly in solid tumors.Citation13 Moreover, it has been suggested that nanoparticles could be used to carry drugs across the blood–brain barrier,Citation14,Citation15 an important requirement for the development of novel drugs against gliomas. The mechanisms underlying the encapsulation and release of several drugs from nanoparticulate systems have been extensively studied by our group.Citation16–Citation19 In a previous study, we demonstrated that polymeric nanocapsules could carry indomethacin, a powerful nonsteroidal anti-inflammatory drug, into brain tumors.Citation20 Local delivery of indomethacin significantly reduced in-vivo GBM growth and improved animal survival in a rat glioma model.Citation20 Taking into account the limited success of glioma therapy and these promising data, the aim of the present study was to investigate the mechanisms involved in the antiproliferative effect of indomethacin-loaded lipid core nanocapsules in glioma cells by evaluating PI3K/AKT survival pathways, cell-cycle regulatory molecules, and cell differentiation.
Materials and methods
Preparation of lipid-core nanocapsules
Lipid-core nanocapsule suspensions were prepared by interfacial deposition of polymer.Citation21–Citation23 At 40°C, indomethacin (0.010 g), poly(ɛ-caprolactone) (0.100 g), capric/caprylic triglycerides (0.33 mL), and sorbitan monostearate (0.077 g) were dissolved in acetone (27 mL). In a separate flask, polysorbate 80 (0.077 g) was added to 53 mL of water. The organic solution was injected into the aqueous phase under magnetic stirring at room temperature. After 10 minutes, the acetone was eliminated, and the suspensions were concentrated under reduced pressure. The final volume was adjusted to 10 mL for a drug concentration of 1 mg/mL. The indomethacin-loaded lipid-core nanocapsule formulation was named IndOH-LNC. Drug-unloaded nanocapsules (LNC) were prepared as described above, without adding indomethacin, and used as a control formulation.
Characterization of lipid-core nanocapsules
After preparation of the nanocapsule suspensions, the pH was determined using a potentiometer (B-474; Micronal, São Paulo, Brazil). The particle size, polydispersity index, and zeta potential of the suspensions were determined using a Zetasizer® Nano-ZS ZEN 3600 model (Malvern Instruments, Malvern, UK). The samples were diluted with pre-filtered water (MilliQ®) (particle size and polydispersity index) or a 10 mM NaCl aqueous solution (zeta potential). The measurements were made in triplicate. The total concentration of indomethacin in the formulations was measured by reverse phase high-performance liquid chromatography (PerkinElmer S-200, with injector S-200, detector UV-Vis, a guard-column [PerkinElmer, Waltham, MA, USA]; and a LiChrospher® 100 RP-18 column of 250 mm, 4 mm, and 5 μm [Merck KGaA, Darmstadt, Germany]). The mobile phase consisted of acetonitrile/water (70:30, v/v) adjusted to an apparent pH of 5.0 ± 0.5 with 10% (v/v) acetic acid. Each suspension (100 μL) was treated with acetonitrile (10 mL). The solution was filtered (Millipore 0.45 μm; Merck Millipore, Billerica, MA, USA) and injected (20 μL). The high-performance liquid chromatography method was previously validated.Citation24 Linear calibration curves for indomethacin were obtained in the range of 1.00–25.00 μg/mL, presenting correlation coefficients higher than 0.9992. The encapsulation efficiency was determined by an ultrafiltration-centrifugation technique (Ultrafree-MC 10,000 M W, Millipore) at 15,300× g for 10 minutes. The encapsulated indomethacin in the nanocapsules was calculated from the difference between the total and the free-drug concentrations determined in the nanocapsule suspension and in the ultrafiltrate, respectively.
Cell cultures
Rat C6 glioma cells and human U138-MG glioma cells were obtained from American Type Culture Collection (ATCC) (Manassas, VA, USA). The cells were grown and maintained in Dulbecco’s modified Eagle’s medium (DMEM) low glucose containing 0.1% Fungizone® and 100 U/L gentamicin and supplemented with 5% (C6) or 15% (U138-MG) (v/v) fetal bovine serum. All culture materials were purchased from Gibco Laboratories (Grand Island, NY, USA). Cells were kept at a temperature of 37°C, a minimum relative humidity of 95%, and an atmosphere of 5% CO2 in air.
Primary astrocyte cultures were prepared as previously described.Citation25 Briefly, the cortices of newborn Wistar rats (1–2 days old) were removed and mechanically dissociated by sequential passage through a Pasteur pipette. The cell suspension was centrifuged at 1000× g for 5 minutes. The pellet was then resuspended in DMEM supplemented with 10% fetal bovine serum, 1% penicillin/streptomycin, and 0.1% amphotericin B. The cells (2 × 10Citation5) were plated (1.5 × 10Citation5 cells/cmCitation2) in poly-L-lysine-coated 24-well plates. After 4 hours plating, plates were gently shaken and washed with phosphate buffered saline (PBS). The medium was changed, and cells were grown to confluence (21 days). Medium was replaced every 4 days.
Cell treatments
Indomethacin was purchased from Sigma-Aldrich (St Louis, MO, USA). Free indomethacin was dissolved in cell culturegrade dimethyl sulfoxide (DMSO) (Sigma-Aldrich). The control groups using this solution were named IndOH. The indomethacin-loaded lipid-core nanocapsules (IndOH-LNC) were prepared and characterized as described above. After reaching semiconfluence (glioma cell lines) or after 21 days (astrocytes), the cultures were exposed to IndOH or IndOH-LNC (5, 10, 25, 50, or 100 μM) for 1, 6, 24, 48, or 72 hours. The vehicle DMSO was present in the cells at a maximum concentration of 0.5%. Unloaded lipid-core nanocapsules (LNC) were considered the vehicle control of IndOH-LNC.
Assessment of cell viability
The 3-(4,5-dimethylthiazol-2-yl)-2,5-diphenyltetrazolium bromide (MTT) assay and the trypan blue exclusion test were used to estimate glioma and astrocyte cell viability. The MTT method is based on the mitochondrial reduction of MTT to a formazan product. Cells were seeded (10Citation3 per well) into 96-well plates and treated with 5, 10, 25, 50, or 100 μM of IndOH or IndOH-LNC for 24 hours. At the end of the treatment, the MTT assay was performed as described previouslyCitation26 In the trypan blue exclusion test, live cells with intact membranes exclude the dye, whereas dead cells do not stain. Cells were seeded (10Citation4 per well) into 24-well plates. At the end of the treatment, cells were collected after trypsin digestion and were counted immediately in a hemocytometer.
Annexin V staining
Apoptotic cells were quantified using an Annexin V-FITC/Propidium Iodide (PI) double staining kit, according to the manufacturer’s instructions (Chemicon International, Temecula, CA, USA). Glioma cells were seeded (3 × 10Citation4 per well) into 6-well plates and treated with 10, 25, or 50 μM of IndOH or IndOH-LNC for 24 hours. At the end of the treatment, cells were collected after trypsin digestion, and externalized phosphatidylserine was labeled (15 minutes, ice-cold) with 3 μL FITC-conjugated annexin V in 100 μL binding buffer in the dark. Next, PI (1 μg/mL) was added. Apoptotic and/or necrotic cells were quantified by a dual-color flow cytometry technique using a FACSCalibur flow cytometer (BD Biosciences, San Jose, CA, USA). Ten thousand events were analyzed per sample, and cells were classified as follows: live cells (Annexin-/PI-); early apoptotic cells (Annexin+/PI-); late apoptotic (Annexin+/PI+); necrotic (Annexin-/PI+). The data obtained were analyzed with FCS Express 4 Flow Cytometry Software (De Novo Software, Los Angeles, CA, USA).
Cell-cycle analysis
Glioma cells were seeded (3 × 10Citation4 per well) into 6-well plates and treated with 25 μM IndOH-LNC for 24 and 48 hours. At the end of treatment, cells were trypsinized centrifuged and resuspended in a lysis buffer containing 3.5 mmol/L trisodium citrate, 0.1% v/v Nonidet P-40, 0.5 mmol/L Tris-HCl, 1.2 mg/mL spermine tetrahydrochloride, 5 μg/mL RNase, 5 mmol/L EDTA, and 1 μg/mL propidium iodide, pH 7.6. Afterwards, cells were incubated for at least 10 minutes on ice for cell lysis (10Citation6 cells/mL lysis buffer).Citation27 The DNA content was determined by flow cytometry (FACSCalibur; BD Biosciences). Ten thousand events were counted per sample. FACS analyses were performed in the CellQuest Pro Software (BD Biosciences).
Western blot analysis
After the indicated treatments, glioma cells were homogenized in ice-cold lysis buffer (4% sodium dodecyl sulfate [SDS], 2 mM EDTA, and 50 mM Tris) containing a proteinase inhibitor cocktail, and the protein concentration was determined.Citation28 Protein samples were prepared and Western blotted as described previously with minor modifications.Citation18 Equal amounts of proteins were resolved (50 μg per lane) on 8% or 10% SDS-PAGE. After electrophoresis, proteins were electrotransferred to nitrocellulose membranes using a semi-dry transfer apparatus (Trans-Blot SD; Bio-Rad Laboratories, Hercules, CA, USA). Membranes were incubated for 60 minutes at 4°C in blocking solution (Tris-buffered saline containing 5% nonfat milk and 0.1% Tween 20, pH 7.4) and further incubated with the appropriate primary antibody dissolved in the blocking solution overnight at 4°C.Citation18 The following primary antibodies were used: anti-phospho AKT (Ser473) (pAKT) (1:1000; Cell Signaling, Danvers, MA, USA), anti-AKT (AKT) (1:1000; Cell Signaling), anti-phospho GSK3β (Ser9) (pGSK3β) (1:2000; Cell Signaling), anti-GSK3β (GSK3β) (1:2000; Cell Signaling), anti-GFAP (glial fibrillary acidic protein) (1:2000; Chemicon International), anti-nestin (1:2000; Chemicon International), anti-cyclin D1 (1:1000; Cell Signaling), anti-CDK4 (1:1000; Cell Signaling), anti-CDK6 (1:1000; Cell Signaling), anti-pRb (Ser795) (1:500; Cell Signaling), anti-cyclin B1 (1:1000; Cell Signaling), anti-phospho cdc2 (pcdc2) (1:500; Cell Signaling), anti-cdc2 (cdc2) (1:1000; Cell Signaling), anti-Wee1 (1:1000; Cell Signaling), and anti-p21 (1:1000; Cell Signaling). After washing, the membranes were incubated with adjusted secondary antibodies coupled to horseradish peroxidase (1:1000) for 2 hours. The immunocomplexes were visualized using the ECL chemiluminescence detection system (Thermo Fischer Scientific, Waltham, MA, USA). Band density was measured using Optiquant software (Packard Instrument Company Meriden, CT, USA). Uniform gel loading was confirmed with beta-actin (1:1000; Cell Signaling) as the standard.
Immunocytochemistry
Glioma cells were grown on coverslips and treated with 25 μM IndOH-LNC for 24 hours (β-catenin experiment) or 72 hours (cell differentiation experiments). At the end of treatment, cells were fixed with 4% fresh paraformaldehyde in PBS for 30 minutes at room temperature. Samples were blocked for 1 hour with 1% normal goat serum in PBS containing 0.2% Triton X-100. The primary antibodies anti-GFAP (1:500; Chemicon), anti-nestin (1:500; Chemicon), CD133 (1:500; Abcam, Cambridge, MA, USA), and β-catenin (1:500; Sigma-Aldrich) were incubated overnight. For immunolabeling, the samples were incubated with species-specific fluorochrome-conjugated secondary antibodies for 90 minutes at room temperature. The secondary antibody used was anti-rabbit Alexa Fluor® 488 (green) (1:500; Life Technologies, Carlsbad CA, USA) or anti-mouse Rhodamine (red) (1:500; Life Technologies). Nuclei were stained with DAPI (4′,6-diamidino-2-phenylindole) (1:1000; Sigma-Aldrich). After a final rinse with PBS, the slides were mounted using Pro-Long® Gold Antifade Reagent (Molecular Probes, Eugene, OR, USA). The slides were examined using an Olympus IX-70 fluorescence microscope (Olympus Corporation, Tokyo, Japan), and images were captured using a digital camera connected to the microscope (camera model U-LH100HGAPO; Olympus Corporation) (magnification ×20).
Statistical analysis
All experiments were carried out at least three times. The results are presented as the mean + standard deviation. The statistical comparisons of the data were performed by oneway or two-way analysis of variance followed by a Bonferroni post-hoc test using GraphPad Prism software version 5.01 (GraphPad Software Inc, La Jolla, CA, USA). P-values lower than 0.05 (P< 0.05) were considered significant.
Results
Physicochemical characterization of IndOH-LNC
The lipid-core nanocapsule formulations were prepared by interfacial deposition of poly(ɛ -caprolactone) without the need for any subsequent purification step. IndOH-LNC and LNC showed macroscopic homogeneous aspects, such as white bluish opalescent liquids. After preparation, the mean particle diameters determined by photon correlation spectroscopy (z-average diameters) were 231 ± 4 nm (IndOH-LNC) and 229 ± 5 nm (LNC). The suspensions showed monomodal size distributions and a polydispersity index of 0.12 ± 0.01 nm (IndOH-LNC) and 0.14 ± 0.02 (LNC), indicating the formulations were highly homogeneous with narrow size distributions. The pH values were 5.95 ± 0.1 (IndOH-LNC) and 6.1 ± 0.2 (LNC), and the zeta potential values were –7.0 ± 1.3 mV and –7.2 mV ± 1.8 mV, respectively. The indomethacin content was 0.998 ± 0.010 mg/mL, and the encapsulation efficiency was close to 100% for all batches.
IndOH-LNC selectively decrease cell viability in glioma cells
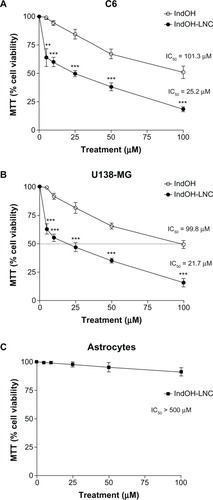
First, the MTT assay was used to evaluate whether IndOH and IndOH-LNC (5, 10, 25, 50, or 100 μM) affect the cell viability of gliomas after 24 hours of treatment. As shown in , all concentrations of IndOH-LNC significantly reduced the cell viability of C6 and U138-MG cell lines (). In accordance with previous results using 48 hours of treatment,Citation26 IndOH-LNC more potently reduced the cell viability when compared with respective concentrations of IndOH (). These results were confirmed by a trypan blue exclusion test (data not shown). In parallel, primary astrocyte cultures were used as a nontransformed model of glial cells in order to confirm the selectivity of IndOH-LNC. Whereas IndOH-LNC decreased the viability of the two GBM cell lines in a concentration-dependent manner (half-maximal inhibitory concentration [IC50] range: 25 μM), concentrations of IndOH-LNC up to 100 μM (IC50> 500 μM) did not alter astrocytic viability significantly (). These results suggest that IndOH-LNC preferentially targets cancer cells.
Figure 1 Effect of IndOH and IndOH-LNC on the cell viability of gliomas and astrocytes. (A) C6 and (B) U138-MG glioma cell lines and (C) normal astrocytes were treated for 24 hours with different concentrations (5, 10, 25, 50, or 100 μM) of IndOH or IndOH-LNC, and MTT assays were carried out.
Notes: The dashed line represents the IC50 values. Unloaded LNC were considered the vehicle control of IndOH-LNC. The cell viability is presented relative to that of control cells (100% cell viability). The values are presented as mean ± standard deviation for six independent experiments. significant differences from control and between the respective concentrations of IndOH groups: **P < 0.01 and ***P < 0.001, as assessed by two-way analysis of variance followed by the Bonferroni post hoc test.
Abbreviations: IC50, half-maximal inhibitory concentration; IndOH, indomethacin; IndOH-LNC, indomethacin-loaded lipid-core nanocapsules; LNC, lipid-core nanocapsules; MTT, 3-(4,5-dimethylthiazol-2-yl)-2,5-diphenyltetrazolium bromide.
IndOH-LNC induce apoptotic cell death in glioma cells
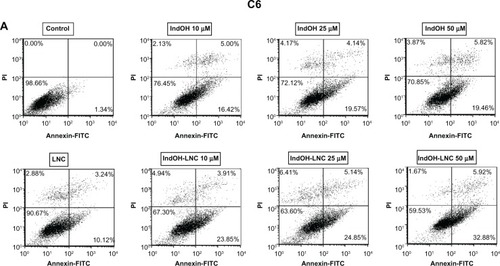
To characterize the cell death induced by IndOH-LNC, glioma cells were treated with 10, 25, or 50 μM of IndOH or IndOH-LNC for 24 hours, and annexin V-PI assays were carried out. The cytogram of the four quadrants in was used to distinguish the live (Annexin-/PI-), early apoptotic (Annexin+/PI-), late apoptotic (Annexin+/PI+), and necrotic (Annexin-/PI+) cells. In C6 glioma cells, 25 μM IndOH-LNC elicited externalization (flip-flop) of phosphatidylserine in approximately 25% of the cells (Annexin+/PI–). A low percentage of cells (approximately 6%) was Annexin-/PI+ (necrosis), suggesting that IndOH-LNC induced cell death mainly by apoptosis (). The cell death profile was similar for all concentrations of IndOH-LNC (). Consistent with the cell viability results, IndOH-LNC was more potent in inducing apoptotic cell death than the respective concentrations of IndOH (). Similar results were obtained with U138-MG glioma cells. However, in these cells, IndOH-LNC treatment was even more effective (). In the U138-MG cells, our results showed that 25 μM IndOH-LNC induced early apoptosis in approximately 60% of the cells (Annexin+/ PI-). A low percentage of cells (approximately 2%) was Annexin-/PI+ (necrosis) (), confirming that IndOH-LNC induced cell death mainly by apoptosis. Based on these results, the concentration of 25 μM (approximate IC50 value) was chosen for further experiments. Treatment of the C6 and U138-MG cells with LNC did not significantly alter cell death, indicating that the nanostructured architecture is not toxic for these models ().
Figure 2 IndOH and IndOH-LNC induce apoptosis in glioma cells. Flow cytometry experiments to quantify apoptotic and/or necrotic cells in (A) C6 and (B) U138-MG glioma cells treated with IndOH or IndOH-LNC (10, 25, or 50 μM) for 24 hours. Unloaded LNC were considered the vehicle control of IndOH-LNC. Values are expressed as the percentage of early apoptotic cells (%) (annexin V positive/PI negative) in (C) C6 and (D) U138-MG glioma cells treated with IndOH or IndOH-LNC.
Notes: Bars represent the mean ± standard deviation for three independent experiments. significant differences from control and LNC groups and between the respective concentrations of IndOH group: *P < 0.05, and ***P < 0.001, as assessed by two-way analysis of variance followed by the Bonferroni post hoc test.
Abbreviations: FITC, fluorescein isothiocyanate; IndOH, indomethacin; IndOH-LNC, indomethacin-loaded lipid-core nanocapsules; LNC, lipid-core nanocapsules; PI, propidium iodide.
IndOH-LNC modulate PI3K/AKT, GSK3β, and β-catenin survival pathways in glioma cells
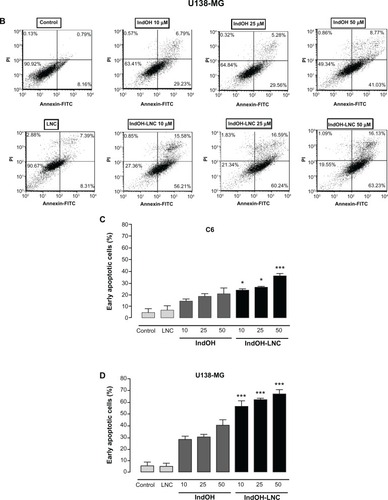
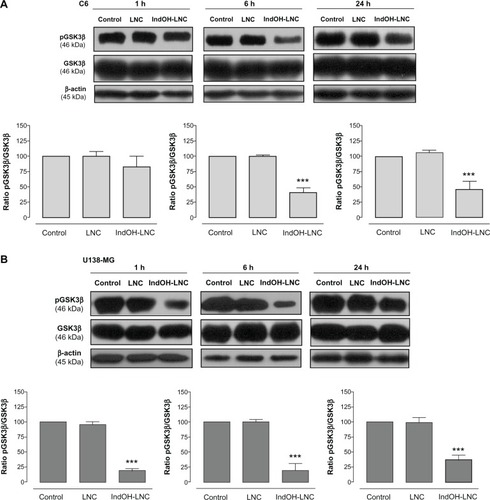
PI3K/AKT is over activated in a wide range of tumor types; it triggers a cascade of responses that include cell growth, proliferation, and survival.Citation29 In an attempt to delineate the role of AKT signaling in IndOH-LNC-treated glioma cells, we determined the AKT phosphorylation status and the activation/inactivation profile of signaling targets downstream of AKT in C6 and U138-MG glioma cell lines. As shown in , glioma cells expressed high levels of activated AKT, as determined by the phosphorylation of AKT at Ser473. IndOH-LNC treatment inhibited the constitutive activation of the PI3K/AKT pathway at all times evaluated (1, 6, and 24 hours), as demonstrated by the levels of the phosphorylated form of AKT in C6 and U138-MG cell lines (). The total levels of AKT were not altered, indicating that the protein was modulated at the posttranslational level (). We then evaluated whether the AKT downstream target GSK-3β was affected. IndOH-LNC treatment also decreased the phosphorylation of GSK-3β, thus activating this protein, in both cell lines without changing the total level of GSK-3β (). This effect was observed at 6 and 24 hours of treatment for C6 cells and at 1, 6, and 24 hours for U138-MG cells. In the U138-MG glioma cells, the effect was more intense with 1 and 6 hours of treatment (). The treatment of the C6 and U138-MG cells with LNC did not significantly alter AKT or GSK-3β levels ( and ).
Figure 3 IndOH-LNC decrease the pAKT protein immunocontent in glioma cells. Western blotting for pAKT, AKT, and β-actin was performed at the indicated time in 25 μM IndOH-LNC-treated (A) C6 and (B) U138-MG glioma cells.
Notes: Unloaded LNC were considered the vehicle control of IndOH-LNC. The histogram presents the quantitative Western blot analysis of the AKT phosphorylation state. The densitometric values obtained for phospho- and total-AKT after treatments were normalized to their respective controls (control bar) (100%). Data are expressed as a ratio of the normalized percentages of pAKT and AKT. Bars represent the mean ± standard deviation for six independent experiments. significant differences from control and LNC groups: **P< 0.01 and ***P< 0.001, as assessed by one-way analysis of variance followed by the Bonferroni post hoc test.
Abbreviations: IndOH-LNC, indomethacin-loaded lipid-core nanocapsules; LNC, lipid-core nanocapsules.
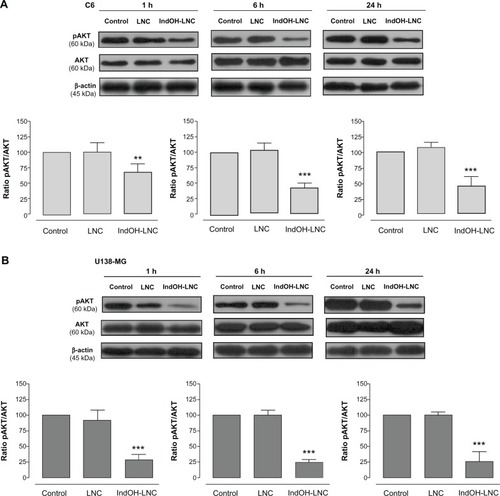
Figure 4 IndOH-LNC decrease the pGSK3β protein immunocontent in glioma cells. Western blotting for pGSK3β, GSK3β, and β-actin was performed at the indicated times in 25 μM IndOH-LNC-treated (A) C6 and (B) U138-MG glioma cells.
Notes: Unloaded LNC were considered the vehicle control of IndOH-LNC. The histogram presents the quantitative Western blot analysis of the GSK3β phosphorylation state. The densitometric values obtained for phospho- and total-GSK3β after treatments were normalized to their respective controls (control bar) (100%). Data are expressed as a ratio of the normalized percentages of pGSK3β and GSK3β. Bars represent the mean ± standard deviation for six independent experiments. significant differences from control and LNC groups: ***P< 0.001, as assessed by one-way analysis of variance followed by the Bonferroni post hoc test.
Abbreviations: IndOH-LNC, indomethacin-loaded lipid-core nanocapsules; LNC, lipid-core nanocapsules.
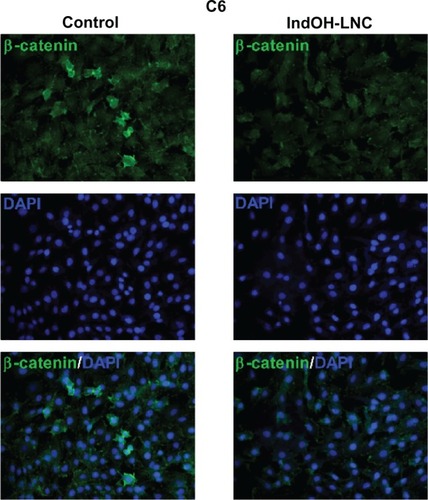
Considering the interplay between the Wnt/β-catenin and PI3K/AKT signaling cascades in gliomas,Citation30 we evaluated whether IndOH-LNC treatment was able to modulate β-catenin expression in C6 glioma cells. β-catenin staining in cells treated with IndOH-LNC was lower than that in control cells, suggesting that the IndOH-LNC formulation reduces β-catenin expression ().
Figure 5 IndOH-LNC reduce β-catenin expression in C6 glioma cells.
Notes: C6 glioma cells were treated with 25 μM IndOH-LNC for 24 hours and immunostained using anti-β-catenin antibody (green) and DAPI (blue). Experiments were performed at least three times.
Abbreviations: DAPI, 4′,6-diamidino-2-phenylindole; IndOH-LNC, indomethacin-loaded lipid-core nanocapsules.
IndOH-LNC promote cell-cycle arrest and induce cell-cycle regulation
Cell-cycle analysis experiments were performed to evaluate the mechanisms underlying the antiproliferative effect of IndOH-LNC in glioma cells. The cell-cycle distribution indicated that 25 μM IndOH-LNC caused C6 glioma cells to arrest in G0/G1 phase after 24 hours treatment (). specifically, at 24 hours of IndOH-LNC treatment, the cell population in the G0/G1 phase grew to 61% ± 0.8% compared with 50% ± 1.8% in control, while the proportion of cells in S phase decreased from 28% ± 0.9% to 18% ± 0.5% (). This cell-cycle distribution was maintained at 48 hours treatment in C6 glioma cells (). The G0/G1 arrest was accompanied by the formation of a population sub-G1 cells (12% ± 1.5% of IndOH-LNC-treated cells compared to 0.9% ± 0.6% of control cells), suggesting that G0/G1 arrest preceded DNA fragmentation and, consequently, apoptosis (). The formation of sub-G1 apoptotic cells confirmed the result obtained with annexin V staining (). Similar results were obtained with U138-MG glioma cells at 24 hours of IndOH-LNC treatment (). At 48 hours of treatment, IndOH-LNC induced a pronounced arrest in G0/G1 phase (66% ± 0.9% compared with 54% ± 1.1% of control cells) and a modest arrest in G2/M (24% ± 0.9% compared with 19% ± 0.5% of control cells), while the proportion of cells in S phase decreased from 22% ± 0.4% to 7% ± 0.9% (). In the same way, the formation of sub-G1 apoptotic cells at 24 and 48 hours treatment was observed, suggesting that arrest in G0/G1 and G2/M phases preceded apoptosis (). The treatment of the C6 and U138-MG cells with LNC did not significantly alter the cell-cycle progression ( and ).
Figure 6 Cell-cycle arrest induced by IndOH-LNC in C6 glioma cells.
Notes: Flow cytometry was performed to determine the cell-cycle distribution (sub-G1, G1/G0, S, and G2/M) in 25 μM IndOH-LNC-treated (24 and 48 hours) cells. Western blotting for cell-cycle checkpoint proteins from G0/G1 phase to S phase (cyclin D1, pRb, CDK4, and CDK6) was performed. Unloaded LNC were considered the vehicle control of IndOH-LNC. The histogram presents the quantitative Western blot analysis for the protein indicated. The densitometric values obtained from treatments were normalized to their respective controls (control bar) (100%). Bars represent the mean ± standard deviation for at least six independent experiments. significant differences from control and LNC groups: **P < 0.01, ***P < 0.001, as assessed by one-way analysis of variance followed by the Bonferroni post hoc test.
Abbreviations: IndOH-LNC, indomethacin-loaded lipid-core nanocapsules; LNC, lipid-core nanocapsules.
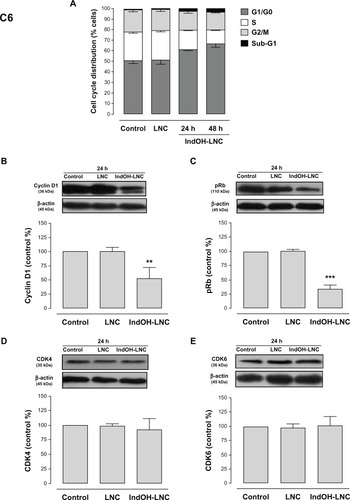
Figure 7 Cell-cycle arrest induced by IndOH-LNC in U138-MG glioma cells.
Notes: Flow cytometry was performed to determine the cell-cycle distribution (sub-G1, G1/G0, S, and G2/M) in 25 μM IndOH-LNC-treated (24 and 48 hours) cells. Western blotting for cell-cycle checkpoint proteins from G0/G1 phase to S phase (cyclin D1, pRb, CDK4, and CDK6) was performed. Unloaded LNC were considered the vehicle control of IndOH-LNC. The histogram presents the quantitative Western blot analysis for the protein indicated. The densitometric values obtained from treatments were normalized to their respective controls (control bar) (100%). Bars represent the mean ± standard deviation for at least six independent experiments. significant differences from control and LNC groups: ***P < 0.001, as assessed by one-way analysis of variance followed by the Bonferroni post hoc test.
Abbreviations: IndOH-LNC, indomethacin-loaded lipid-core nanocapsules; LNC, lipid-core nanocapsules.
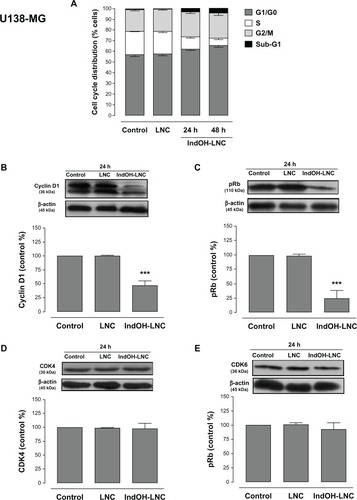
To evaluate the mechanisms involved in cell-cycle regulation, we investigated the effect of IndOH-LNC on cell-cycle checkpoint signaling. Cyclin D1 is believed to be a cell-cycle checkpoint at the G0/G1 phase to S phase transition. In response IndOH-LNC, cyclin D1 protein levels significantly decreased in C6 and U138-MG cells after 24 hours treatment compared with levels in control cells ( and ). Additionally, the phosphorylation of downstream pRb significantly decreased in both cell lines treated with IndOH-LNC ( and ). On the other hand, cyclin-dependent kinases 4 and 6 (CDK4 and CDK6) proteins were unaltered after the treatment (, ). The treatment of cells with LNC did not significantly alter the cell-cycle distribution or cell-cycle regulation ( and ).
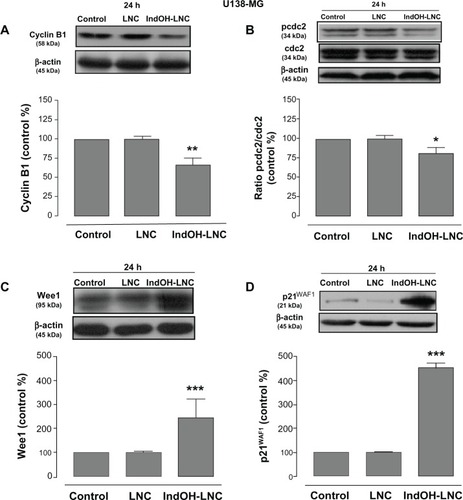
In an attempt to find the signaling pathway that coordinates IndOH-LNC-induced G2/M arrest only in U138-MG glioma cells, we determined the activity of cyclin B1, pcdc2, Wee1, and p21WAF1 in this cell line. Our results showed that IndOH-LNC treatment reduced cyclin B1 levels () and the phosphorylation status of cdc2 (). On the other hand, IndOH-LNC treatment increased the levels of Wee1 (), a component of the G2/M checkpoint that inhibits cdc2. Furthermore, IndOH-LNC also promoted a high accumulation of the cyclin-dependent kinase inhibitor (CD-I) p21WAF1, a marker of cell-cycle arrest (). The treatment of the U138-MG cells with LNC did not significantly alter cyclin B1, pcdc2, Wee1, or p21WAF1 ().
Figure 8 IndOH-LNC modulate cell-cycle G2/M checkpoints in U138-MG glioma cells.
Notes: U138-MG glioma cells were treated with 25 μM IndOH-LNC for 24 hours. Cell-cycle G2/M checkpoint proteins (cyclin B1, pcdc2, Wee1, and p21WAF1) were assessed by Western blotting. Unloaded LNC were considered the vehicle control of IndOH-LNC. The histogram presents the quantitative Western blot analysis for the protein indicated. The densitometric values obtained from treatments were normalized to their respective controls (control bar) (100%). Bars represent the mean ± standard deviation for at least six independent experiments. significant differences from control and LNC groups: *P < 0.05, **P < 0.01, and ***P < 0.001, as assessed by one-way analysis of variance followed by the Bonferroni post hoc test.
Abbreviations: IndOH-LNC, indomethacin-loaded lipid-core nanocapsules; LNC, lipid-core nanocapsules.
IndOH-LNC induce the differentiation of glioma cells
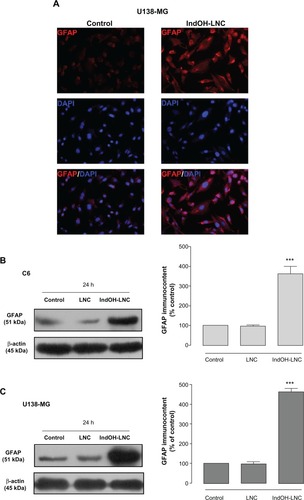
The differentiation of glioma cells toward the astrocyte type is characterized by a morphological transformation and expression of differentiation markers. Microscopic observation of glioma cells treated with 25 μM IndOH-LNC for 72 hours revealed cells with altered morphology, such as mature astrocytes with smaller, round bodies and much longer, fine, tapering processes (data not shown). To confirm this observation, we examined the expression of GFAP, a well established marker of mature astrocytes. Immunocytochemistry with anti-GFAP antibody showed that few untreated U138-MG glioma cells stained positive, but numerous cells treated with IndOH-LNC stained positive in the cytoplasm (). The GFAP immunocontent was quantified by Western blot analysis (). Consistent with the immunocytochemistry analysis, the results confirmed that IndOH-LNC strongly upregulated GFAP protein expression in both cell lines ().
Figure 9 IndOH-LNC increase the GFAP protein immunocontent in glioma cells. Cells were treated with 25 μM IndOH-LNC for 72 hours, and immunocytochemistry for anti-GFAP antibody (red) and DAPI (blue) was performed in (A) U138-MG glioma cells. GFAP protein immunocontent was quantified by Western blot analysis for (B) C6 and (C) U138-MG glioma cells.
Notes: Unloaded LNC were considered the vehicle control of IndOH-LNC. The densitometric values obtained from treatments were normalized to their respective controls (control bar) (100%). Immunocytochemistry experiments were performed at least three times. In the Western blot analysis, bars represent the mean ± standard deviation for six independent experiments. significant differences from control and LNC groups: ***P< 0.001, as assessed by one-way analysis of variance followed by the Bonferroni post hoc test.
Abbreviations: DAPI, 4′,6-diamidino-2-phenylindole; GFAP, glial fibrillary acidic protein; IndOH-LNC, indomethacin-loaded lipid-core nanocapsules; LNC, lipid-core nanocapsules.
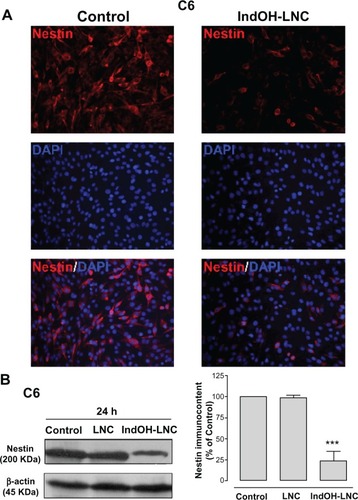
Another differentiation marker evaluated here was nestin. Nestin is used to identify neural stem cells and is expressed in almost all GBMs.Citation31,Citation32 Thus, the low staining for nestin in C6 glioma cells treated with IndOH-LNC indicated that this formulation was able to promote glioma cell differentiation (). This result was also confirmed and quantified by Western blot analysis ().
Figure 10 IndOH-LNC increase the nestin protein immunocontent in C6 glioma cells. C6 glioma cells were treated with 25 μM of IndOH-LNC for 72 hours. (A) Immunostaining for anti-nestin antibody (red) and DAPI (blue). (B) Quantification of nestin protein immunocontent by Western blot analysis.
Notes: Unloaded LNC were considered the vehicle control of IndOH-LNC. The densitometric values obtained from treatments were normalized to their respective controls (control bar) (100%). Immunocytochemistry experiments were performed at least three times. In the Western blot analysis, bars represent the mean ± standard deviation for six independent experiments. significant differences from control and LNC groups: ***P< 0.001, as assessed by one-way analysis of variance followed by the Bonferroni post hoc test.
Abbreviations: DAPI, 4′,6-diamidino-2-phenylindole; IndOH-LNC, indomethacin-loaded lipid-core nanocapsules; LNC, lipid-core nanocapsules.
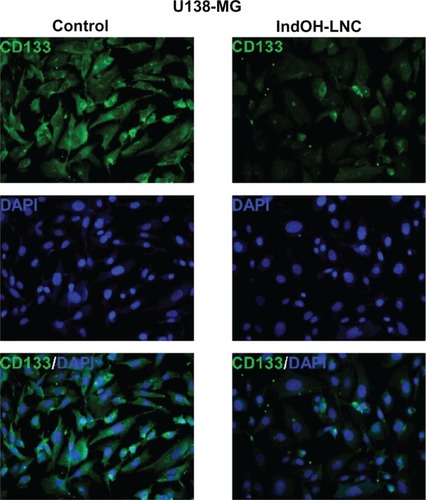
Additionally, U138-MG glioma cells were positive for the cell surface antigen CD133 (), a marker of neural stem cells. The low staining for CD133 in cells treated with IndOH-LNC () confirms that IndOH-LNC promoted glioma cell differentiation.
Figure 11 IndOH-LNC reduce CD133-positive stem cells in the U138-MG glioma cell line.
Notes: Cells were treated with 25 μM IndOH-LNC for 72 hours, and immunocytochemistry for CD133 (green) and DAPI (blue) was performed in U138-MG glioma cells. Images are representative of six independent experiments.
Abbreviations: DAPI, 4′,6-diamidino-2-phenylindole; IndOH-LNC, indomethacin-loaded lipid-core nanocapsules; LNC, lipid-core nanocapsules.
Discussion
Biodegradable nanoparticles are emerging as novel and promising drug delivery systems. They offer an alternative therapeutic approach for difficult-to-treat diseases such as brain tumors. In previous work, we showed that polymeric nanocapsules can successfully carry indomethacin into brain tumors.Citation20 Additionally, the local delivery of indomethacin reduces in-vivo GBM growth and improves animal survival. However, the mechanisms underlying the antiproliferative effect of indomethacin remained unclear. Here, we showed that IndOH-LNC modulates PI3K/AKT and GSK3β survival pathways, modulates cell-cycle regulation, and induces differentiation in glioma cells.
In agreement with a previous study,Citation26 our results showed a potent and selective cytotoxic effect of IndOH-LNC in GBM cells. At 24 hours of treatment, IndOH-LNC was at least fourfold more cytotoxic than IndOH. Of great relevance, IndOH-LNC was selectively cytotoxic to glioma cells and spared normal glial cells, since astrocyte viability was not significantly affected. According to the literature, the higher cytotoxic effect of nanocapsules in glioma cells may be triggered by a higher rate of cell division or by increased endocytotic activity resulting in enhanced nanocarrier uptake.Citation33 Thus, in our experiment, the cellular uptake of drug-loaded nanocapsules was probably sufficient to achieve a high intracellular concentration of indomethacin-loaded nanocapsules, and the subsequent intracellular release of the drug led to glioma cell death. This result is relevant since tumor-specific targeting is an improvement over classical chemotherapeutics, which adversely affect both diseased and normal brain in a non-specific manner.Citation4
Inhibition of apoptosis and cell-cycle deregulation are two mechanisms of tumor formation. Therefore, it is desired that chemopreventive agents act by inducing apoptosis and cell-cycle arrest to block the carcinogenic process.Citation34,Citation35 In addition, defects in apoptotic signaling pathways, such as p53 mutations and caspase downregulation, can promote chemoresistance and thereby limit the effectiveness of chemotherapeutics.Citation36,Citation37 Our results showed that, at all concentrations tested, IndOH-LNC induced cell death mostly by apoptosis in C6 and U138-MG glioma cells. Despite the distinct genetic differences between C6 (PTEN and p53 wild-type) and U138-MG (PTEN and p53 mutant) cell lines, we found that both lines were sensitive to cell death triggered by IndOH-LNC, although the U138-MG cell line was more sensitive. This result is relevant because only about 35% of GBMs have mutant p53; therefore, it is important to select a therapy that can function independently of tumors’ p53 mutational status.Citation38
The PI3K/AKT signaling pathway has a key role in regulating cell-cycle progression and apoptosis. The ectopic expression of AKT induces cell survival and malignant transformation, whereas the inhibition of AKT activity stimulates apoptosis in a range of mammalian cells.Citation39 Thus, AKT is an attractive target for chemotherapy. It has been postulated that the inhibition of AKT alone or in combination with standard cancer chemotherapy will reduce the apoptotic threshold in cancer cells. The PI3K/AKT pathway is frequently aberrantly activated in GBM as result of a mutation or the loss of the tumor suppressor PTEN. Given that AKT is activated in approximately 70% of gliomas, the deregulation of the PI3K signaling pathway is an attractive target for therapy.Citation40 Our results showed that 25 μM IndOH-LNC (the IC50 value, approximately) was effective in reducing the phosphorylation levels of AKT after 1, 6, and 24 hours of treatment in C6 and U138-MG glioma cell lines. AKT may exert one of its downstream effects via the phosphorylation/inactivation of GSK-3β, which in turn inhibits β-catenin ubiquitination and degradation,Citation40 resulting in increased β-catenin nuclear translocation.Citation42 The Wnt/β-catenin complex regulates the transcription of multiple genes involved in cellular proliferation, differentiation, survival, and apoptosis, such as Fra-1, c-myc, and cyclin D.Citation43 Increasing evidence indicates that aberrant activation of the Wnt/β-catenin signaling pathway plays a key role in glioma development and progression.Citation44 We therefore determined whether the IndOH-LNC–induced decrease in AKT phosphorylation changed GSK-3β phosphorylation and/or β-catenin levels. We found that the decrease in AKT phosphorylation (rendering it inactive) after treatment with 25 µM IndOH-LNC was accompanied by a decrease in GSK-3β phosphorylation (rendering it active). In addition, IndOH-LNC treatment reduced β-catenin levels. Taken together, these results suggest that AKT inactivation may lead to reduced nuclear levels of β-catenin, thereby negatively modulating glioma cell growth. Moreover, in the same manner as AKT, GSK-3β and β-catenin are important in the generation of an anti-apoptotic response. For this reason, inactivation of AKT and β-catenin, as well as activation of GSK-3β, could account, at least in part, for the apoptosis induced by IndOH-LNC in GBM cells.
It is worth noting that IndOH-LNC treatment modulated the cell-cycle dynamics of GBM cells. Cell-cycle analysis indicated that 25 μM IndOH-LNC caused G0/G1 phase arrest in C6 and U138-MG glioma cells. This G0/G1 arrest was accompanied by the formation of a sub-G1 population of cells, suggesting that G0/G1 arrest preceded DNA fragmentation and consequently apoptosis. This confirms the result obtained with annexin V staining. IndOH-LNC induced G2/M phase arrest in U138-MG cells only, in agreement with the greater percentage of apoptotic cells observed among U138-MG cells than among C6 glioma cells. Additionally, G2/M arrest, as an early step in the apoptotic mechanism, could also contribute to the selectivity of IndOH-LNC, since cancer cells constantly progress through S to G2/M phase, in contrast to nonproliferative cells.
We observed down- or upregulation of a number of cell-cycle regulators in GBM cells treated with IndOH-LNC, which is consistent with the outcome of cell-cycle arrest. Cyclin D1, one of the checkpoints in the G1 to S phase transition, was downregulated by IndOH-LNC in glioma cells. The phosphorylation of pRb also decreased in both cell lines after IndOH-LNC treatment. On the other hand, the CDK4 and CDK6 proteins were unaltered, suggesting that the reduction of cyclin D1 and pRb proteins represses the cyclin D1-CDK4/6-Rb pathway. Furthermore, in agreement with the G2/M arrest observed in U138-MG glioma cells, IndOH-LNC treatment reduced cyclin B1 levels and the phosphorylation status of cdc2. We also observed an increase in Wee1 levels and an accumulation of p21WAF1, components of the G2/M checkpoint that inhibits cdc2. These results are in agreement with the AKT downregulation induced by IndOH-LNC treatment, since when AKT is phosphorylated (rendering it active) it inhibits Wee1 and p21WAF1, driving the inhibition of the cyclin B1/cdc2 complex and consequently the progression of G2/M.
The effects of cyclin D1 regulation on cell growth are clear. Cyclin D1 binds to CDK4/CDK6 and phosphorylates Rb, which then releases the transcription factor E2F1, allowing it to transcribe genes that promote the G1/S phase transition. Thus, downregulation of cyclin D1 reduces Rb phosphorylation, inhibits E2F1 release, and ultimately hampers the entry of cells into S phase. In the mechanism by which IndOH-LNC represses proliferation, elevated p21 could inactivate the cyclin D1-CDK4/6 complexes. Additionally, accumulating evidence demonstrates that cyclin D1 levels are tightly regulated through multiple mechanisms, including the PI3K/AKT/GSK-3β and/or Wnt/β-catenin pathways. Several studies reported that inhibition of the PI3K/AKT/GSK-3β pathway, which culminates in GSK-3β activation, enhanced cyclin D1 protein stability and caused cyclin D1 accumulation.Citation46,Citation47 GSK-3β negatively influences cyclin D1 expression by regulating mRNA transcription and protein degradation.Citation47 When transformed to its active form, GSK-3β regulates gene expression by phosphorylating specific aminoterminal residues of β-catenin, such as Ser33, Ser37, and Thr41, which first increases the degradation of cytoplasmic β-catenin, then inactivates Wnt/β-catenin signaling, and finally reduces cyclin D1 promoter activity.Citation47 Thus, in the genesis and development of cancer, cyclin D1 is considered a cellular proto-oncogene that may be a candidate target to inhibit cell proliferation and induce cell differentiation in cancer therapy. Taken together, our results showed that control of the cell cycle can be modulated by the inactivation of AKT and β-catenin and the activation of GSK-3β, as observed in GBM cells treated with IndOH-LNC.
Differentiation therapy, using agents that promote cancer cell differentiation, has been shown to be effective in in vitro and in vivo treatments of several types of cancer cells.Citation48 The most successful clinical application of differentiation therapy has been the introduction of retinoic acid for the treatment of acute promyelocytic leukemia.Citation49 Furthermore, the induction of cellular differentiation has become a promising therapeutic strategy against solid tumors, including glioma.Citation50 The tumorigenic potential of GBM cells is, in part, attributable to their undifferentiated (neural stem cell-like) phenotype. The differentiation of glioma cells toward an astrocytic type is characterized by morphological transformation and the expression of differentiation markers. Astrocytic differentiation of GBM cells is associated with the transcriptional induction of GFAP and repression of nestin, whereas the reciprocal transcription program operates in undifferentiated GBM cells. GFAP is a well known biomarker of astrocyte differentiation.Citation51 Several reports demonstrated that transfection of astrocytoma cells with GFAP cDNA effectively inhibit proliferation and tumorigenicity and induce morphologic alteration. Furthermore, GFAP is not only a reliable marker for gliogenesis but also a tumor suppressor gene in malignant glioma pathogenesis.Citation53,Citation54 Nestin, an intermediate filament protein, is one marker that has been used to identify neural stem cells and is expressed in almost all GBMs.Citation31 Nestin is downregulated in mature cells and is expressed in astrocytes of the adult central nervous system in response to cellular stress, such as neoplastic transformation.Citation54 A high level of nestin expression reportedly indicates significantly shorter survival of glioma patients.Citation32 Nestin may therefore correlate with invasiveness, being expressed mainly in the tumor periphery in the human brain.Citation32 Additionally, the coexpression of nestin with the CD133 cell surface antigen in tumor cells has been investigated in detail because this phenotype is considered a marker of cancer stem cells.Citation55 In the present study, we found that IndOH-LNC treatment upregulated GFAP protein expression and downregulated nestin in GBM cells. In addition, IndOH-LNC treatment induced a low staining for CD133 in U138-MG glioma cells. Therefore, our findings suggest that IndOH-LNC might function as a potential differentiation-supporting agent in treatments against malignant gliomas. The molecular mechanisms underlying the regulation of cancer cell differentiation remain elusive. Cell-cycle progression and differentiation are opposing but tightly linked events. In particular, G1 exit is a critical stage of the cell cycle where cells decide either to re-enter the cell cycle or differentiate.Citation56 Compared with the definite role of cyclin D1 in cell-cycle regulation, the action of cyclin D1 in cell differentiation is less clear. However, reports have demonstrated that inhibition of cyclin D1 induces the differentiation of several tumor cell lines.Citation57,Citation58 Considering that our results showed that downregulation of cyclin D1 was induced by IndOH-LNC treatment in GBM cells, this mechanism could contribute to the cell differentiation observed here.
Conclusion
Overall, the data presented herein clearly show that multiple molecular mechanisms are involved in the tumor-suppressive effects of IndOH-LNC in glioma cells. IndOH-LNC inactivated AKT and activated GSK-3β, thus inhibiting growth and inducing apoptotic cell death. In conjunction with these changes, IndOH-LNC modulated the cell-cycle dynamics of GBM cells. Cells arrested in G0/G1 and G2/M phases after IndOH-LNC treatment, with concomitant decreases in cyclin D1 and pRb phosphorylation and increases in the levels of Wee1 and CDK inhibitor p21WAF1, among others. Additionally, the IndOH-LNC formulation promoted GBM cell differentiation. These findings, together with our previous results using a preclinical model of glioma, suggest that IndOH-LNC may be a candidate for further testing in clinical studies of gliomas.
Acknowledgments
This study was supported by the Brazilian Agencies Coordenação de Aperfeiçoamento de Pessoal de Nível Superior (CAPES), Conselho Nacional de Desenvolvimento Científico e Tecnológico (CNPq), and Fundação de Amparo à Pesquisa do Estado do Rio Grande do Sul (FAPERGS). The authors thank PRONEX CNPq-FAPERGS (#10/0048-4). A Bernardi was a recipient of CAPES and CNPq postdoctoral fellowships. RL Frozza and JB Hoppe were recipients of CNPq PhD fellowships. The authors thank Sílvia Resende Terra for technical assistance with flow cytometry analysis.
Disclosure
The authors report no conflicts of interest in this work.
References
- HollandECGliomagenesis: genetic alterations and mouse modelsNature Rev Genet20012210201129
- NicholasMKGlioblastoma multiforme: evidence-based approach to therapyExpert Rev Anticancer Ther2007712S23S2718076314
- HengartnerMOThe biochemistry of apoptosisNature200040680577077611048727
- MercerRWTylerMAUlasovI VLesniakMSTargeted therapies for malignant glioma: progress and potentialBio Drugs20092312535
- BrennanCMomotaHHambardzumyanDGlioblastoma subclasses can be defined by activity among signal transduction pathways and associated genomic alterationsPLoS One2009411e775219915670
- PinesJFour-dimensional control of the cell cycleNat Cell Biol199913E73E7910559915
- TashiroETsuchiyaAImotoMFunctions of cyclin D1 as an oncogene and regulation of cyclin D1 expressionCancer Sci200798562963517359287
- DaiCHollandECAstrocyte differentiation states and glioma formationCancer J200392728112784872
- SpiraAICarducciMADifferentiation therapyCurr Opin Pharmacol20033433834312901941
- LiuXYangJMZhangSSLiuXYLiuDXInduction of cell cycle arrest at G1 and S phases and cAMP-dependent differentiation in C6 glioma by low concentration of cycloheximideBMC Cancer20101068421159181
- BoulaizHAlvarezPJRamirezANanomedicine: application areas and development prospectsInt J Mol Sci20111253303332121686186
- VizirianakisISNanomedicine and personalized medicine toward the application of pharmacotyping in clinical practice to improve drug-delivery outcomesNanomedicine201171111721094279
- WongHLBendayanRRauthAMYongqiangLWuXYChemotherapy with anticancer drugs encapsulated in solid lipid nanoparticlesAdv Drug Deliv Rev200759649150417532091
- LockmanPRKoziaraJRoderKEIn vivo and in vitro assessment of baseline blood–brain barrier parameters in the presence of novel nanoparticlesPharm Res200320570571312751624
- Garcia-GarciaEAndrieuxKGilSCouvreurPColloidal carriers and blood–brain barrier (BBB) translocation: a way to deliver drugs to the brain? Int J Pharm2005298227429215896933
- PohlmannARMezzaliraGVenturinCDetermining the simultaneous presence of drug nanocrystals in drug-loaded polymeric nanocapsule aqueous suspensions: a relation between light scattering and drug contentInt J Pharm20083591–228829318495390
- BernardiABraganholEJägerEIndomethacin-loaded nano-capsules treatment reduces in vivo glioblastoma growth in a rat glioma modelCancer Lett20092811536319286307
- BernardiAFrozzaRLHornA PProtective effects of indomethacin-loaded nanocapsules against oxygen-glucose deprivation in organotypic hippocampal slice cultures: involvement of neuroinflammationNeurochem Int201057662963620691236
- FrozzaRLBernardiAPaeseKCharacterization of transresveratrol-loaded lipid-core nanocapsules and tissue distribution studies in ratsJ Biomed Nanotechnol20106669470321361135
- BernardiAZilbersteinACJägerEEffects of indomethacin-loaded nanocapsules in experimental model of inflammation in ratsBr J Pharmacol200915841104111119422380
- FessiHPuisieuxFDevissaguetJ PAmouryNBenitaSNanocapsules formation by interfacial polymer deposition following solvent displacementInt J Pharm1989113r1r4
- JägerEVenturiniCGPolettoFSSustained release from lipid-core nanocapsules by varying the core viscosity and the particle surface areaJ Biomed Nanotechnol20095113014020055116
- JornadaDSFielLABuenoKLipid-core nanocapsules: mechanism of self-assembly, control of size and loading capacitySoft Matter2012826462655
- PohlmannARSoaresLUCruzLDa SilveiraN PGuterresSSAlkaline hydrolysis as a tool to determine the association form of indomethacin in nanocapsules prepared with poly(epsilon-caprolactone)Curr Drug Deliv20041210311016305375
- LenzGGonçalvesDLuoZAvruchJRodnightRNearyJExtracellular ATP stimulates an inhibitory pathway towards growth factor-induced cRaf-1 and MEKK activation in astrocyte culturesJ Neurochem20017741001100911359865
- BernardiAFrozzaRLJägerESelective cytotoxicity of indomethacin and indomethacin ethyl ester-loaded nanocapsules against glioma cell lines: an in vitro studyEur J Pharmacol20085861–3243418371953
- Zanotto-FilhoABraganholESchröderRNFκB inhibitors induce cell death in glioblastomasBiochem Pharmacol201181341242421040711
- PetersonGLReview of the folin-phenol protein quantification method of Lowry, Rosebrough, Farr and RandallAnal Biochem19791002201220393128
- VivancoISawyersCLThe phosphatidylinositol 3-Kinase AKT pathway in human cancerNat Rev Cancer20022748950112094235
- ZhangJHuangKShiZHigh b-catenin/Tcf-4 activity confers glioma progression via direct regulation of AKT2 gene expressionNeuro Oncol201113660060921636708
- WieseCRolletschekAKaniaGNestin expression – a property of multi-lineage progenitor cells? Cell Mol Life Sci20046119–202510252215526158
- StrojnikTRoslandG VSakariassenPOKavalarRLahTNeural stem cell markers, nestin, and musashi proteins in the progression of human glioma: correlation of nestin with prognosis of patient survivalSurg Neurol200768213314317537489
- LamprechtABenoitJ PEtoposide nanocarriers suppress glioma cell growth by intracellular drug delivery and simultaneous P-glycoprotein inhibitionJ Control Release2006112220821316574265
- WrightSCZhongJLarrickJ WInhibition of apoptosis as a mechanism of tumor promotionFASEB J1994896546608005393
- CollinsKJacksTPaveltichNPThe cell cycle and cancerProc Natl Acad Sci U S A1997947277627789096291
- LoweSWBodisSMcClatcheyAp53 status and the efficacy of cancer therapy in vivoScience199426651868078107973635
- JaattelaMMultiple cell death pathways as regulators of tumour initiation and progressionOncogene200423162746275615077138
- RaoSKEdwardsJJoshiADSiuIMRigginsGJA survey of glioblastoma genomic amplifications and deletionsJ Neurooncol201096216917919609742
- ChengJQAltomareDAKleinMATransforming activity and cell cycle-dependent expression of the AKT2 oncogene: evidence for a link between cell cycle regulation and oncogenesisOncogene19971423279328019190895
- SawyersCLRational therapeutic intervention in cancer: kinases as drug targetsCurr Opin Genet Dev200212111111511790564
- WidelitzRWnt signaling through canonical and non-canonical pathways: recent progressGrowth Factors200523211111616019432
- ChengJQLindsleyCWChengGZYangHNicosiaSVThe Akt/PKB pathway: molecular target for cancer drug discoveryOncogene200524507482749216288295
- YochumGSClelandRGoodmanRHA genome-wide screen for beta-catenin binding sites identifes a downstream enhancer element that controls c-Myc gene expressionMol Cell Biol200828247368737918852287
- SareddyGRPanigrahiMChallaSMahadevanABabuPPActivation of Wnt/beta-catenin/Tcf signaling pathway in human astrocytomasNeurochem Int200955530731719576519
- Dal ColJDolcettiRGSK-3beta inhibition: at the crossroad between Akt and mTOR constitutive activation to enhance cyclin D1 protein stability in mantle cell lymphomaCell Cycle20087182813281618769147
- OngCSZhouJOngCNShenHMLuteolin induces G1 arrest in human nasopharyngeal carcinoma cells via the Akt-GSK-3beta-Cyclin D1 pathwayCancer Lett2010298216717520655656
- Takahashi-YanagaFSasaguriTGSK-3beta regulates cyclin D1 expression: a new target for chemotherapyCell Signal200820458158918023328
- LeszczynieckaMRobertsTDentPGrantSFisherPBDifferentiation therapy of human cancer: basic science and clinical applicationsPharmacol Ther2001902–310515611578655
- PetrieKZelentAWaxmanSDifferentiation therapy of acute myeloid leukemia: past, present and futureCurr Opin Hematol2009162849119468269
- KawamataHTachibanaMFujimoriTImaiYDifferentiation-inducing therapy for solid tumorsCurr Pharm Des200612337938516454751
- RoymansDVissenbergKDe JongheCPhosphatidylinositol 3-kinase activity is required for the expression of glial fibrillary acidic protein upon cAMP-dependent induction of differentiation in rat C6 gliomaJ Neurocehm2001762610618
- DuffyPEHuangY YRapportMMThe relationship of glial fbril-lary acidic protein to the shape, motility, and differentiation of human astrocytoma cellsExp Cell Res198213911451577200901
- RutkaJTHubbardSLFukuyamaKMatsuzawaKDirksPBBeckerLEEffects of antisense glial fibrillary acidic protein complementary DNA on the growth, invasion, and adhesion of human astrocytoma cellsCancer Res19945412326732728205549
- TohyamaTLeeVMYRorkeLBMarvinMMcKayRDGTrojanowskiJQNestin expression in embryonic human neuroepithelium and in human neuroepithelial tumor cellsLab Invest19926633033131538585
- SinghSKHawkinsCClarkeIDIdentification of human brain tumour initiating cellsNature2004432701539640115549107
- GeorgopoulouNHurelCPolitisPKGaitanouMMatsasRThomaidouDBM88 is a dual function molecule inducing cell cycle exit and neuronal differentiation of neuroblastoma cells via cyclin D1 down-regulation and retinoblastoma protein hypophosphorylationJ Biol Chem200628144336063362016893893
- Strasberg RieberMRieberMSuppression of cyclin D1 but not cdk4 or cyclin A with induction of melanoma terminal differentiationBiochem Biophys Res Commun199521614224277488122
- NishiKInoueHSchnierJBRiceRHCyclin D1 downregulation is important for permanent cell cycle exit and initiation of differentiation induced by anchorage-deprivation in human keratinocytesJ Cell Biochem20091061637219021145