
Abstract
Introduction
The design of delivery tools that efficiently transport drugs into cells remains a major challenge in drug development for most pathological conditions. Triple-negative breast cancer (TNBC) is a very aggressive subtype of breast cancer with poor prognosis and limited effective therapeutic options.
Purpose
In TNBC treatment, chemotherapy remains the milestone, and doxorubicin (Dox) represents the first-line systemic treatment; however, its non-selective distribution causes a cascade of side effects. To address these problems, we developed a delivery platform based on the self-assembly of amphiphilic peptides carrying several moieties on their surfaces, aimed at targeting, enhancing penetration, and therapy.
Methods
Through a single-step self-assembly process, we used amphiphilic peptides to obtain nanofibers decorated on their surfaces with the selected moieties. The surface of the nanofiber was decorated with a cell-penetrating peptide (gH625), an EGFR-targeting peptide (P22), and Dox bound to the cleavage sequence selectively recognized and cleaved by MMP-9 to obtain on-demand drug release. Detailed physicochemical and cellular analyses were performed.
Results
The obtained nanofiber (NF-Dox) had a length of 250 nm and a diameter of 10 nm, and it was stable under dilution, ionic strength, and different pH environments. The biological results showed that the presence of gH625 favored the complete internalization of NF-Dox after 1h in MDA-MB 231 cells, mainly through a translocation mechanism. Interestingly, we observed the absence of toxicity of the carrier (NF) on both healthy cells such as HaCaT and TNBC cancer lines, while a similar antiproliferative effect was observed on TNBC cells after the treatment with the free-Dox at 50 µM and NF-Dox carrying 7.5 µM of Dox.
Discussion
We envision that this platform is extremely versatile and can be used to efficiently carry and deliver diverse moieties. The knowledge acquired from this study will provide important guidelines for applications in basic research and biomedicine.
Graphical Abstract
Introduction
Advances in nanotechnology reveal its massive power in the development of delivery platforms considered formidable instruments for the storage and transport of drugs in the treatment of many pathologies.Citation1,Citation2 Depending on their size, morphology and chemical properties, nanoplatforms provide an extensive and versatile portfolio of biological roles, including targeting specificity, controlled drug release, administration of a reduced amount of the drug, ability to cross a range of biological barriers, as well as a reduction or bypassing of drug resistance phenomenon and reduction of systemic toxicity.Citation3,Citation4 The development of nanocarriers loaded with a combination of drugs and other moieties promotes a timely and spatially controlled co-delivery of specific amounts of different bioactive compounds, aimed to activate synergistic effects via different pathways thereby increasing their individual efficacy and enhancing drug diffusion and accumulation.Citation4,Citation5 In recent years, peptide-based nano-assemblies have shown various advantageous facets in drug delivery, such as tunable design, biocompatibility, bifunctionalities, easy synthesis, possibility to exploit on demand strategies and low toxicity compared to other non-biological materials as they are hydrolyzed into amino acids in the body and utilized by surrounding tissues.Citation6,Citation7 Self-assembly is a relatively simple phenomenon in which peptides spontaneously arrange and form structurally distinct and stabilized nanostructures via intermolecular non-covalent interactions including hydrophobic contacts, hydrogen bonding, π−π stacking, metal−ligand complexation, and van der Waals forces.Citation8–11 According to their chemical structures, the balance among the components themselves, the impact of environmental parameters such as ionic strength, pH, temperature, and assembling rate, they may assume various morphologies with defined dimensions, such as nanospheres, nanofibers, nanoribbons, and nanotubes.Citation12,Citation13
When compared to the monomeric peptides, these self-assembled nanosystems show completely different therapeutic properties and generally overcome stability limitations associated with monomeric peptides to greatly expand their biomedical utility. Furthermore, the shape of the nanoplatforms obtained from the peptide assembly is a key determinant of in vivo fate.Citation14 Stupp et al previously showed that filament-like nanomaterials effectively localized to the arterial endothelium in vivo, while spherical constructs of similar size did not,Citation15 which clearly indicates the importance of nanoparticle morphology. Non-spherical nanoparticles also have a higher surface area for multi-functionalization. Furthermore, self-assembly sequences may be tailored with other functionalities, making it relatively easy to tune their activity by simply changing the number and/or nature of the different moieties on the surface without modifying the self-assembled nanostructure. Furthermore, filament-like nanomaterials present a higher ability to penetrate cells exploiting the small diameter of the fiber, which clearly allows enhanced internalization. The drawback of these systems is that usually they are more difficult to synthesize and characterize.Citation16
The use of peptide amphiphiles (PAs) is an interesting approach for enabling self-assembly into highly ordered nanostructures. The conjugation of hydrophilic amino acid sequences to a lipophilic moiety or the arrangement of amino acids in a peptide sequence so as to have hydrophobic and hydrophilic domains, guides the construction of PAs.Citation17 As long as they are made from natural amino acids, the main benefit of PAs is that they are biocompatible and biodegradable. The hydrophobic-to-hydrophilic ratio of the peptide controls the self-aggregation behavior of PAs, which is also significantly influenced by small changes in the structure, leading to drastic changes in the size and properties of the self-assembled structures. Thus, manipulating the structures of these amphiphilic molecules allows the control of the process by which they aggregate and produce materials with tunable properties. The morphology and physicochemical properties of self-assembled structures must be systematically investigated after each change in structure. Nonetheless, the versatility of these platforms paves the way for easy modulation of properties to straightforwardly address different pathologies with particular attention to cancer.Citation18
In this context, cancer embodies a pathological condition that could benefit from the therapeutic use of selected drug delivery platforms.Citation19–21 Breast cancer (BC) is the most malignant cancer diagnosed in women, and its incidence rates worldwide are gradually increasing.Citation22,Citation23 BC is classified into various subtypes, including luminal A, luminal B, human epidermal growth factor receptor 2 (HER2)-enriched, and triple-negative breast cancer (TNBC), mostly occurring in premenopausal young women.Citation24,Citation25 TNBC phenotypes are typically very invasive and endowed with high metastatic potential, sub-grouped by molecular heterogeneity into subtypes with distinct outcomes and drug sensitivities. They share a dysregulated expression of the human epidermal receptor (HER) family members involved in cell growth and proliferation. While HER2 is deficient, HER1 (EGFR) is frequently overexpressed and associated with poor clinical outcomes; however, the diagnostic and prognostic significance of this biomarker is yet to be understood.Citation26,Citation27 Thus, TNBC represents the hardest clinical challenge because the absence of therapeutic targets makes it difficult to develop effective treatments.Citation28–30 At present, the therapeutic options are mainly restricted to surgical resection supplemented with radiotherapy and conventional chemotherapy (ie anthracyclines and taxane), although these latter are highly toxic with consequent severe off-target toxicity.Citation29,Citation31 Unfortunately, as a result of repeated treatments with chemotherapeutics, there is a high likelihood of de novo and/or acquired resistance and the development of therapy-resistant metastases in vital organs, resulting in a high mortality rate.
Exploring the molecular mechanisms of TNBC, valuable therapeutic targets have been recently identified that could contribute to the diagnosis or reinforce the effectiveness of standard TNBC treatments.Citation32,Citation33 Although novel therapeutic treatments are under evaluation, chemotherapy remains the milestone of TNBC. The anthracycline doxorubicin (Dox), in combination with a taxane (ie, paclitaxel and docetaxel), represents the first-line systemic treatment for TNBC,Citation34 but its non-selective distribution causes a cascade of side effects, including cardiotoxicity, hepatotoxicity, and nephrotoxicity. Thus, to bypass its toxicity, several Dox delivery approaches have been used, such as a liposomal formulation that showed lower cardiotoxicity and similar anticancer efficacy compared to free-Dox.Citation35
In this framework, we developed a self-assembled peptide platform for achieving targeted and controlled release of Dox in TNBC cells. Our approach is based on PA technology, inspired by the peptide amphiphile designs of StuppCitation36 and TirrellCitation37 which spontaneously form supramolecular nanofibers upon immersion in aqueous solutions. Considering that hydrophobic interactions are the predominant driving force in this bottom-up strategy, we designed PAs that can self-assemble in aqueous solutions with the key advantage that diverse functionalities can be directly incorporated into the peptide sequence and located on the surface of the fiber, as long as the effects of the moieties on self-assembly behavior are considered. Thus, we designed a structurally defined nano-assembly made purely of peptides and a hydrocarbon chain (C19) that is tailored to efficiently and selectively enter cells and deliver Dox to TNBC. In our design, the nanoplatform was composed of two structural peptides, characterized by the presence of an amino acid sequence of aliphatic residues containing a lipidic tail (C19) and charged amino acid residues implicated in peptide assembly. In addition, the surface of the nano-assembly was functionalized with gH625, a well-known sequence with tissue-penetrating capabilities through the promotion of temporary lipid membrane-reorganizing processes, which was developed and extensively explored for use in drug delivery by our group.Citation38–41 The surface of the nano-assembly was further decorated with the targeting sequence YHWYGYTPENVI (P22), which is able to recognize the overexpressed epidermal growth factor receptor (EGFR).Citation42 Regarding the drug, Dox is covalently bound to the fiber surface through an on-demand strategy that allows for drug release at the target site. The on-demand strategy used herein exploits the presence of overexpressed matrix metalloproteinase 9 (MMP-9) at the tumor site, introducing an MMP-9 specific cleavage sequence between Dox and the fiber. Indeed, it has been proven that TNBC cells produce large amounts of matrix metalloproteinases (MMPs), including MMP-9, as regulators of the tumor microenvironment and are specifically required for cancer development, progression, invasion, and metastasis formation.Citation43 Changing the internalization pathway, thanks to gH625, and the release of the drug, thanks to the on-demand strategy, may also represent a key approach to overcome Dox resistance.Citation44
Herein, we describe the preparation of the nanoplatform and its physicochemical characterization in terms of size, morphology, and surface charge. In addition, studies of nanoplatform uptake by TNBC cancer cells, related cytotoxicity, and release of Dox in the presence of active MMP-9 were analyzed. To the best of our knowledge, the self-assembled peptide nanovectors that have been developed may offer a means of achieving the desired personalized medicine for the treatment of a number of pathologies.
Materials and Methods
Materials
Nα-Fmoc-protected amino acids Fmoc-Ala, Fmoc-Lys(Boc), Fmoc-Arg(Pbf), Fmoc-Gly, Fmoc-Asp(OtBu), Fmoc-Ser(tBu), Fmoc-His(Trt), Fmoc-Leu, Fmoc-Thr(tBu), Fmoc-Trp(Boc), Fmoc-Tyr(tBu), Fmoc-Asn(Trt), Fmoc-Ile, Fmoc-Phe, Fmoc-Cys(Trt), Fmoc-Pro, Fmoc-Glu(OtBu), and Fmoc-Val were purchased from GL Biochem Ltd. (Shanghai, China). Rink amide p-methylbenzhydrylamine (MBHA) resin, Fmoc-Lys(Mtt), piperidine, trifluoroacetic acid (TFA), N,N-diisopropylethylamine (DIEA), pure oxyma, and 1-[bis (dimethylamino)methylene]-1H-1,2,3-triazolo[4,5-b]pyridinium 3-oxid hexafluorophosphate (HATU). 1,1,1,3,3,3-Hexafluoro-2-propanol (HFIP), nonadecanoic acid (C19), N,N’-diisopropylcarbodiimide (DIC), triisopropylsilane (TIS), matrix metalloproteinase-9 (MMP-9), Nile Red, Thioflavin T, trypsin, chymotrypsin from bovine pancreas, 5(6)-carboxyfluorescein, L-glutamine, penicillin (100 units/mL), and streptomycin (100 μg/mL) were purchased from Merck (Milan, Italy). Doxorubicin (Doxo-EMCH) was purchased from D.B.A. Italia s.r.l. (Perugia, Italy).
Human breast adenocarcinoma cells MDA-MB-231 (Triple-Negative Breast Cancer, TNBC) were acquired from ATCC (code: HTB-26TM). The human keratinocyte (HaCaT) cell lines were provided by Dr. Valeria Cicatiello of the Italian National Research Council, Institute of Genetics and Biophysics, Naples, Italy and now, they are available in the cellular bank of the BioChemLab at the Department of Pharmacy, University of Naples, Federico II, and were authenticated by STR profile. DMEM was bought by Invitrogen (Paisley, UK), and fetal bovine serum FBS (10%) was purchased from Cambrex (Verviers, Belgium).
Peptide Synthesis and Purification
All self-assembled peptides (P1–P6) reported in were synthesized using ultrasonic-assisted solid-phase peptide synthesis (US–SPPS) methodology.Citation45
Table 1 Peptide Sequence of Self-Assembled Peptides P1–P6
For conjugation of the lipid tail, C19, Fmoc-Lys(Mtt)-OH was linked to the resin as the first amino acid for each self-assembled peptide.Citation46 The peptide assembly was achieved by repeated cycles of Fmoc deprotection and coupling reactions. The Fmoc group was removed by the treatment with a solution of 20% piperidine in DMF (2×5 min under ultrasound). The coupling reactions were performed through two cycles: in the first cycle, a mixture of Fmoc-AA (2 equiv), DIC (2 equiv), Oxyma (2 equiv) in DMF was added to the resin that was exposed to ultrasonic irradiation for 10 min, followed by the addition of Fmoc-AA (2 equiv), HATU (2 equiv), and DIPEA (4 equiv) in DMF for 10 min under ultrasound. At the end of synthesis, the lipid tail of C19 was conjugated after Mtt deprotection from the lysine residue at C-terminus. The Mtt group was removed using an acid cocktail of TFA:TIS:DCM (1:5:94, v:v:v) through repeated cycles (10 times) for 20 min. Mtt deprotection was monitored using the Kaiser test, and acetylation tests were carried out on a small amount of resin. A shift in the retention time of the acetylated product, observed through HPLC analysis, indicated complete deprotection of the Mtt group. Then, conjugation of nonadecanoic acid (2 equiv) was performed using HATU (2 equiv) and DIPEA (4 equiv) in NMP for 2h under conventional stirring. This coupling was repeated a second time. After confirming C19 conjugation through HPLC and ESI-MS, each self-assembled peptide was released from the resin, along with all protecting groups, by treatment with the acid cocktail TFA:TIS:H2O (95:2.5:2.5, v:v:v) for 3h under stirring. The resin was filtered and the solution containing the peptide was precipitated twice with chilled diethyl ether (Et2O) and centrifuged (6000 rpm) for 15 min. The crude peptide was lyophilized overnight and then dissolved in 1,1,1,3,3,3-Hexafluoro-2-propanol (HFIP) (10%) and H2O (0.1% TFA) to be purified by the preparative HPLC. The peptide purification was performed on a Phenomenex Kinetex C18 column, 5 μm, 100 Å, 150×21.2 mm) using linear gradients of MeCN (0.1% TFA) in water (0.1% TFA), from 10 to 90% over 35 min, with a flow rate of 15 mL/min and UV detection at 220 nm.Citation47 The pure profile of each peptide was ascertained by the analytical HPLC (Jasco LC-NetII/ADC) by using Phenomenex Jupiter 4u Proteo column, 90Å, 150×4.6 mm, and the identity was confirmed by Electrospray Ionization Mass Spectrometry (ESI-MS) analysis (Figures S1–S4 and Table S1).
Dox-EMCH Conjugation
Peptide P4 with a cysteine residue at the N-terminus was synthesized for Dox conjugation. The reaction between the free thiol on the cysteine side chain and the maleimide moiety on Dox-EMCH was performed in solution as described previously by Del Genio et al.Citation46 Dox-EMCH (2 equiv), dissolved in water/DMF (1:1, v:v), was added dropwise at 25 μL/min to the pure peptide P4 dissolved in PBS 1X (pH 7.4) under traditional stirring for 90 min at 25°C in the dark. DMF was then removed in vacuo and the Dox-conjugated peptide P5 was purified by dialysis with the membrane MWCO Da11000. The identity of P5 was confirmed by NMR spectroscopy as previously reported.Citation46
Fluorescein-Labelling of Peptide P2
Peptide P2 was labeled with 5(6)-carboxyfluorescein (Fam) at the N-terminus to perform microscopic experiments. After obtaining peptide P2 and adding C19, as described above, Fam was attached at the N-terminus after deprotection of the Fmoc group. Fam (2 equiv) was coupled with COMU (2 equiv), oxyma (2 equiv), and DIPEA (4 equiv) under stirring for 25 min.Citation48 The Fam coupling was repeated twice. The solution was then discarded, and the resin was washed with DMF (×3) and DCM (×3). Fam labeling was ascertained using HPLC and ESI-MS analyses. Finally, the peptide Fam-P2 was cleaved from the resin and purified as described above.
Peptide Assembly by Fluorescence Based-Assays
Peptide assembly was studied in an aqueous solution by determining the critical aggregation concentration (CAC) of each self-assembled peptide alone and in combination with each other. The CAC values were calculated using Nile Red (NR) as the fluorophore.Citation49,Citation50 In this experiment, each self-assembled peptide was dissolved in HFIP at a concentration of 400 μM. To determine the CAC value for each prepared nanofiber, peptides were co-assembled at a specific ratio for final nanofiber concentrations of 0.8, 1, 5, 10, 15, 20, 30, 50, 100, 150, and 200 μM. HFIP was then removed under a nitrogen stream, reconstituted with water (500 μL), sonicated for 15 min, and freeze-dried. For the measurements, each sample was hydrated with a NR solution of NR 500 nM in H2O for 1 h. The NR spectrum was recorded at a fluorescence emission wavelength between 570 and 700 nm (slit width, 5 nm) and an excitation wavelength of 550 nm (slit width, 10 nm). When NR moves from water into aggregates, it produces a hyper-hypsochromic effect consisting of a blue shift and an increase in the fluorescence intensity. For CAC determination, the maximum emission fluorescence corresponding to the wavelength (y) was plotted as a function of peptide concentration using the sigmoidal Boltzmann equation: y=A1–A2/1+e(x–x0/Δx)+A2, where A1 and A2 correspond to the upper and lower limits of the sigmoid, respectively. Instead, x0 and Δx are the inflection point and steepness of the sigmoid function, respectively. Nanofiber formation was studied using Thioflavin T (ThT) as a fluorescent dye. Nanofibers composed of P1+P2+P3 (50:45:5) and P1+P2+P3 with different percentages of P6 (1, 2.5, and 5%) were prepared at a final concentration of 100 μM. Then, HFIP was removed and each nanofiber was reconstituted with water and freeze-dried. For the measurement, nanofibers were hydrated with PBS 1X (pH 7.4) for 1 h and then ThT was added at a concentration of 25 μM. Each ThT spectrum was recorded at a fluorescence excitation wavelength of 450 nm (slit width, 10 nm) and fluorescence emission at 482 nm (slit width, 5 nm).
Structural Characterization by Transmission Electron Microscopy (TEM)
Transmission electron microscopy (TEM) images were acquired in the bright-field mode using a TEM TECNAI G2 20ST (Fei, Hillsboro, OR, USA) operating at an accelerating voltage of 120 kV. For sample preparation, lyophilized fibers were dissolved in Milli-Q water to a concentration of 30 μM and incubated at room temperature for 1 h. Five microliters of each sample were then deposited onto carbon-coated copper grids (200 mesh) and allowed to dry at room temperature. All samples were then treated twice with 5 μL of phosphotungstic acid (PTA) solution (2% w/v, pH 7) for negative staining. The staining solution was applied to the grids and removed with filter paper after 2 min. The average length and diameter of the fibers were calculated from the TEM images using the ImageJ software (National Institutes of Health, available free of charge at rsb.info.nih.gov/ij/).
Nanofibers Secondary Structure
The secondary structure of NF-Dox was explored by CD and FTIR spectroscopy. For the CD experiments, NF-Dox was prepared at a concentration of 100 μM and hydrated with 2 mL water. The CD spectra were recorded from 195 to 260 nm using a Jasco J-810 spectropolarimeter with a quartz cell (1.0 cm at room temperature. Each spectrum was obtained by averaging three scans and converting the signal to molar ellipticity. A Nicolet iS50 Fourier Transform Infrared (FTIR) spectrometer (by Thermo scientific) equipped with a macro-diamond-based Attenuated Total Reflection (ATR) module (smart itx-diamond by Thermo scientific) and a DTGS KBr detector was used to collect the FTIR spectra of the sample powders. NF-Dox (final concentration of 100 μM) was hydrated in deionized water, 20 µL was deposited on a glass substrate, dried, and the deposition procedure was repeated four times to obtain a good amount of the sample. The glass with the sample was in direct contact with the diamond plate of the ATR module using a pressure tip. The background was acquired from a diamond plate in air on glass, without a sample. All spectra were collected using 64 scans in the range 4000–525 cm−1 with a 0.482 cm−1 spectral resolution of 0.482 cm− 1. Each sample was analyzed in triplicate and averaged. To determine the secondary structure of the samples, the amide I band was analyzed.Citation51–53 In particular, the deconvolution of the FTIR spectra in the range of 1700–1600 cm−1 was analyzed by fitting the data with multiple Lorentzian peaks corresponding to the minima of the second derivative spectra. Second-derivative spectra were obtained with the Savitzky-Golay derivative function algorithm on seven data points using an in-house software.
Nanofibers Stability by Circular Dichroism Spectroscopy
The stability of P1+P2+P3+P5+P6 (50:27.5:5:15:2.5) was explored under different environments, including dilution, ionic strength, pH, and temperature using circular dichroism (CD) spectroscopy. Nanofibers were prepared at a final concentration of 100 μM as described above. The stability under the dilution effect was evaluated at concentrations of 80, 60, 50, 40, and 30 μM. The effect of ionic strength on the nanofibers at a concentration of 60 μM was evaluated using different concentrations of NaCl ranging from 1 to 5 mM. Similarly, the nanofiber stability under different pH environments was investigated by adjusting the pH using acidic or basic solutions. In addition, to evaluate the stability under the temperature effect, the melting point was determined through a CD experiment for NF-Dox (60 μM) performed from 25°C and 40°C. The CD spectrum of NF-Dox was recorded at 25°C (t=0) and 40 °C (t=0 and t=1 h).
All the CD spectra were recorded from 195 to 260 nm using a Jasco J-810 spectropolarimeter with a quartz cell (1.0 cm) at room temperature. Each spectrum was obtained by averaging three scans and converting the signal to molar ellipticity.
Nanofibers Stability Toward Trypsin and Chymotrypsin
The proteolytic stability of CPP gH625 and targeting peptide P22 placed on the nanofiber surface towards trypsin and chymotrypsin was evaluated. Nanofibers P1+P2+P3 (50:15:35) and P1+P2+P3+P6 (50:30:5:15), prepared at a final concentration of 400 μM, were hydrated with PBS 1X (pH 7.4) and TRIS-HCl (100 mM, pH 7.8) for trypsin and chymotrypsin, respectively. The nanofibers were incubated with 250 μg trypsin or chymotrypsin (1μM) at 37 °C.Citation54,Citation55 Aliquots of 100 μL were collected at the different time points of 1, 2, 3, 5, and 24 h, quenched with 0.2% TFA in H2O, and diluted with HFIP. The proteolytic cut was analyzed by HPLC analysis using a Jupiter 4u Proteo column, 90Å, 150×4.6 mm) with a flow rate of 1 mL/min using a gradient of MeCN (0.1% TFA) in water (0.1% TFA) from 10 to 90% over 20 min, and UV detection at 220 and 254 nm.
Nanofibers Preparation for Biological Experiments
Individual self-assembled peptides P1–P3, P5, and P6 were dissolved in HFIP at a concentration of 300 μM.Citation56 For nanofiber preparation, self-assembled peptides were co-assembled at different molar ratios at a final concentration of 100 μM, and the organic solvent was removed under a nitrogen stream. The samples were reconstituted in water, sonicated for 15 min in an ultrasonic bath, and freeze-dried overnight. The Lyophilized samples were stored at −20 °C until use.
Bioscreens in vitro
Human breast adenocarcinoma cells MDA-MB-231 were chosen as triple-negative tumor models expressing the EGFR receptor. The human keratinocyte HaCaT cell line was used as the healthy control. Both cell lines were grown in DMEM supplemented with L-glutamine (2 mM), fetal bovine serum FBS (10%), penicillin (100 units/mL), and streptomycin (100 μg/mL) and cultured at 37 °C in a humidified 5% CO2 atmosphere.
The cytotoxic activity of Doxorubicin (Dox), NF-Dox, NF (at different percentage of P6 peptide: 1, 2.5 and 5%), P1+P2, P1+P2+P3, and P1+P2+P6 (at different percentage of P6 peptide: 1, 2.5 and 5%) was examined by the estimation of a “cell survival index”. It comes from the combination of cell viability valuation (through MTT assay) with cell counting, as previously reported by us.Citation57,Citation58 MDA-MB-231 and HaCaT cells were seeded in 96-well culture plates at a density of 104 cells/well. After 24 h of cell growth, culture medium was replaced with fresh medium, and cells were treated for 48 and 72 h with a range of concentrations (1→50 μM) of Dox, NF-Dox, NF (at different percentages of P6 peptide: 1, 2.5, and 5%), P1+P2, P1+P2+P3, and P1+P2+P6 (at different percentages of P6 peptide: 1, 2.5, and 5%). Cell viability was evaluated using the MTT assay. This procedure calculates the level of mitochondrial dehydrogenase activity using yellow 3-(4,5-dimethyl-2-thiazolyl)-2,5-diphenyl-2H-tetrazolium bromide (MTT, Sigma) as a substrate, which is converted into insoluble purple formazan. Briefly, after the treatment, the culture medium was removed and the cells were incubated with 200 µL of fresh medium containing 10% of MTT solution (5 mg/mL) in a humidified 5% CO2 incubator at 37 °C. After 1 h of incubation, the MTT solution was removed and 100 μL/well of DMSO was added to solubilize the obtained formazan. Absorbance was measured at 550 nm using a Bio-Rad microplate reader (iMark microplate reader, Bio-Rad, Milan, Italy). Cell numbers were determined using a TC20 automated cell counter (Bio-Rad, Milan, Italy), which provides a precise and reproducible total cell count and live/dead ratio in one step using a specific dye (trypan blue) exclusion assay. The automated cell counter used slides loaded with a solution of cells and the trypan blue dye (1:1 ratio). Once the loaded slide was inserted into the instrument, it automatically focused on the cells, revealed the presence of the trypan blue dye, and finally provided a count. When cells are damaged or dead, trypan blue can enter the cell, allowing for the counting of living cells. The results are expressed in terms of the total cell count (number of cells per mL). Moreover, the total counts and live/dead ratios from random samples for each cell line were compared with those from manual hemocytometers in the control experiments. In addition, cell survival index was measured in both MDA-MB-231 and HaCaT cells pretreated with or without MMP-9. In particular, cells were pretreated or not with 40 nM of MMP9 activated enzyme for 24 h.Citation59 Subsequently, cells were incubated with NF-Dox (2.5% of P6 peptide) at 50 µM for 72 h. Data were analyzed by using a curve fitting program, GraphPad Prism 8.0, and are expressed as mean values ± SEM (n = 24) of four separate experiments.
Cellular Uptake Kinetics and Endocytosis Inhibition of Dox, NF-Dox and P1+ P2 +P3 + Dox by Fluorescent Microscopy
For cellular uptake kinetics experiments, MDA-MB-231 cells were seeded in 96-multiwell culture plates at a density of 104 cells/well. After 24 h of growth, MDA-MB-231 cells were treated or not for 1 h at 37 °C with Dox (7.5 µM), P1+ P2 +P3 + Dox (50 µM, i.e., 7.5 µM of Dox), and NF-Dox (at different percentages of P6 peptide: 1%, 2.5%, and 5%) (50 µM, i.e., 7.5 µM of Dox). After incubation, the culture medium was removed, the cells were washed twice with PBS and fixed for ten minutes with 4% paraformaldehyde (PFA, ice-cold). The cells were then washed with PBS and stained with DAPI. Moreover, Dox, NF-Dox (2.5% of P6 peptide), and P1+ P2 +P3 + Dox cellular uptake was evaluated in HaCaT cells under the same experimental conditions described above. In order to analyze the inhibition of endocytic pathways, we have used two different methods: i.e. sodium azide incubation and 4 °C blocking. In particular, 40 µM sodium azide was added to the cell culture medium for 30 min, followed by further 30 min of incubation with Dox at 7.5 µM, and NF-Dox (2.5% of P6 peptide), and P1+ P2 +P3 + Dox at 50 µM (i.e., 7.5 µM of Dox). Moreover, low temperature experiments were carried out by incubating MDA-MB-231 cells with Dox at 7.5 µM, NF-Dox (2.5% of P6 peptide) and P1+ P2 +P3 + Dox at 50 µM (i.e., 7.5 µM of Dox) at 4°C for 30 minutes. At the end of the treatment, the samples were observed using a fluorescence microscope (Leica Microsystems GmbH, Wetzlar, Germany) to visualize DAPI (Ex/Em=345/661 nm) as a nuclear stain, Dox (RFP, Ex/Em=395/475 nm), and NFs conjugated with Fam (GFP, Ex= 490/525 nm). The ImageJ software was used to evaluate intracellular uptake. Data were reported as the percentage of intracellular fluorescence intensity of treated cells normalized to the intracellular fluorescence intensity of untreated cells.
Dox Intracellular Localization by Confocal Microscope
To study the nuclear localization of free or conjugated Dox, sterile coverslips were placed in 12 multiwell culture plates, and MDA-MB-231 cells were seeded at a density of 5×10⁴ cells/well. After 24 h of growth, cells were treated or not for further 1 h at 37 °C with Dox (7.5 µM) and NF-Dox (2.5% of P6 peptide) (50 µM, i.e., 7.5 µM of Dox). After treatment, the cells were first washed with PBS (twice), and then fixed for 10 min with 4% paraformaldehyde (PFA, ice-cold). Coverslips from each well were mounted onto a glass microslide using DAPI/Moviol Pro Long Diamond Antifade Mountant. DAPI (Invitrogen/Thermo Fisher Scientific, Waltham, MA, USA) was used as nuclear stain. The samples were analyzed using a confocal microscope (Zeiss LSM 900 Airyscan 2) at a 63× objective (oil immersion objective lens) to visualize DAPI (Ex/Em=345/661 nm) as a nuclear stain, Dox (Ex/Em=395/475 nm), and NFs conjugated with Fam (Ex=490/525 nm). All confocal images were analyzed using the ImageJ software.
Statistical Data Analysis
All data were presented as mean values ± SEM. Statistical analysis was performed using one-way or two-way ANOVA followed by Dunnett’s or Bonferroni’s for multiple comparisons. GraphPad Prism 8.0 software was used for analysis. Differences between means were considered statistically significant when p ≤ 0.05 was achieved.
Characterization with AFM and SEM
Atomic Force Microscopy A XE-100 AFM (Park Systems), equipped with a liquid probe for AFM imaging in a liquid environment and an open liquid vessel, was used to image and measure the height of the control (untreated MDA-MB-231 cells), cells treated with only NF, and cells treated with NFs with Dox. Surface imaging was performed in a deionized water environment in non-contact mode using 125 μm long silicon/aluminum-coated cantilevers (PPP-NCHR 10M; Park Systems; tip radius less than 10nm) with a resonance frequency of 200–400 kHz in air and a nominal force constant of 42 N/m. The scan frequency was typically 0.5 Â Hz per line, and the images were 2048×2048 pixel. When necessary, the AFM images were flattened to remove the background slope and the contrast and brightness were adjusted. The 3D reconstruction yielded the highest measurements.
Scanning Electron Microscopy
SEM images were obtained at 10 kV accelerating voltage and 7.5µm wide aperture by a field-emission scanning electron microscope (Carl Zeiss NTS GmbH 1500 Raith FESEM). An InLens detector was used to acquire the images.
Sample Preparation for SEM and AFM
For SEM and AFM analyses, MDA-MB-231 cells were seeded at a density of 2×10⁵ cells/well on sterile coverslips placed in six multiwell culture plates. After 24 h of growth, cells were treated or not for further 1 h at 37 °C with NF without Dox (50 µM), NF-Dox (2.5% of P6 peptide) (50 µM, ie, 7.5 µM of Dox). After incubation, the culture medium was removed, and the cells were fixed for 10 min with 4% paraformaldehyde (PFA, ice-cold), washed twice with PBS, and finally samples were analyzed by AFM imaging and measurements. Samples for SEM imaging were coated with a 10 nm thin film of gold by sputtering using a CCU-010 coater (Safematic GmbH).
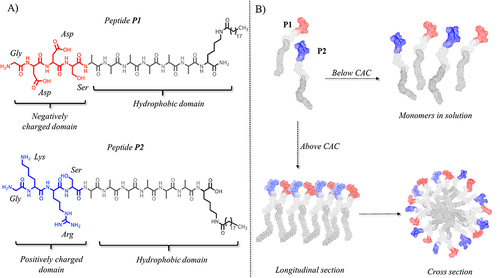
Figure 1 (A) reports the peptide sequence of structural peptides P1 and P2. (B) reports the hypothetical assembly of the two structural peptides in aqueous solution below and above their critical aggregation concentration (CAC). Molecular models were obtained by CYANA structure calculation algorithm that uses torsion angle molecular dynamics for the efficient computation of three-dimensional structures.
Results
Design and Synthesis of EGFR Targeting Self-Assembled Peptide-Based Nanofibers
Our recent studies on self-assembled peptide fibers, which have significantly improved membrane activity and enhanced capacity to deliver cargo across membranes compared to their monomers, served as the basis for this work.Citation46,Citation60 In particular, in our recent work, we designed proof-of-concept amphiphilic peptides (PAs) for nanofiber construction aimed at drug delivery in TNBC therapy. Nanofibers (NFs) are composed of two structural self-assembling PAs, P1 and P2, with a hydrophilic domain covalently linked to a hydrophobic domain (). In our design, we carefully determined the length and features of P1 and P2 to optimize the properties of the formed NFs.
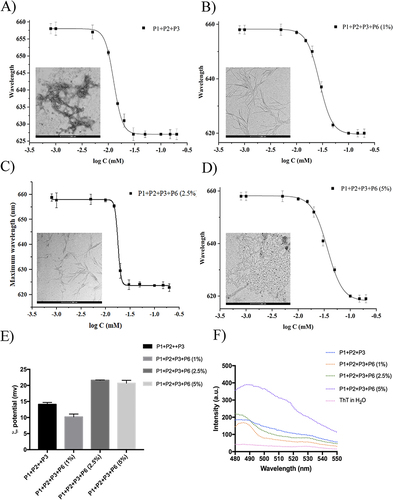
Figure 2 (A–D) report the CAC of nanofibers P1+P2+P3 (50:45:5) and P1+P2+P3+P6 with different percentages (1, 2.5, and 5%) of P6. CAC values were obtained plotting each maximum emission fluorescence corresponding to the wavelength (y) as a function of the peptide concentration using the sigmoidal Boltzmann equation. (E and F) report the nanofiber preparation monitored with ThT assay and the zeta potential measured for each nanofiber preparation, respectively.
Specifically, the hydrophobic domain is composed of an alkyl chain of 19 carbon atoms (C19) attached to the ε-amino group of a C-terminal lysine and a hydrophobic hexa-alanine sequence that was previously shown to be the optimal sequence length for NF formation.Citation46,Citation60 The hydrophilic domain carries negatively (Asp in P1) and positively (Lys and Arg in P2) charged residues, which establish intermolecular hydrogen bonds and electrostatic interactions provided by the oppositely charged side chains. When peptides P1 and P2 were mixed in solution below their critical aggregation concentration (CAC), the formation of NFs was not favored, and the peptides were present as monomers (). In contrast, when peptides co-assemble above their critical aggregation concentration (CAC) in solution, the hydrophobic and hydrophilic domains favor NF formation. The hydrophobic domain constitutes the NF core (), whereas the hydrophilic domain stabilizes the formation of NFs and improves their solubility. In addition, in our design, the surface of the NF was decorated with different moieties, each having a key role in the development of targeted NFs for Dox delivery into TNBC cells. To this end, the N-terminus of the structural peptide P2 was covalently linked to the moieties, and three different peptides, P3, P5, and P6, which all included the same hydrophobic domain [Ala6–Lys(C19)] and positively charged domain as P2 (see ), were designed.
Table 2 Representation of Sequences of PAs Designed to Decorate the Surface of TNBC-Targeted Nanofibers
These peptides have different biological functions. P3 carries the cell-penetrating peptide (CPP) gH625 (HGLASTLTRWAHYNALIRAF), which enhances nanoplatform uptake into cells.Citation41,Citation61 Our preliminary studies on NF internalization in TNBC cells (MDA-MB-231 cell line), proved how the peptide P3 at low concentrations promoted the crossing of NFs through the cell membrane by enhancing Dox delivery into nuclear regions.Citation44 The peptide P5 carries Dox to achieve an on-demand release through proteolytic cleavage by MMP-9, which is overexpressed in different molecular breast cancer subtypes, especially in TNBC.Citation62 MMP-9 can cleave both the extracellular domain of some proteins and intracellular substrates,Citation43 and its overexpression is correlated with the onset of metastasis and the aggressiveness of TNBC. In our design, Dox is linked to the peptide sequence “PLGSYL” that is selectively recognized and cleaved by MMP-9; in particular, the motif Leu-Gly is highly sensitive to the action of MMP-9. This approach was preliminary tested by incubating nanofibers decorated with Dox with the activated enzyme MMP-9 and a Dox release of ~85% was observed after 90 min by UV–Visible spectroscopy.Citation46 The peptide P6 carries the amino acid sequence “YHWYGYTPENVI” (namely peptide P22) targeting the epidermal growth factor receptor (EGFR) receptor, which is overexpressed in TNBC cells.Citation42 The peptide P22 binds to the EGFR protein and has a high uptake by TNBC cells, demonstrating its effectiveness in the functionalization of nanoplatforms for targeted drug delivery in cancer therapy. Regarding the synthesis, all PAs were synthesized via ultrasound-assisted solid-phase peptide synthesis and obtained with good yields. The residue Fmoc-Lys(Mtt)-OH was chosen as the first amino acid and for conjugation of the lipid tail C19 at the C-terminus. The Mtt group can be orthogonally removed without affecting the other protecting groups. In fact, after peptide assembly on the resin, the Mtt group was removed under mild acidic conditions, and the coupling of C19 was performed in the presence of coupling reagents and bases in NMP as a solvent. Dox was covalently coupled to the thiol group of cysteine located at the N-terminus of pure peptide P4 in solution to yield peptide P5. Finally, all PAs were cleaved from the resin, purified by HPLC, and characterized by electrospray mass spectrometry (ESI-MS, see Supplementary Materials).
Characterization of EGFR Targeting Nanofibers
The ratio between the PAs carrying surface moieties is key to the stability and morphology of NF. To this end, we prepared and characterized several nanofiber formulations. First, we calculated the ability of each peptide to co-assemble in an aqueous medium at concentrations ranging from 0.8 to 200 µM, using Nile Red (NR) as the fluorophore. Because of its poor solubility in water and large preference for partitioning in hydrophobic environments, NR is widely used to determine the formation of aggregates in aqueous media. When NR moves from water to aggregates, it produces a hyperhypsochromic effect, causing a blue shift and an increase in the fluorescence intensity. The critical aggregation concentration (CAC) was obtained by plotting the emission fluorescence maximum wavelength (y) as a function of peptide concentration (x) and fitting it using the sigmoidal Boltzmann equation. All PAs showed a good tendency to aggregate alone in an aqueous medium with CAC values of 20.1 ±1.0 μM for P1, 16.3±1.0 μM for P2, 37.3±1.0 μM for P3,Citation46 and 11.1±0.9 μM for P6. At this stage, we prepared several nanofiber formulations decorated with the delivery peptide (P3) and targeting peptide (P6) at different ratios. Nanofibers P1+P2+P3 (50:45:5, molar ratio) were obtained with a P3 percentage of 5% that was chosen based on our previous results obtained on the nanofiber uptake (CAC 12.8± 0.1).Citation46 To determine the lowest amount of P6 that was able to enable targeting and binding on EGFR protein, we prepared 3 different nanofiber formulations with 1, 2.5, and 5% of P6, respectively. Only once determining the best formulation of P1, P2, P3, and P6 through uptake studies using fluorescence microscopy, we added the last peptide, P5, carrying the drug; the selected percentage of P5 was 15%. All nanofiber formulations were characterized for their CAC (), zeta potential, and morphology (). The CAC values obtained clearly indicate a good tendency to self-assemble for each peptide combination, which agrees with our design. The combination of peptides P1, P2, and P3 with targeting peptide P6 at the two percentages of 1 and 2.5% led to the CAC values of 17.5 μM and 17.3 μM, while an increase in the P6 percentage to 5% led to the lower CAC value of 11.3 μM. Interestingly, the different percentage of P6 influences the morphology of the nanofibers, in particular, the amount of P6 impacts also on the length of the nanofibers as observed through Transmission Electron Microscopy (TEM).
Table 3 Formulations, Critical Aggregation Concentrations (CACs) and Nanofiber
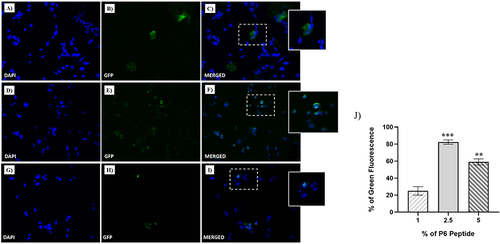
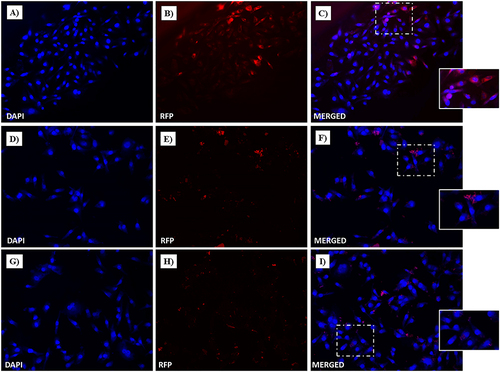
Figure 3 Fluorescent microphotographs showing the cellular uptake of the NFs into human TNBC cells. MDA-MB-231 cells were treated with NFs (1% of P6 peptide) (A–C), NF (2.5% of P6 peptide) (D–F) and NF (5% of P6 peptide) (G–I) at 50 µM for 1 h. Nuclei are shown in blue, stained with DAPI. The fluorescence (GFP) of NFs coupled with Fam is shown in green. Merged images derived from the overlapping of the two fluorescent emissions. The images shown are representative of three independent experiments. (J) Percentage of Green Fluorescence after the treatments in vitro. **p<0.01 vs 1% of P6 peptide treated cells; ***p<0.001 vs 1% of P6 peptide treated cells.
TEM analysis clearly showed that the length of the NFs decreased from 500 nm to 125 nm with an increasing percentage of P6, while their diameter was approximately 10 nm ( and Figure S5). In the absence of P6, the length was 150 nm; interestingly, the addition of a small amount of P6 (1% mol/mol) makes the fibers very long and thin. We hypothesized that the addition of a small percentage of P6 stabilizes the interactions of the peptide amphiphiles allowing the increase of their length; furthermore, we previously observed that the peptides gH625 tend to interact with each other through their helical structure rendering the fiber shorter, thus the presence of P6 helps in reducing these interactions and favors the increased length of the NFs.Citation46 On the contrary, an increase of the percentage (up to 5%) of the peptide P6 led to the formation of shorter and thicker nanofibers. Both conditions at 2.5 and 5% of P6 were reasonable for drug delivery applications according to the extravasation criteria. It has been reported that nanosystems need to have at least one dimension below the size of the fenestrations (200–800 nm) present in the vessel walls, which differ in dimension according to the tumor site and type.Citation63
In addition, NFs formation was monitored using a Thioflavin T (ThT) experiment (), where an increase in the percentage of P6 enhanced the ThT fluorescence intensity at approximately 480 nm, confirming peptide assembly and supporting nanofiber formation. ThT is primarily used to determine the formation of β-sheet amyloid fibril surfaces but is also widely exploited to analyze the formation of self-assembled nanostructures; in fact, as a result of the interaction within these structures, a rotation between the benzothiazole and the benzene rings is impeded, leading to fluorescence.Citation64 The spectra obtained are in line with the CAC calculations and the TEM analysis, with the 5% P6 corresponding to the most stable fibers. Moreover, the analysis of the zeta potential indicated that the surface of the NFs, defined by the presence of peptides P3 and P6, was positively charged. Regardless of the P6 percentage, we measured values of approximately +21 mV for nanofiber preparations at 1 and 2.5%. Instead, we observed a value of +1.7 mV for the 5% P6 preparation, which may explain the overcrowded TEM images. Clearly, data reported in (), indicate that the obtained NFs are well defined in dimensions and zeta potential and highly reproducible at the different percentages of P6, with 1 and 2.5% being the best conditions from a morphological point of view.
Cellular Uptake of EGFR Targeting Nanofibers
The cellular uptake of the three nanofiber formulations with different percentages of P6 was evaluated using fluorescence microscopy to determine the proper percentage of targeting peptide P6, which is responsible for binding to the EGFR protein. In , the cell nuclei are stained with DAPI (blue areas), whereas NFs are labelled with Fam (green areas); NFs containing different percentages of P6 (i.e., 1%, 2.5% and 5%) were taken up differently by MDA-MB-231 cells after 1 h of incubation. In particular, while very small amounts of NF decorated with 1% of P6 were detected in cells after 1 h of incubation (), NFs with 2.5% and 5% of P6 entered massively into cells, as highlighted by the widespread green fluorescence emission, localized both in the nucleus and cytoplasm. Clearly, the highest cellular uptake was observed for the 2.5% P6 formulation. This result was further confirmed by confocal microscopy performed on MDA-MB-231 cells after treatment with NF decorated with 2.5% of P6. As depicted in 1 h of treatment resulted in important cellular uptake of the nanofiber, which was clearly visible in both the cytosolic and perinuclear regions ( and ).
Figure 4 NF cellular uptake in MDA-MB-231 by confocal microscopy. TNBC cells were treated with NFs (2.5% of P6 peptide) at 50 µM for 1 h. Nuclei are shown in blue, stained with DAPI (A). NF is depicted in green (B). Merged images (C) derived from the overlapping of the two fluorescent emissions. Fluorescent microphotographs (63×oil immersion objective lens) are representative of three independent experiments.
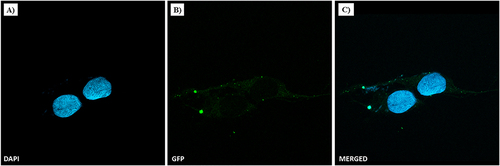
Figure 5 Cell survival index, evaluated by the MTT assay and monitoring of live/dead cell ratio for (A) HaCaT and (B) MDA-MB-231 cell lines treated for 48 and 72 h with the indicated concentration (the range 1→50 μM) of NF (at different percentage of P6 peptide: 1, 2.5 and 5%), P1+P2, P1+P2+P3, and P1+P2+P6 (at different percentage of P6 peptide: 1, 2.5 and 5%), as indicated in the legend. Data are expressed as percentage of untreated control cells and are reported as mean of four independent experiments ± SEM (n=24).
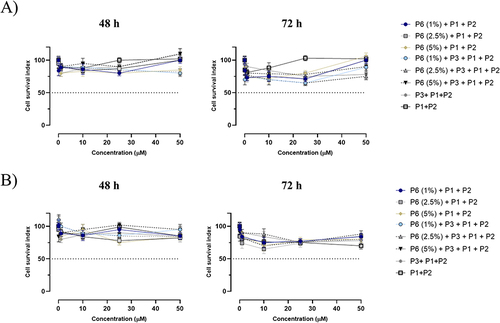
Next, we assessed the cellular responses to NFs application in both healthy cells (HaCaT and human keratinocytes) and the TNBC line MDA-MB-231 cells after 48 and 72 h of incubation by evaluating the cell survival index ( and ). For this experiment, we prepared NFs composed of i) P1+P2, ii) P1+P2+P3, iii) P1+P2+P3 with different percentages of P6 (1, 2.5 and 5%), iv) P1+P2 with different percentages of P6 (1, 2.5 and 5%). Overall, the concentration–effect curves reported in reveal that no nanoformulation significantly affected cell viability in either cell line, even at the highest tested concentration (50 µM), after a prolonged incubation time (72 h). The absence of detectable biological effects on cell survival as evidenced in clearly suggested that the platform is biocompatible with MDA-MB-231 and HaCaT cells, which is a key feature for the use of nanofibers as a drug delivery system without cytotoxicity.
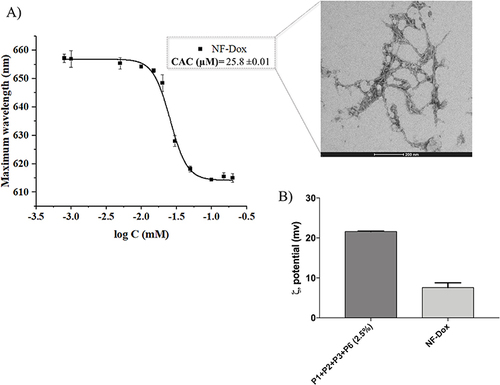
Figure 6 (A) reports the CAC and TEM image of nanofibers NF-Dox. (B) compares the zeta potential of nanofibers P1+P2+P3+P6 (2.5%) and NF-Dox.
By combining the biophysical outcomes and in vitro experiments performed on NFs with different percentages of P6, we deduced that the NFs P1+P2+P3+P6 containing the 2.5% of P6 had the best ability to pass cell membranes as well as the best morphology for applications and were therefore selected to be further used in the subsequent experiments.
Physical Properties of EGFR-Targeting Nanofibers with the Drug
The NF P1+P2+P3+P6 (50:42.5:5:2.5) was further decorated with Dox as the anticancer drug at the percentage of 15% (P5 peptide carrying both Dox and the MMP-9 labile sequence). The obtained nanofiber, P1+P2+P3+P5+P6 (NF-Dox), with a molar ratio of 50:27.5:5:15:2.5 was carefully characterized for its physicochemical properties (). As reported in , the presence of Dox on the nanofiber surface influences the aggregation of PAs because the calculated CAC value of 25.8 μM is increased compared to the CAC of nanofibers decorated only with P3 and P6 (17.3 μM). Interestingly, the addition of Dox also determined a significant reduction of the surface charge of nanofibers from +15.5 mV to +7.6 mV likely because of the steric bulk caused by the drug on the surface which shields the charges.
Figure 7 (A and B) report the CD spectrum of NF-Dox at the concentration of 100 µM and the stability of β-aggregates under the dilution effect, respectively.
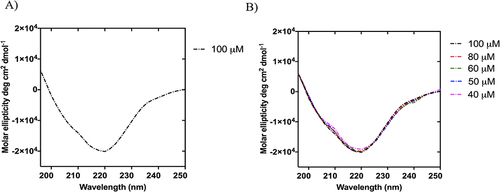
The secondary structures of the obtained NFs were probed by circular dichroism (CD) and Fourier-transform infrared (FTIR) spectroscopy. The CD spectra clearly indicated the formation of β-aggregates above the CAC value (), which were stable under dilution. In fact, the CD spectra recorded at concentrations of 100, 80, 60, 50, and 40 µM sufficiently overlapped and showed a negative band at ~220 nm, indicating preservation of the β-type conformation upon dilution ().
Figure 8 The spectral curve of the amide I band of NF-Dox (grey line) and its fitting curve (pink line) showing the 1700–1600 cm−1 spectral range (A). In (B), the table reports the multi-peak fitting results and their assignment for the secondary structure determination.
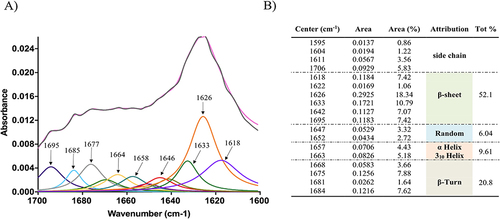
The formation of β-structures following nanofiber formation was further supported by FTIR experiments. In fact, the analysis of the spectrum between 1700 and 1600 cm−1 revealed the existence of secondary structures such as β-sheets and α-helices (). Indeed, the amide I band is particularly useful for the analysis of secondary structures and conformational changes owing to the high sensitivity of the C=O stretching frequency to small changes in the molecular geometry and hydrogen bonding patterning. Panel B of reports the results of the multipeak fit regression. The absorption spectrum of NF-Dox presents a large double peak in the range of 1600–1700 cm−1, with a relative maximum around 1625 cm−1, usually attributed to β-sheets, and around 1675 cm−1, usually attributed to β-turns. However, deconvolution with a multipeak model, in which each peak corresponds to a minimum of the second-order derivative, produces a quantitative analysis of the secondary structures. In particular, the analysis clearly shows that approximately 73% of the vibrational modes are typical of β-structures ().
Figure 9 Structural studies of NF-Dox under the effect of ionic strength (A), pH environments (B), and temperature effect (C).
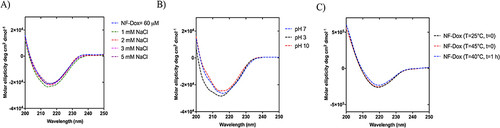
In addition, the structural stability of NF-Dox was analyzed using CD spectroscopy under different conditions to evaluate the effects of ionic strength, pH and temperature. NF-Dox was prepared at a concentration of 60 µM and hydrated in water after freeze-drying. As shown in , the stability of NF-Dox was preserved under the effect of ionic strength. The shape of the CD spectra did not change at different concentrations (1–5 mM) of the NaCl solution, indicating the stability of NF-Dox under these conditions. The structural stability was also investigated under different pH conditions. The CD spectra at pH 7 and 10 were superimposable, as highlighted in Panel B, whereas slight changes were observed at pH 3. We also analyzed the structural stability of NF-Dox under different temperature conditions, as often the temperature at the tumor site is higher than that of the surrounding normal tissues. For this aim, we obtained a melting CD graph from 25°C to 40°C and we detected no denaturation of our NFs (data not shown). Furthermore, we compared the spectra obtained at 25°C with those obtained at 40°C t=0 and 40°C t=1h. The 3 spectra are superimposable as shown in . Our data clearly demonstrate that the NFs are stable to the different environmental parameters analyzed.
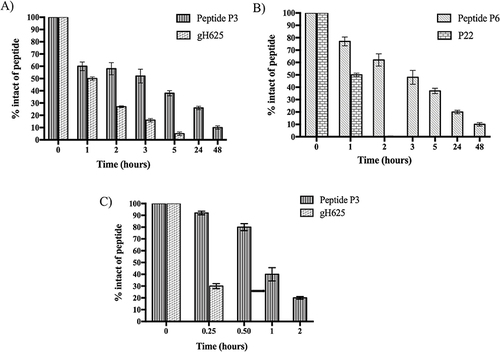
Figure 10 (A) reports the percentage of the intact peptide after the incubation with trypsin calculated by the integration of the HPLC peaks correlated to the peptide P3 and gH625. (B and C) report the percentage of the intact peptides P3, gH625, P6 and P22 after incubation with chymotrypsin.
NF-Dox Fibers Stability Toward Proteolytic Enzymes
The stability of the P3 and P6 peptides bound to the nanofiber surface was investigated in the presence of trypsin and chymotrypsin. The P1+P2+P3 and P1+P2+P3+P6 nanofibers were prepared in PBS 1X (pH 7.4) and TRIS-HCl 100 mM (pH 7.8) and incubated with trypsin and chymotrypsin, respectively, at different time points (1, 2, 3, 5, 24, and 48 h). As shown in , gH625 alone was rapidly degraded by trypsin, which preferentially cleaved the peptide bond of basic amino acid residues, such as Arg and Lys. In particular, we detected a percentage of ~27% and ~5% after 2 h and 5 h, respectively (). In contrast, the peptide gH625, covalently linked to the peptide P2 to provide P3, self-assembled and, although exposed on the nanofiber surface, was still present at ~40% after 5 h of incubation (). These positive results indicate that the self-assembling properties of P3 offer major resistance to proteolytic cleavage by proteases, such as trypsin.
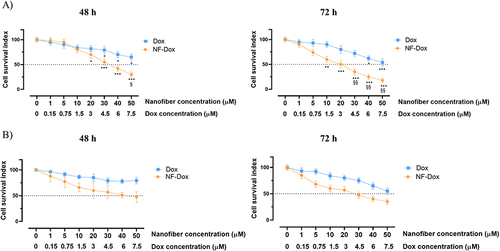
Figure 11 Cell survival index, evaluated by the MTT assay and monitoring of live/dead cell ratio for (A) MDA-MB-231, (B) HaCaT cell lines treated for 48 and 72 h with a range of concentration of free-Dox (Dox) from 1 to 7.5 μM) and NF-Dox (from 1 to 50 μM, ie from 1 to 7.5 μM of Dox), as indicated in the legend. Data are expressed as percentage of untreated control cells and are reported as mean of four independent experiments ± SEM (n=24). *p<0.05 vs control cells; **p<0.01 vs control cells; ***p<0.001 vs control cells; §p<0.05 vs Dox-treated cells; §§p<0.01 vs Dox-treated cells.
Interestingly, peptide P6 was not recognized by trypsin because it did not contain basic amino acids in its sequence. Indeed, as shown in Figure S6, both P22 and P6 were stable under the proteolytic cleavage of trypsin. In contrast, peptide P22, covalently linked to peptide P2 (peptide P6), is recognized by the enzyme chymotrypsin, which preferentially cleaves the peptide bonds of aromatic amino acid residues such as tyrosine, tryptophan, and phenylalanine. Specifically, after 3 h of incubation, we detected ~50% of intact peptide P6, while the peptide P22 alone was completely degraded after 1 h ). Regarding the peptide P3 bound on the nanofiber surface, it was highly sensitive to the proteolytic cleavage of chymotrypsin, in fact we detected ~80% of the intact after 30 min of incubation, and it was almost completely degraded after 2 h (). Although it is highly susceptible to the proteolytic activity of chymotrypsin, this result is consistent with its biological role because peptide P3 promoted the complete crossing of nanofibers inside TNBC cells within 1 h. Notably, peptide gH625 alone was completely degraded after 30 min of incubation (). The obtained results clearly support our design regarding the development of self-assembled peptide nanofibers characterized by an increase in stability to proteases and high biocompatibility, because the peptides P3 and P6 bound to the fiber are completely degraded after 48 h of incubation, which means that they perform their activity. These results support the use of self-assembled peptide-based nanoplatforms as biodegradable drug-delivery tools.
Cellular Biological Responses in vitro
Next, we explored the biological effects of the drug-loaded nanofiber (NF-Dox). The concentration–effect curves () show a significant reduction in MDA-MB-231 cell survival after 48 h of treatment with NF-Dox at 30 µM (i.e., 3 µM of Dox) (50% of cell death) and after 72 h of exposure at 20 µM (i.e., 1.5 µM of Dox) (50% of cell death). Under the same experimental conditions, the biological effects of NF-Dox evaluated in HaCaT keratinocytes, used as a control culture, were attenuated compared to those in cancer cells (). This is an interesting finding from the perspective of selectivity of action.
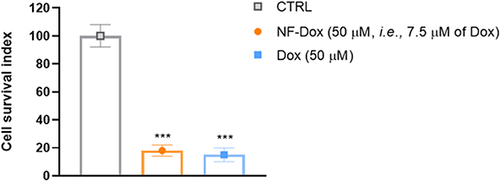
To deepen our understanding of the efficacy of Dox bound to NFs, we performed bio-screening by comparing the effects of free Dox and NF-Dox. As shown in , we observed a similar anti-proliferative trend in cancer cells treated with 50 µM free Dox and 50 µM NF-Dox (i.e., 7.5 µM Dox). These data suggest that the nanofibers produce the same in vitro effects at seven times lower concentration compared to the free drug, which represents a valuable result for reducing the dose of the drug to be administered.
Figure 12 Cell survival index for MDA-MB-231 cells following 72 h of incubation with NF-Dox and free-Dox, as indicated in the legend. Data are expressed as percentage of untreated control cells and are reported as mean of four independent experiments ± SEM (n=24). ***p<0.001 vs control cells.
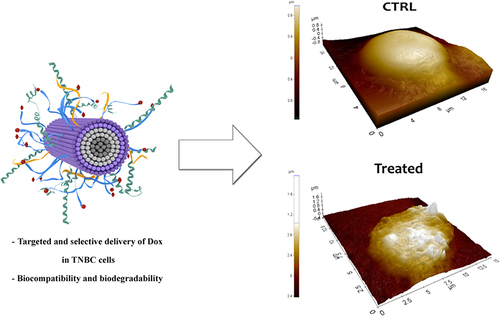
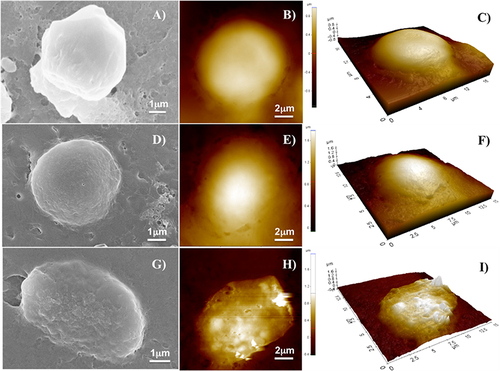
Furthermore, we analyzed by SEM and AFM imaging the different morphologies of the cells when treated with the NF with and without Dox. shows the SEM images (on the left), AFM images (on the center), and 3D reconstruction by AFM (on the right) of a representative MDA-MB-231 cell as a control sample (), a representative cell treated with P1+P2+P3+P6 (), and a representative cell treated with NF-Dox (). The morphology of cells treated with NF-Dox appeared very different from that of control cells, as well as from the morphology of cells treated with NF without Dox. In particular, the cells treated with NF-Dox () appeared elongated, wrinkled, and squashed, which is the typical appearance of cells undergoing apoptosis. Moreover, the analysis of cells in AFM images showed several holes on the surface, suggesting a sort of interaction with bump formation. This type of hole was not observed in the SEM images, probably because of the gold coating. Furthermore, cells treated with P1+P2+P3+P6 () seemed to preserve the rounded shape and the general aspect shown by untreated cells (), the surface roughness increased, and some small holes appeared on the surface of the cells. The features of the cell suggest a surface interaction with the formation of protrusions/inclusions, but the interaction does not lead to a dramatic change in shape, suggesting apoptosis of the cell in the case of NF-Dox treatment. These data further support the role of the nanovector represented by NF and the toxicity of Dox in cancer cells.
Figure 13 SEM images, AFM images and 3D reconstruction of a representative untreated MDA-MB-231 cell used as control sample (A–C); a representative cell treated with the NF platform without Dox (D–F); and a representative cell treated with the NF platform with Dox (G-I).
Intracellular Release of Dox by MMP-9 in vitro
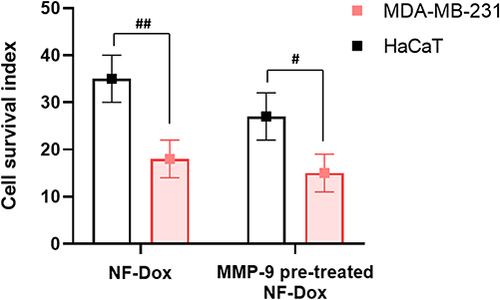
Next, we sought to evaluate whether Dox could be released intracellularly by performing experiments in which the fibers were pre-treated with the MMP-9 activated enzyme. Both MDA-MB-231 and HaCaT cells express MMP-9 and the levels of this enzyme are higher in TNBC cells.Citation43 Matrix metalloproteinases (MMPs) are generally considered degraders of the extracellular matrix (ECM) and are responsible for a range of extracellular processes. More recently, growing evidence has revealed novel intracellular functions of selected MMPs, including MMP-9.Citation65 In line with in vitro experiments without pretreatment with activated MMP-9, we detected cytotoxicity in both cell types (). As expected, the cytotoxic response was more evident in MDA-MB-231 cells. Accordingly, when the fibers were pre-treated with MMP-9 before incubation, the toxicity to MDA-MB-231 cells increased slightly, while the toxicity against HaCaT cells increased significantly. Overall, these results support the evidence of intracellularly active MMP-9 and clearly reveal that this strategy for on-demand drug release is highly efficient in TNBC cells.
Figure 14 Cell survival index for MDA-MB-231 and HaCaT cell lines pre-treated or not with 40 nM of MMP-9 activated enzyme for 24 h and then incubated with NF-Dox (50 µM) for 72 h. #p<0.05; ##p<0.01.
Free and Conjugated-Dox Intracellular Uptake in MDA-MB-231 and HaCaT Cells
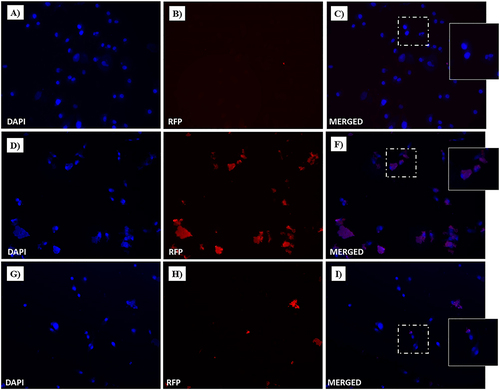
Cellular uptake studies were performed to evaluate Dox intake and release from the drug-loaded NF-Dox nanofiber. As shown in , widespread cytoplasmic fluorescence was observed in MDA-MB-231 cells after incubation with NF-Dox, further supporting the release of the cytotoxic Dox. Moreover, under the same conditions, a significant nuclear red fluorescent signal was observed after in vitro treatment with NF-Dox. Dox intracellular uptake was more evident after NF-Dox incubation () than after free Dox incubation (). Conversely, the intracellular fluorescence signal from HaCaT cells treated with NF-Dox was not significant (), indicating that uptake in cells not overexpressing MMP-9 was less evident. Similar experiments were performed using P1, P2, P3, and Dox. As expected, no significant red fluorescence was detected in the intracellular compartment (both in MDA-MB-231 and HaCaT cells), providing evidence for the role of P6 in facilitating effective targeted drug delivery.
Figure 15 Fluorescent microphotographs showing the cellular location of doxorubicin (Dox) into human MDA-MB-231 cells following to free-Dox (A–C), NF-Dox (D–F) and P1+P2+P3+Dox (G–I) application. MDA-MB-231 were incubated with free- Dox (7.5 μM), NF-Dox and P1+P2+P3+Dox (50 µM, ie, 7.5 µM of Dox) for 1 h. Nuclei are shown in blue, stained with DAPI. The intrinsically fluorescence (RFP) of Dox is shown in red. Merged images derived from the overlapping of the two fluorescent emissions are. The images shown are representative of 3 independent experiments.
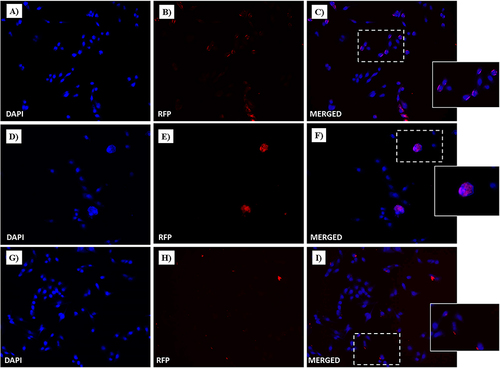
Figure 16 Fluorescent microphotographs showing the cellular location of Dox into human HaCaT cells following to free-Dox (A–C), NF-Dox (D–F) and P1+P2+P3+Dox (G–I) application. HaCaT were incubated with free- Dox (7.5 μM), NF-Dox and P1+P2+P3+Dox (50 µM, i.e., 7.5 µM of Dox) for 1 h. DAPI is used as a nuclear stain (shown in blue). The intrinsically fluorescence of Dox (RFP channel) is shown in red. Merged images derived from the overlapping of the two fluorescent emissions. The images shown are representative of 3 independent experiments.
Study of Mechanism of Nanofibers Internalization
To gain further insight into the uptake process, we performed experiments to understand the role of gH625 in membrane crossing. In particular, gH625 was previously shown to enter through translocation across membranes involving only partial endocytosis; furthermore, it was able to favor endosomal release. To this end, we performed endocytosis inhibition experiments using two different protocols, as described in the Experimental section. In particular, the influence of temperature and metabolic inhibitors on the intracellular penetration of NF-Dox was studied to determine whether the uptake depended on the translocation mechanism or cellular processes. We compared the images obtained at 4°C to determine the degree of endocytosis in the cellular uptake of NF-Dox and free-Dox, and the results clearly indicated that the endocytosis was more significant for free-Dox than for the nanofibers. Sodium azide is an oxidative phosphorylation inhibitor commonly used to abolish ATP production within the cell membrane.Citation66 As shown in and , free Dox internalization was significantly decreased; thus, endocytosis appears to be the primary mechanism underlying its penetration. In contrast, treatment with sodium azide had little to no effect on NF-Dox penetration, indicating that endocytosis had no impact on gH625 transduction. In conclusion, when cellular endocytosis was inhibited, free Dox uptake was significantly reduced, whereas NF-Dox uptake was unaffected ( and ). Overall, these results suggest the possibility of several pathways underlying NFs cellular uptake via routes other than the endocytic pathways (ie translocation, membrane fusion processes, and/or nonspecific patterns likely involving multiple molecular mechanisms).
Figure 17 Fluorescent microphotographs showing the cellular location of Dox into human MDA-MB-231 TNBC cells after cellular up-take inhibition low temperature (4 °C) and then to free-Dox (A–C), NF-Dox (D–F) and P1+P2+P3+Dox (G–I) application. MDA-MB-231 were incubated with free-Dox (7.5 μM), NF-Dox and P1+P2+P3+Dox (50 µM, ie, 7.5 µM of Dox) for 1 h. Nuclei are shown in blue, stained with DAPI. The intrinsically fluorescence of Dox (RFP channel) is shown in red. Merged images derived from the overlapping of the two fluorescent emissions. The images shown are representative of 3 independent experiments.
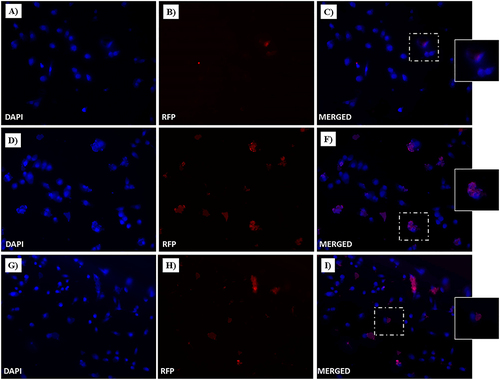
Figure 18 Fluorescent microphotographs of monolayers showing the cellular location of doxorubicin (Dox) into human MDA-MB-231 TNBC cells after cellular up-take inhibition sodium azide and then to free-Dox (A–C), NF-Dox (D–F) and P1+P2+P3+Dox (G–I) application. MDA-MB-231 were incubated with free-Dox (7.5 μM), NF-Dox and P1+P2+P3+Dox (50 µM, ie, 7.5 µM of Dox) for 1 h. Nuclei are shown in blue, stained with DAPI. The intrinsically fluorescence of Dox (RFP channel) is shown in red. Merged images derived from the overlapping of the two fluorescent emissions. The images shown are representative of 3 independent experiments.
Dox Nuclear Localization
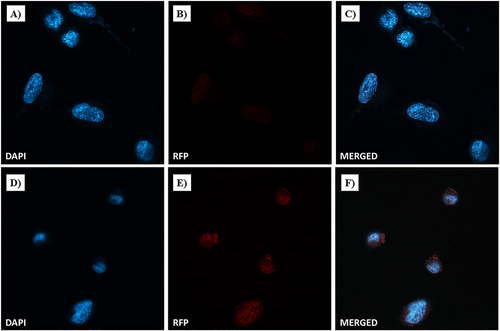
Confocal microscopy was performed to explore the nuclear localization and accumulation of Dox. In particular, MDA-MB-231 cells were incubated with free-Dox (at 7.5 µM) or NF-Dox (at 50 µM, i.e., 7.5 µM of Dox) for 1 h. In , bright red dots within the cells represent doxorubicin fluorescent emission (RFP) produced by incubation with free Dox or NF-Dox. Blue fluorescence was due to DAPI, which is a nuclear fluorescent stain. Merged confocal images were obtained by overlapping the two fluorescent emissions. In line with our previous data obtained by fluorescence microscopy, Dox released from our drug-loaded nanofiber (NF-Dox) massively entered MDA-MB-231 cells. Confocal microscopic photographs ( and ) clearly show perinuclear accumulation of cytotoxic Dox. Moderate fluorescence spots were also visible at the nuclear level (). In contrast, the red fluorescent signal after free Dox incubation was not significant under the same experimental conditions (see and ), indicating poor cellular uptake of Dox after 1h of treatment. Therefore, the extensive and widespread Dox-associated red fluorescent spots following the cellular uptake is consistent with effective nanofiber internalization.
Figure 19 Dox nuclear localization in MDA-MB-231 cells by confocal microscopy. Cells were incubated with free-Dox (at 7.5 μM) (A–C) and NF-Dox (at 50 µM, ie, 7.5 µM of Dox) (D–F) for 1 h. Nuclei are stained in blue with DAPI. The intrinsically fluorescence of Dox is shown in red (RFP channel). Merged images derived from the overlapping of the two fluorescent emissions. Fluorescent microphotographs (63× oil immersion objective lens) are representative of three separate experiments.
Discussion
Herein, we discuss the development of a novel class of tunable supramolecular peptide nanofibers that can be used in the biomedical field to combat TNBC. In particular, our research further supports the idea that self-assembly, governed by multiple non-covalent interactions, leads to the formation of versatile morphologies that are adaptable to incorporate multiple bioactive motifs by chemical conjugation and/or physical encapsulation. With the aid of amphiphilic peptides, ordered nanostructures can be created by combining a number of noncovalent interactions that work synergistically. Limited research has been conducted on finite anisotropic nanomaterials based on rationally designed and engineered self-assembling peptides. The challenge of creating peptide nanofibers with precisely controlled morphologies has contributed to the lack of research. Compared with other supramolecular nanomaterials, our designed nanofibers present several advantages, such as i) the well-established solid-phase synthetic strategy; ii) the possibility to tune the desired morphology; iii) high biodegradability, with nontoxic amino acids as degradation products; iv) the simple covalent conjugation of the peptides making up the fiber with other bioactive motifs, which enables modular design strategies to create responsive and multifunctional nanosystems.
Our PAs comprise three domains that are key to the formation of the nanofiber structure: the hydrophobic tail, apolar alanine sequence, and hydrophilic domain of the charged amino acids. The fiber surface was decorated with CPP gH625 and targeting peptide P22, and their contemporary presence influenced the length and secondary structure of the nanofibers, as demonstrated through complete biophysical characterization. Interestingly, keeping the amount of gH625 fixed (5%), the different percentages of P22 bound covalently to P2 (peptide P6) influenced the morphology of the nanofibers, impacting their length, as observed by TEM. While a small amount of P6 produced very long and thin fibers, both conditions at 2.5 and 5% P6 had a morphology compatible with drug delivery applications according to the extravasation criteria. Analysis of cellular uptake by fluorescence microscopy prompted us to select the 2.5% P6 formulation for further studies.
The first issue when designing a drug delivery platform is the absence of toxicity of the carrier on both healthy cells, such as HaCaT, and the TNBC cancer line MDA-MB-231, which was demonstrated by the evaluation of the cell survival index. We then developed and characterized the structural stability and morphology of the NF carrying Dox. For NF-Dox, nanofibers of 250 nm were suitable for application and were stable under the effects of dilution, ionic strength, and pH.
Notably, self-assembled peptide materials may also overcome some of the intrinsic limitations associated with single-chain peptides, ie stability, which helps to expand their biomedical utility. In particular, a key issue to probe is the biodegradability of the nanosystem after the biological effect (ie the release of the drug at the target site). Internalization of NF-Dox was evident after 1 h, and cell experiments showed that biological activity was produced at 48 and 72 h. Thus, we probed protease stability up to 72 h and found that compared to the monomers, the NFs were much more stable; in particular, we observed greater stability at 1 h, which is the time needed for internalization. Nonetheless, after 48 h, they were completely degraded, which is a valuable advantage of this platform.
A well-designed nanoplatform is expected to significantly reduce the dose of the drug which clearly has an impact on systemic toxicity; our in vitro experiments showed that a similar antiproliferative effect could be achieved in cancer cells treated with the free-Dox at 50 µM and NF-Dox carrying 7.5 µM of Dox. Interestingly, analysis of the surface morphologies of cells treated with NF with and without Dox showed that cells treated with NF alone were essentially unaltered, whereas cells treated with NF-Dox appeared elongated, wrinkled, and squashed, which is the typical appearance of a cell undergoing apoptosis. These experiments provided proof of feasibility through a rational design approach for the on-demand release of Dox. In fact, our on-demand release relied on MMP-9 cleavage, owing to the presence of overexpressed enzymes in TNBC cancer cells. Unraveling the uptake mechanism of NF-Dox is key in the design of a vector, where endocytic entrapment represents a huge obstacle for the effective release of the drug. The presence of gH625 is key to enabling a translocation mechanism that involves local and temporary deformation of the membrane, favoring the direct release of NF-Dox into the cytoplasm and ready to perform its biological activity (). Increased membrane activity due to gH625 leads to improved cellular uptake of membrane-impermeable drugs, which is key for many pathologies. The inhibition of endocytic pathways using both low temperature and metabolic inhibitors supported our hypothesis, showing that although we obtained a marked decrease in free Dox internalization, NF-Dox penetration was not significantly influenced, indicating that endocytosis was not the main process involved in its penetration. Furthermore, when NF is decorated with the targeting peptide P22, NF-Dox may enter through an endocytic pathway; however, gH625 mediates its release from the endosomes. This outcome can also have critical implications in overcoming chemoresistance issues.
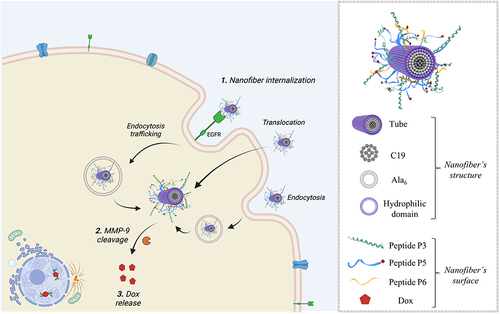
Figure 20 Representation of the hypothesized mechanism of the NF-Dox internalization and activity against TNBC (on the left), showing the different pathways which lead to the intracellular release of NF-Dox. On the right, the structure of the nanofiber with indicated all the moieties on the surface. The figure was created with Biorender.com (License: Academic Individual Plan x 3yrs (Feb 27, 2023 – Feb 27, 2026).
Conclusion
In this study, we developed and characterized self-assembled peptide-based nanofibers with surfaces decorated with different moieties, achieving targeted and selective release of Dox in TNBC cells through an on-demand strategy. In conclusion, our nanoplatform is extremely versatile and can be modulated by changing the moieties on its surface to address a wide range of pathologies, from cancer to pathologies of the central nervous system to infectious diseases.
Disclosure
The authors report no conflicts of interest in this work.
Acknowledgments
S.G. and R.B. acknowledge the grant CN00000041 “National Center for Gene Therapy and Drugs based on RNA Technology” (concession number 1035 of 17 June 2022-PNRR MUR - M4C2 - Investment 1.4 Call ”National Centers”, financed by the EU – NextGenerationEU), and code project MUR:CN00000041–CUP UNINA: E63C22000940007. Dr Rosa Bellavita was partially supported by Fondazione Umberto Veronesi. We gratefully thank Prof. Lucia Falcigno and Prof. Gabriella D’Auria for their support in the realization of , and Prof. Carla Langella and Ph.D. Giovanna Nichilò for the support in the design and science visualization of .
We gratefully thank Dr. Valeria Cicatiello of the “Italian National Research Council” (CNR), Institute of Genetics and Biophysics, Naples (Italy), for providing us the HaCat cells.
Additional information
Funding
References
- Upadhyay K, Tamrakar RK, Thomas S, et al. Surface functionalized nanoparticles: a boon to biomedical science. Chem Biol Interact. 2023;380:110537. doi:10.1016/j.cbi.2023.110537
- Khan MI, Hossain MI, Hossain MK, et al. Recent progress in nanostructured smart drug delivery systems for cancer therapy: a review. ACS Appl Bio Mater. 2022;5:971–1012. doi:10.1021/acsabm.2c00002
- Wang X, Li C, Wang Y, et al. Smart drug delivery systems for precise cancer therapy. Acta Pharm Sin B. 2022;12:4098–4121. doi:10.1016/j.apsb.2022.08.013
- Li C, Wang M, Li PF, et al. Construction of smart DNA-based drug delivery systems for cancer therapy. Small;2024. e2306257. doi:10.1002/smll.202306257
- Zhou Y, Li Q, Wu Y, et al. Molecularly stimuli-responsive self-assembled peptide nanoparticles for targeted imaging and therapy. ACS Nano. 2023;17:8004–8025. doi:10.1021/acsnano.3c01452
- Li T, Lu XM, Zhang MR, et al. Peptide-based nanomaterials: self-assembly, properties and applications. Bioact Mater. 2022;11:268–282. doi:10.1016/j.bioactmat.2021.09.029
- Kianfar E. Protein nanoparticles in drug delivery: animal protein, plant proteins and protein cages, albumin nanoparticles. J Nanobiotechnology. 2021;19:159. doi:10.1186/s12951-021-00896-3
- Sangji MH, Sai H, Chin SM, et al. Supramolecular interactions and morphology of self-assembling peptide amphiphile nanostructures. Nano Lett. 2021;21:6146–6155. doi:10.1021/acs.nanolett.1c01737
- Lombardi L, Falanga A, Del Genio V, et al. A new hope: self-assembling peptides with antimicrobial activity. Pharmaceutics. 2019;11:166. doi:10.3390/pharmaceutics11040166
- Du Z, Fan B, Dai Q. Supramolecular peptide nanostructures: self-assembly and biomedical applications. Giant. 2022;9:100082. doi:10.1016/j.giant.2021.100082
- Ghosh G, Barman R, Mukherjee A, et al. Control over multiple nano- and secondary structures in peptide self-assembly. Angew Chem Int Ed Engl. 2022;61:e202113403.
- Ghosh G, Kartha KK, Fernández G. Tuning the mechanistic pathways of peptide self-assembly by aromatic interactions. Chem Comm. 2021;57:1603–1606. doi:10.1039/D0CC07199D
- Hu X, Liao M, Gong H, et al. Recent advances in short peptide self-assembly: from rational design to novel applications. Curr Opin Coll Interface Sci. 2020;45:1–13.
- Lee S, Trinh THT, Yoo M. Self-assembling peptides and their application in the treatment of diseases. Int J Mol Sci. 2019;20:5850. doi:10.3390/ijms20235850
- Moyer TJ, Kassam HA, Bahnson ES. Shape-dependent targeting of injured blood vessels by peptide amphiphile supramolecular nanostructures. Small. 2015;11:2750–2755. doi:10.1002/smll.201403429
- Lee KL, Shukla S, Wu M, et al. Stealth filaments: polymer chain length and conformation affect the in vivo fate of PEGylated potato virus X. Acta Biomater. 2015;19:166–179. doi:10.1016/j.actbio.2015.03.001
- Dasgupta A, Das D. Designer peptide amphiphiles: self-assembly to applications. Langmuir. 2019;35:10704–10724. doi:10.1021/acs.langmuir.9b01837
- Mitchell MJ, Billingsley MM, Haley RM, et al. Engineering precision nanoparticles for drug delivery. Nat Rev Drug Discov. 2021;20:101–124. doi:10.1038/s41573-020-0090-8
- Kang EB, Lee JE, Mazrad ZAI, et al. pH-Responsible fluorescent carbon nanoparticles for tumor selective theranostics via pH-turn on/off fluorescence and photothermal effect in vivo and in vitro. Nanoscale. 2018;10:2512–2523. doi:10.1039/C7NR07900A
- Fu Q, Wang J, Liu H. Chemo-immune synergetic therapy of esophageal carcinoma: trastuzumab modified, cisplatin and fluorouracil co-delivered lipid-polymer hybrid nanoparticles. Drug Deliv. 2020;27:1535–1543. doi:10.1080/10717544.2020.1837294
- Awad K, Dalby M, Cree I, et al. The precision medicine approach to cancer therapy: part 1 — solid tumours. Pharm J. 2019;2019:1.
- DeSantis C, Ma J, Bryan L, et al. Breast cancer statistics, 2013. CA Cancer J Clin. 2014;64:52–62. doi:10.3322/caac.21203
- Zheng Y, Li M, Weng B, et al. Exosome-based delivery nanoplatforms: next-generation theranostic platforms for breast cancer. Biomater Sci. 2022;10:1607–1625. doi:10.1039/D2BM00062H
- Perou CM, Sørlie T, Eisen MB, et al. Molecular portraits of human breast tumours. Nature. 2000;406:747–752. doi:10.1038/35021093
- Nguyen HM, Paulishak W, Oladejo M, et al. Dynamic tumor microenvironment, molecular heterogeneity, and distinct immunologic portrait of triple-negative breast cancer: an impact on classification and treatment approaches. Breast Cancer. 2023;30:167–186. doi:10.1007/s12282-022-01415-4
- Hashmi AA, Naz S, Hashmi SK. Epidermal growth factor receptor (EGFR) overexpression in triple-negative breast cancer: association with clinicopathologic features and prognostic parameters. Surg Exp Pathol. 2019;2:6. doi:10.1186/s42047-018-0029-0
- Ali R, Wendt MK. The paradoxical functions of EGFR during breast cancer progression. Signal Transduct Target Ther. 2017;2:16042. doi:10.1038/sigtrans.2016.42
- Lehmann BD, Jovanović B, Chen X, et al. Refinement of triple-negative breast cancer molecular subtypes: implications for neoadjuvant chemotherapy selection. PLoS One. 2016;11:e0157368.
- Hwang SY, Park S, Kwon Y. Recent therapeutic trends and promising targets in triple negative breast cancer. Pharmacol Ther. 2019;199:30–57. doi:10.1016/j.pharmthera.2019.02.006
- Rej RK, Roy J, Allu SR. Therapies for the treatment of advanced/metastatic estrogen receptor-positive breast cancer: current situation and future directions. Cancers (Basel). 2024;16:552. doi:10.3390/cancers16030552
- Hou K, Ning Z, Chen H, Wu Y. Nanomaterial technology and triple negative breast cancer. Front Oncol. 2021;11:828810. doi:10.3389/fonc.2021.828810
- Loap P, Loirat D, Berger F, et al. Concurrent olaparib and radiotherapy in patients with triple-negative breast cancer: the phase 1 olaparib and radiation therapy for triple-negative breast cancer trial. JAMA Oncol. 2022;8:1802–1808. doi:10.1001/jamaoncol.2022.5074
- Loap P, Loirat D, Berger F, et al. Combination of olaparib and radiation therapy for triple negative breast cancer: preliminary results of the RADIOPARP phase 1 trial. Int J Radiat Oncol Biol Phys. 2021;109:436–440. doi:10.1016/j.ijrobp.2020.09.032
- Furlanetto J, Loibl S. Optimal systemic treatment for early triple-negative breast cancer. Breast Care. 2020;15:217–226. doi:10.1159/000508759
- Pogorzelska A, Mazur M, Świtalska M, et al. Anticancer effect and safety of doxorubicin and nutraceutical sulforaphane liposomal formulation in triple-negative breast cancer (TNBC) animal model. Biomed Pharmacother. 2023;161:114490. doi:10.1016/j.biopha.2023.114490
- Hartgerink JD, Beniash E, Stupp SI. Self-assembly and mineralization of peptide-amphiphile nanofibers. Science. 2001;294:1684–1688. doi:10.1126/science.1063187
- Berndt P, Fields GB, Tirrell M. Synthetic lipidation of peptides and amino acids: monolayer structure and properties. J Am Chem Soc. 1995;117:9515–9522. doi:10.1021/ja00142a019
- Galdiero S, Falanga A, Morelli G, Galdiero M. gH625: a milestone in understanding the many roles of membranotropic peptides. Biochim Biophys Acta. 2015;1848:16–25. doi:10.1016/j.bbamem.2014.10.006
- Falanga A, Galdiero M, Galdiero S. Membranotropic cell penetrating peptides: the outstanding journey. Int J Mol Sci. 2015;16:25323–25337. doi:10.3390/ijms161025323
- Ben Djemaa S, Hervé-Aubert K, Lajoie L. gH625 cell-penetrating peptide promotes the endosomal escape of nanovectorized siRNA in a triple-negative breast cancer cell line. Biomacromolecules. 2019;20:3076–3086. doi:10.1021/acs.biomac.9b00637
- Barra T, Falanga A, Bellavita R. Neuroprotective effects of gH625-lipoPACAP in an in vitro fluid dynamic model of parkinson’s disease. Biomedicines. 2022;10:2644. doi:10.3390/biomedicines10102644
- Hossein-Nejad-Ariani H, Althagafi E, Kaur K. Small peptide ligands for targeting EGFR in triple negative breast cancer cells. Sci Rep. 2019;9:2723. doi:10.1038/s41598-019-38574-y
- Huang H. Matrix metalloproteinase-9 (MMP-9) as a cancer biomarker and MMP-9 biosensors: recent advances. Sensors. 2018;18:3249. doi:10.3390/s18103249
- Perillo E, Porto S, Falanga A, et al. Liposome armed with herpes virus-derived gH625 peptide to overcome doxorubicin resistance in lung adenocarcinoma cell lines. Oncotarget. 2016;7:4077–4092. doi:10.18632/oncotarget.6013
- Falanga A, Maione A, La Pietra A, et al. Competitiveness during dual-species biofilm formation of fusarium oxysporum and candida albicans and a novel treatment strategy. Pharmaceutics. 2022;14:1167. doi:10.3390/pharmaceutics14061167
- Del Genio V, Falanga A, Allard-Vannier E, et al. Design and validation of nanofibers made of self-assembled peptides to become multifunctional stimuli-sensitive nanovectors of anticancer drug doxorubicin. Pharmaceutics. 2022;14:1544. doi:10.3390/pharmaceutics14081544
- Yousif AM, Ingangi V, Merlino F, et al. Urokinase receptor derived peptides as potent inhibitors of the formyl peptide receptor type 1-triggered cell migration. Eur J Med Chem. 2018;143:348–360. doi:10.1016/j.ejmech.2017.11.030
- Bellavita R, Falanga A, Merlino F, et al. Unveiling the mechanism of action of acylated temporin L analogues against multidrug-resistant Candida albicans. J Enzyme Inhib Med Chem. 2023;38:36–50. doi:10.1080/14756366.2022.2134359
- Bellavita R, Falanga A, Buommino E, et al. Novel temporin L antimicrobial peptides: promoting self-assembling by lipidic tags to tackle superbugs. J Enzyme Inhib Med Chem. 2020;35:1751–1764. doi:10.1080/14756366.2020.1819258
- Stuart MCA, van de Pas JC, Engberts JBFN. The use of Nile Red to monitor the aggregation behavior in ternary surfactant–water–organic solvent systems. J Phys Org Chem. 2005;18:929–934. doi:10.1002/poc.919
- Wi S, Pancoska P, Keiderling TA. Predictions of protein secondary structures using factor analysis on Fourier transform infrared spectra: effect of Fourier self-deconvolution of the amide I and amide II bands. Biospectroscopy. 1998;4:93–106. doi:10.1002/(SICI)1520-6343(1998)4:2<93::AID-BSPY2>3.0.CO;2-T
- Portaccio M, Gravagnuolo AM, Longobardi S, et al. ATR FT-IR spectroscopy on Vmh2 hydrophobin self-assembled layers for Teflon membrane bio-functionalization. Appl Surf Sci. 2015;351:673–680. doi:10.1016/j.apsusc.2015.05.182
- Rea I, Sansone L, Terracciano M, et al. Photoluminescence of graphene oxide infiltrated into mesoporous silicon. J Phys Chem C. 2014;118:27301–27307. doi:10.1021/jp506539n
- Nemoto K, Kubo T, Nomachi M, et al. Simple and effective 3D recognition of domoic acid using a molecularly imprinted polymer. J Am Chem Soc. 2007;129:13626–13632. doi:10.1021/ja0741426
- Yamawaki Y, Yufu T, Kato T. The effect of a peptide substrate containing an unnatural branched amino acid on chymotrypsin activity. Processes. 2021;9:242. doi:10.3390/pr9020242
- Marulanda K, Mercel A, Gillis DC, et al. Intravenous delivery of lung-targeted nanofibers for pulmonary hypertension in mice. Adv Healthc Mater. 2021;10:e2100302.
- Piccolo M, Ferraro MG, Raucci F, et al. Safety and efficacy evaluation in vivo of a cationic nucleolipid nanosystem for the nanodelivery of a ruthenium(III) complex with superior anticancer bioactivity. Cancers. 2021;13:5164. doi:10.3390/cancers13205164
- Ferraro MG, Bocchetti M, Riccardi C, et al. Triple negative breast cancer preclinical therapeutic management by a cationic ruthenium-based nucleolipid nanosystem. Int J Mol Sci. 2023;24:6473. doi:10.3390/ijms24076473
- Guarnieri D, Biondi M, Yu H, et al. Tumor-activated prodrug (TAP)-conjugated nanoparticles with cleavable domains for safe doxorubicin delivery. Biotechnol Bioeng. 2015;112:601–611. doi:10.1002/bit.25454
- Lombardi L, Shi Y, Falanga A. Enhancing the potency of antimicrobial peptides through molecular engineering and self-assembly. Biomacromolecules. 2019;20:1362–1374. doi:10.1021/acs.biomac.8b01740
- Barra T, Falanga A, Bellavita R, et al. gH625-liposomes deliver PACAP through a dynamic in vitro model of the blood-brain barrier. Front Physiol. 2022;13:932099. doi:10.3389/fphys.2022.932099
- Yousef EM, Tahir MR, St-Pierre Y, Gaboury LA. MMP-9 expression varies according to molecular subtypes of breast cancer. BMC Cancer. 2014;14:609. doi:10.1186/1471-2407-14-609
- Jain RK, Stylianopoulos T. Delivering nanomedicine to solid tumors. Nat Rev Clin Oncol. 2010;7:653–664. doi:10.1038/nrclinonc.2010.139
- Amdursky N, Erez Y, Huppert D. Molecular rotors: what lies behind the high sensitivity of the thioflavin-T fluorescent marker. Acc Chem Res. 2012;45:1548–1557. doi:10.1021/ar300053p
- Jobin PG, Butler GS, Overall CM. New intracellular activities of matrix metalloproteinases shine in the moonlight. Biochim Biophys Acta Mol Cell Res. 2017;1864:2043–2055. doi:10.1016/j.bbamcr.2017.05.013
- Drin G, Cottin S, Blanc E, Rees AR, Temsamani J. Studies on the internalization mechanism of cationic cell-penetrating peptides. J Biol Chem. 2003;278:31192–31201. doi:10.1074/jbc.M303938200