
Abstract
Introduction
Insulin and C-peptide played crucial roles as clinical indicators for diabetes and certain liver diseases. However, there has been limited research on the simultaneous detection of insulin and C-peptide in trace serum. It is necessary to develop a novel method with high sensitivity and specificity for detecting insulin and C-peptide simultaneously.
Methods
A core-shell-satellites hierarchical structured nanocomposite was fabricated as SERS biosensor using a simple wet-chemical method, employing 4-MBA and DTNB for recognition and antibodies for specific capture. Gold nanorods (Au NRs) were modified with Raman reporter molecules and silver nanoparticles (Ag NPs), creating SERS tags with high sensitivity for detecting insulin and C-peptide. Antibody-modified commercial carboxylated magnetic bead@antibody served as the capture probes. Target materials were captured by probes and combined with SERS tags, forming a “sandwich” composite structure for subsequent detection.
Results
Under optimized conditions, the nanocomposite fabricated could be used to detect simultaneously for insulin and C-peptide with the detection limit of 4.29 × 10⁻⁵ pM and 1.76 × 10⁻¹⁰ nM in serum. The insulin concentration (4.29 × 10⁻⁵–4.29 pM) showed a strong linear correlation with the SERS intensity at 1075 cm−1, with high recoveries (96.4–105.3%) and low RSD (0.8%–10.0%) in detecting human serum samples. Meanwhile, the C-peptide concentration (1.76 × 10⁻¹⁰–1.76 × 10⁻³ nM) also showed a specific linear correlation with the SERS intensity at 1333 cm−1, with recoveries 85.4%–105.0% and RSD 1.7%–10.8%.
Conclusion
This breakthrough provided a novel, sensitive, convenient and stable approach for clinical diagnosis of diabetes and certain liver diseases. Overall, our findings presented a significant contribution to the field of biomedical research, opening up new possibilities for improved diagnosis and monitoring of diabetes and liver diseases.
Introduction
Insulin and C-peptide were significant clinical indicators of diabetes and some liver disease.Citation1 The detection of these indicators has important significance for the classification, diagnosis, evaluation of the disease, observation of the therapeutic effect and prediction of the disease prognosis.Citation2–4 At present, the strategies of detection of insulin and C-peptide included immunoassay and non-immunoassay. Immunoassay methods included radioimmunoassay (RIA),Citation5,Citation6 enzyme-linked immunoassay (ELISA),Citation5–8 and electrochemical luminescence (ECL).Citation9,Citation10 Non-immune detection methods included isotope dilution method,Citation11 high performance liquid chromatography,Citation12 mass spectrometry,Citation13,Citation14 etc. However, these methods depended on the professional equipment of hospitals or testing institutions mainly. Additionally, there were several drawbacks associated with these methods, including time-consuming procedures, low detection limits, expensive costs, and complex steps. Hence, the development of a more sensitive and cost-effective method for detecting insulin and C-peptide was imperative.
Recently, Surface-enhanced Raman spectroscopy (SERS) has attracting more attention due to the distinctive scattering properties of molecules to identify the chemical molecules through the amplification of electromagnetic fields generated by localized surface plasmon or chemical enhancement when these molecules were adsorbed on the surface of SERS active substrates such as Au, Ag and other noble metals.Citation15 It is advantageous to detect the behavior and molecular structure of surface molecules, especially when the molecules were trace amounts and mixed in complex components.Citation16,Citation17 SERS has been recognized as a promising, alternative diagnostic method due to its characteristics of high sensitivity, less cost, multiplex detection, etc.Citation18–24 SERS probe has been proven to be effective in detecting target substances even in complex biological environments highly. Numerous analysis methods based on SERS have been developed specifically for biological analyses.Citation25–28 It was crucial to highlight the pivotal role played by the SERS probe in these processes, as it determined the sensitivity and accuracy of the final results ultimately. Compared with other methods of Insulin and C-peptide detections, it was superior for SERS to realize minimal detection and lower expenditure. According to early reports, noble metal nanomaterials such as Au, Ag, Pt, etc., were regarded as ideal candidates for the construction of SERS probe.Citation29–31 Typically, Au nanomaterials were investigated widely due to their outstanding biocompatibility, tunable localized surface plasmon resonance (LSPR) properties, and outstanding surface-enhanced Raman scattering (SERS) performance.Citation32,Citation33 However, some drawbacks existed in unitary element Au nanomaterials. For instance, colloidal gold nanomaterials were prone to agglomeration in solution.Citation34 Additionally, the enhancement factor of Au was much weaker than that of Ag nanoparticles in SERS applications. Moreover, it was easy to be washed away due weak force and lack of special protection. Compared to unitary element Au nanomaterials, complex bimetallic or multi-metallic nanocomposites have gained widespread attention due to their appealing properties and multifunction.Citation35,Citation36 One such example is Ag@Au core-satellite nanocomposites, which have been reported as ideal SERS tools for ultra-sensitive imaging diagnosis of tumors due to more “hotspots” from the core-satellite plasmonic coupling and satellite–satellite coupling.Citation37 Therefore, our study combined nanocomposites with SERS detection method, making use of the advantages of both. Our method not only detected a small amount of sample but also avoided the high cost of immunoassay methods and professional equipment.
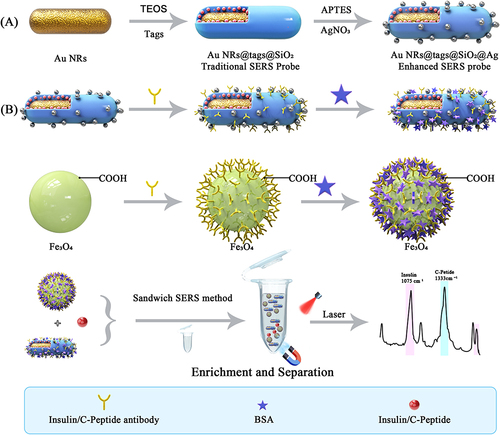
Based on the above discussion, a core-shell-satellites hierarchical structured Au nanorods@Raman tags@SiO2@Ag nanocomposite was fabricated, which was utilized for the SERS detection of insulin and C-peptide in . Firstly, nanocomposites Au NRs@SiO2@4-MBA@Ag and Au NRs@SiO2 @DTNB@Ag were prepared, in which 4-MBA and DTNB were used as Raman reporter molecules for SERS detection of insulin and C-peptide, respectively. Gold rods (Au NRs) were used the core and silver nanoparticles (Ag NPs) was adsorbed on the surface of the silicon layer to enhance the Raman signal, and the SiO2 layer ensures the performance of the synthesized nanomaterials more stable. The Fe3O4 magnetic substrate was used for magnetic separation of immune complexes. Subsequently, the nanomaterials and the magnetic substrate were incubated and combined with the antibody, respectively, and the immune complex of SERS probe-target antigen-magnetic substrate sandwich was formed using the antigen-specific binding principle, and finally the quantitative detection of the target antigen was realized. In comparison to individual Au nanorods, the core-shell-satellites nanocomposite offered several advantages. Firstly, the introduction of Ag satellites greatly enhances the enhancement factor. Secondly, two Raman tags were employed, enabling the separate detections of insulin and C-peptide. Additionally, the silica interlayer could prevent nanoparticle aggregation and protect the Raman reporter effectively. Using the magnetic nanoparticles was one of the methods to improve the performance of SERS immunoassays for biodetection, which were able to improve the time for analysis through immobilization of biological molecules and easy separation. The introduction of a magnetic substrate and construction of a sandwich system could separate and enrich the target substance (insulin and C-peptide). Subsequent experiments verified the effectiveness of the core-shell-satellites nanocomposite as a SERS probe for detection. The linear range for insulin detection was found to be 4.29 × 10⁻⁵–4.29 pM, with a detection limit (LOD) of 4.29 × 10⁻⁵ pM. Similarly, the linear range for C-peptide detection was 1.76 × 10⁻¹⁰–1.76 × 10⁻³ nM, with a LOD of 1.76 × 10⁻¹⁰ nM. Moreover, this method enabled the simultaneous detection of insulin and C-peptide in trace human serum samples successfully, showcasing its novelty, sensitivity, and convenience as a detection method.
Scheme 1 Schematic diagram of (A) synthesis of SERS probe and (B) SERS-based immunoassay used to detect insulin antibodies and C-peptide antibodies.
Materials and Methods
Materials and Characterization
All of the reagents used were analytically pure. Transmission electron microscopy (Tecnai 12, FEI, America), ultraviolet spectrometer (UV-vis, AOE, UV-1902, China), and Raman spectrometer (Raman, Thermofisher, DXR3 and DXRxi, America) were employed to characterize the nanocomposites. More details are shown in supplementary materials S1 and S2.
Construction of Core-Shell-Satellites Structured Au Nanorods@Raman Tags@SiO2@Ag Nanocomposite
For the construction of core-shell-satellites structured Au nanorods@Raman tags@SiO2@Ag nanocomposite, Au NRs@4-MBA@SiO2 and Au NRs@DTNB@SiO2 were synthesized according to early reports with moderate modification, and the details are shown in supplementary materials S3. Then, 1mL of the nanocomposite was dispersed properly in 50 mL of EtOH in a round-bottom flask, functionalized with –NH2 by introduction of 1mL APTES and reacted at 80°C for 12 h. Subsequently, AgNO3 (0.02 M, 0.5 mL) was added into the 0.02 g of APTES-functionalized nanomaterial dispersed in 10 mL deionized water and stirred at room temperature (300 rpm, 30 min). Then, trisodium citrate (0.2 M, 0.4 mL) and freshly prepared NaBH4 (0.01M, 20 μL) aqueous were added and stirred for 15 min and incubated for 12 h, respectively. Finally, the as-prepared nanocomposites were obtained by centrifugation and washing.
Construction of Sandwich Immunoassays for Raman Detection
A sandwich immunoassay was constructed by antibody modifying the as-prepared Au nanorods@Raman tags@SiO2@Ag nanocomposite (SERS probe) and antibody modifying commercial carboxylated magnetic bead@antibody. The antibody-modifying procedures can be found in supplementary materials S3. Firstly, 100 μL of the carboxylated magnetic bead@antibody prepared was added to 2 mL EP tube, then 40 μL insulin or C-peptide with different concentrations was added, incubated at room temperature for 3 h and magnetic separation, then the unbound antigen was removed by washing twice with PBS. The prepared SERS probes were subsequently added to the above mixed solution, incubated at room temperature for 2 h, magnetically separated, washed twice with PBS, and dispersed into 100 μL deionized water for SERS detection. For the best results, the parameters of preparation of SERS and sandwich immunoassay were also optimized in the SERS detection.
Specific Verification
The specificity of the prepared immunoassays is verified by adding different concentrations of insulin and C-peptide antigen and other interfering substances. Substances with the same concentration as in serum that may interfere with the detection of insulin and C-peptide were added to the detection system, including ascorbic acid (AA, 50 nM), high concentration glucose (20 mM), low concentration glucose (4 mM), glutathione (GSH, 300 mg/L), sodium chloride (NaCl, 140 mM) and valine (Val, 200 μM).
Feasibility Verification of SERS Probes for the Detection of Insulin and C-Peptide
Forty microliters quality control serum with different concentrations of insulin was added into AuNRs@4-MBA@SiO2@Ag@insulin antibody reaction system, the insulin concentrations were 4.29 pM, 0.429 pM, 4.29 × 10⁻² pM, 4.29 × 10⁻³ pM, 4.29 × 10⁻⁴ pM and 4.29 × 10⁻⁵ pM, respectively. Similarly, 40 μL quality control serum with different concentrations of C-peptide was added to AuNRs@DTNB@SiO2@Ag@C-peptide antibody reaction system. The C-peptide concentrations were 1.76 × 10⁻³ nM, 1.76 × 10⁻⁴ nM, 1.76 × 10⁻⁵ nM, 1.76 × 10⁻⁶ nM, 1.76 × 10⁻⁷ nM, 1.76 × 10⁻⁸ nM, 1.76 × 10⁻⁹ nM and 1.76 × 10⁻¹⁰ nM, respectively. The Raman spectrum and intensity of the sample were measured by SERS under the same conditions as before. According to the results, the standard curve and detection limit of insulin and C-peptide were obtained.
Insulin and C-Peptide Detection in Serum Respectively
The as-prepared SERS probes were also used to detect insulin and C-peptide in serum. We collected 16 groups of human serum samples. After 104 times dilution, the samples were added to the SERS immunoassay-based as-prepared probe. The value of insulin was calculated according to the standard curve, and the test value was compared with the clinical reference method. In addition, insulin and C-peptide in serum can be detected simultaneously using similar methods. We incubated two SERS probes and magnetic substrates with insulin and C-peptide antibodies, respectively. Then, the two reaction systems were evenly mixed with 100 μL each, and 19 groups of serum samples collected from clinical laboratory were diluted 104 times and added into the prepared immunoassay system. After incubation at room temperature for 3 h, 200 μL SERS probes were added, and incubated at room temperature for 2 h after mixing. After washing twice with PBS, we used SERS to detect the solution. The values of insulin and C-peptide were calculated according to the standard curve and compared with the clinical reference method.
Statistical Methods
By utilizing MedCalc software, we employed Bland-Altman chart and Pass-Bablok regression to compare the consistency of insulin and C-peptide detection results obtained from the clinical reference method (electroluminescence method) with the results obtained from this experiment. In the Bland-Altman chart, a majority of the points (over 95%) fell within the 95% agreement limit (ie, the mean ± 1.96 × standard deviation), suggesting a strong agreement. The biased 95% confidence intervals (CI) and limits of agreement were determined, and the 95% CI of LOA reflected the consistency between the results of both detection methods. Passing-Bablok regression was used to assess potential systematic and proportional differences between the two methods. The 95% CI of the intercept indicated whether there was a systematic difference, while the 95% CI of the slope indicated whether there was a proportional difference. To establish comparability between the two methods, the confidence interval for the population regression coefficient (slope) should encompass 1, and the confidence interval for the population intercept should encompass 0. If both conditions were met concurrently, the two methods were deemed consistent.
Results and Discussion
Characterization of Au NRs@SiO2@4-MBA/DTNB@Ag
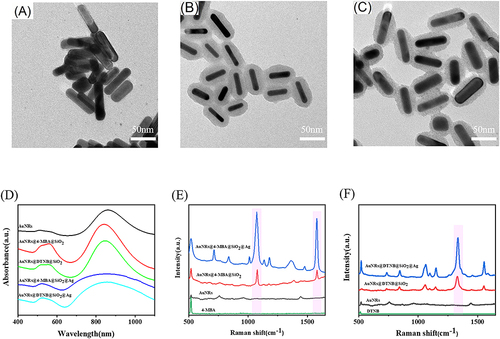
TEM was utilized to examine the construction of SERS probes composed of AuNRs@Raman tags@SiO2@Ag SERS probes. In , the uniform shape and size of nanorods, measured 30–40 nm in length and 10 nm in width approximately, were observed, confirming the successful fabrication of AuNRs. further demonstrates the encasing of AuNRs within a layer of SiO2, thus indicating the formation of core-shell nanocomposites known as AuNRs@ Raman tags@SiO2. reveals the symmetrical and uniform nature of the core-shell nanostructures, with the presence of small and dispersed nanoparticles on their surface. This observation suggested the deposition of Ag nanoparticles onto the AuNRs@Raman tags@SiO2, completing the construction of the AuNRs@4-MBA/DTNB@SiO2@Ag SERS probes. In , the UV–vis spectra were also used to further investigate the formation of SERS probes. The maximum absorption peak of gold nanorods was 862 nm. In addition, a weak shoulder peak form 500 nm to 600 nm, which was consistent with that reported in the literature.Citation38,Citation39 A slight shift in the absorption peak was observed in Au NRs@4-MBA@SiO2 and Au NRs@DTNB@SiO2 compared to Au NRs due to SiO2 encapsulation. On the other hand, the summit point of the absorption peak in the region from 500nm to 600 nm of Au NRs@4-MBA @SiO2 @Ag and Au NRs@DTNB @SiO2@Ag was blue-shifted, which could be attributed to the presence of silver nanoparticles. Raman spectra in and further indicated the existence of 4-MBA and DTNB and the enhancement effect due to weak signals of 4-MBA and DTNB solutions. The characteristic Raman peaks of 4-MBA were located at 1075 cm−1 and 1580 cm−1, consistent with the findings reported in the previous literature.Citation40–42 The characteristic Raman peaks of DTNB were located at 1333 cm−1 also aligns with previous research.Citation43–45 It was important to highlight that the strongest SERS signals were observed in AuNRs@4-MBA/DTNB@SiO2@Ag. This indicated that Ag nanoparticles can further enhance the characteristic Raman peaks of the SERS probes significantly. In addition, the nanocomposites as SERS probe also showed high reproducibility (RSD = 12.8%<15.0% at 1075 cm−1) when 20 SERS spectra were collected repeatedly in AuNRs@4-MBA@SiO2@Ag dispersions in Figure S1. Based on these findings, it could be concluded that AuNRs@4-MBA/DTNB@SiO2@Ag nanocomposites were an ideal candidate for SERS detection.
Figure 1 (A) Transmission electron microscopy (TEM)image of Au NRs; (B) Transmission electron microscope image of Au NRs@4-MBA/DTNB@SiO2; (C) Transmission electron microscope image of Au NRs@4-MBA/DTNB@SiO2 @Ag; (D) UV-vis spectra of Au NRs, Au NRs@4-MBA@SiO2, Au NRs@DTNB@SiO2, Au NRs@4-MBA @SiO2@Ag and Au NRs@DTNB@SiO2 @Ag; (E) Raman spectra of 4-MBA solution (0.01M), Au NRs, Au NRs@4-MBA@SiO2, Au NRs@4-MBA@SiO2@Ag; (F) Raman spectra of DTNB solution (0.01M), Au NRs, Au NRs@DTNB@SiO2, Au NRs@DTNB@SiO2@Ag.
Experiment Optimization
To obtain an ideal SERS probe, a series of experiments were conducted under different synthesis conditions (Figures S2 and S3). The amount of TEOS played a crucial role in the formation of SERS probe. Too little or too much TEOS led to the failure of preparation of silicon coating due to incomplete coating of silicon or unhydrolyzed free silicon (Figure S2A and S2C–E). Eighty microliters of TEOS three times (total 240μL) was effective to prepare these SERS probes (Figure S2B). Additionally, the concentration of Raman signal molecules also played a significant role in determining the sensitivity of detection. Based on the results from Figure S3A, a concentration of 10−2 M was identified as the ideal concentration for the subsequent synthesis of SERS probes. Similarly, the concentration of AgNO3 is also an important factor for the synthesis of SERS probe. As shown in Figure S3B, appropriate AgNO3 concentration could enhance the Raman strength of the synthesized probe compared to the Au NRs@4-MBA@SiO2 probe significantly. Based on the combined results of the Raman and TEM tests, an AgNO3 concentration of 11.48 μM was selected for the subsequent synthesis of the probe. When the sandwich systems were constructed, amounts of antibodies and probes also determined the results of detection. Figure S3C–D depicted Raman spectra of immunoassay systems prepared using varying amounts of antibodies and probes, respectively. It can be found that the optimal amount of antibody and probe used in this study was determined to be 100 µL and 200 µL, respectively.
Calibration Curve and Detection Limit of Immunoassay
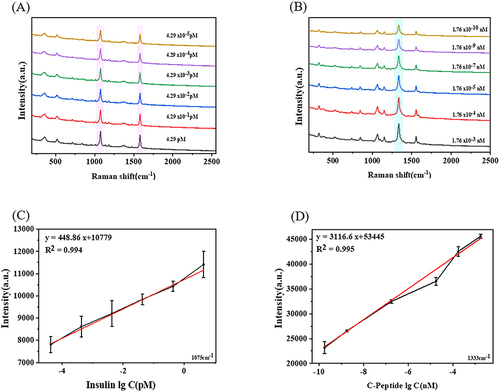
To establish calibration curves for the detection of insulin and C-peptide, the classical SERS-based immunoassay was employed using AuNRs@4-MBA@SiO2@Ag for the detection of insulin and AuNRs@DTNB@SiO2@Ag for the detection of C-peptide. and display the SERS spectra of the solutions with varying concentrations of insulin and C-peptide, respectively, using the prepared SERS probe. The Raman peaks of interest for the labeled molecule 4-MBA were found at 1580cm−1 and 1075cm−1, whereas the Raman peaks of DTNB were observed at 1333cm−1. Based on previous research findings, the Raman intensity at 1075cm−1 was chosen for quantification in the case of AuNRs@4-MBA@SiO2@Ag. The SERS intensity of the immunoassay system decreased with antigen dilution significantly. presents the calibration curve for insulin concentration and Raman intensity at 1075cm−1, showing a linear range of 4.29 × 10⁻⁵ pM to 4.29 pM. The linear regression equations were intensity = 448.86 lgC (Insulin)+10,779 (correlation coefficient R2= 0.994, N = 3), and the detection limit was 4.29 × 10⁻⁵ pM. Similarly, illustrates the calibration curve for C-peptide concentration and Raman intensity at 1333cm−1, with a linear range of 1.76 × 10⁻¹⁰ nM to 1.76 × 10⁻³ nM. The linear regression equations were intensity = 3116.6 lgC (C Peptide)+53,445 (correlation coefficient R2 = 0.995, N = 3), and the detection limit was 1.76 × 10⁻¹⁰ nM. In addition, the specificity experiments also proved that good specificity of SERS probe was obtained for the detection of insulin/C-peptide by adding a series of interfering substances in Figure S4A and S4B. compares the linear range and detection limits of this method with other methods for detecting insulin and C-peptide concentrations. The results indicated that this method is suitable for the detection of extremely low levels of insulin and C-peptide with excellent sensitivity, accuracy and convenience compared with other methods.Citation44–55
Table 1 Comparison of This Work and Other Methods Used in Insulin and C-Peptide Detection
Figure 2 (A) SERS spectrum of Au NRs@4-MBA@SiO2@Ag@insulin antibody response to different concentrations of insulin (4.29 pM, 0.429 pM, 4.29×10⁻² pM, 4.29×10⁻³ pM, 4.29×10⁻⁴ pM, 4.29×10⁻⁵ pM); (B) SERS spectrum of Au NRs@DTNB@SiO2@Ag @C-peptide antibody responds to different concentrations of C-peptide (1.76×10⁻³ nM, 1.76×10⁻⁴ nM, 1.76×10⁻⁵ nM, 1.76×10⁻⁷ nM, 1.76×10⁻⁹ nM, 1.76×10⁻¹⁰ nM); (C) The calibration curve of peak intensity at 1075 cm−1 varies with the lg value of insulin concentration;(D) Calibration curve of peak intensity at 1333 cm−1 varies with lg value of C-peptide concentration.
SERS Probes Were Utilized to Specifically Identify Insulin and C-Peptide in Serum Samples
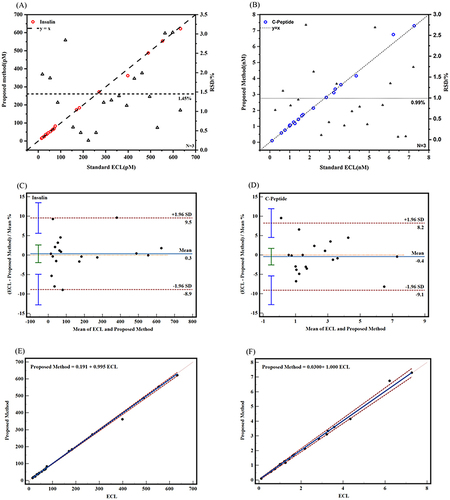
Initially, to assess the diagnostic potential of this immunoassay, we employed two SERS probes to detect insulin and C-peptide in the serum. The serum samples were obtained from the clinical laboratory, diluted 104 times and added into the prepared immunoassay system, as described above in the specific process. Subsequently, SERS was used to perform three consecutive detection cycles. Finally, the results obtained through this experimental approach were compared to those obtained using the clinical reference detection method. The comparative results are presented in and Table S1. In , the horizontal axis represents the chemiluminescence method as the clinical reference detection method. The left vertical axis represented this method, while the right vertical axis represents the relative standard deviation (RSD). The red circle represents the insulin value detected by the experimental method. The dashed line y = x was used to assess the deviation between the values detected by this method and the clinical reference detection method. The triangle represented the RSD value calculated from the results of the three tests, and the dashed line represents the average of all RSD values. It could be observed that the insulin results of the 16 groups of serum measured by the 4-MBA labeled probe were in close agreement with those obtained from laboratory detection. The recoveries ranged from 96.4% to 105.3%, with RSD values ranging from 0.8% to 10.0%. Similarly, the results of C-peptide measured by the DTNB-labeled probe were also similar to those detected in the laboratory (). The blue circles represented the C-peptide values detected by this method, while the remaining elements are the same as in the recoveries for C-peptide ranging from 85.4% to 105.0%, with RSD values ranging from 1.7% to 10.8%.
Figure 3 The results of serum insulin (A) and C-peptide (B) were compared with those of the clinical reference method (chemiluminescence method). Bland-Altman charts (C and D) and Pass-Bablok regression (E and F) were used for consistency analysis of the two detection methods.
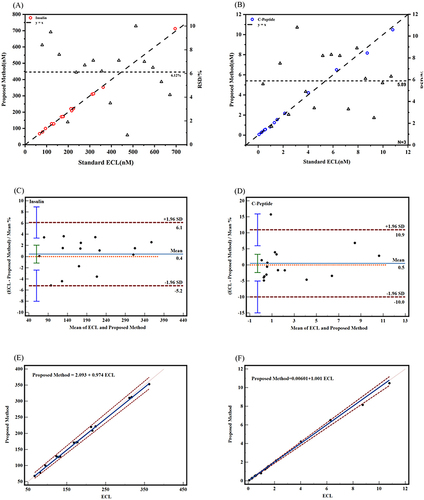
Additionally, we utilized MedCalc software to generate Bland-Altman charts and Pass-Bablok regressions to further evaluate the consistency of the results that were detected by the clinical reference detection methods and the results of this experiment. The Bland-Altman chart () demonstrated that all data points fall within the 95% limits of agreement nearly (ie, the mean ± 1.96 × standard deviation lines). In the insulin group, a mean bias of 0.446 (95% confidence intervalCitation46 for bias: −1.154 to 2.045) was observed, with limits of agreement ranging from −5.216 to 6.107. The 95% CI for limits of agreement was −8.013 to 8.904 (). Similarly, the mean bias for the C-peptide group was determined to be 0.462 (95% CI for bias: −2.385 to 3.310), with limits of agreement ranging from −10.011 to 10.935. The 95% CI for limits of agreement was 14.983 to 15.907 (). Moreover, the Pass-Bablok regression analysis () exhibited strong agreement between the two assay methods. In the insulin group, the regression equation was Proposed Method = 2.093 + 0.974 ECL (95% CI of intercept was −3.086–10.522; 95% CI of slope is 0.942–1.004) (). For the C-peptide detection group, the regression equation was Proposed Method = 0.00601 + 1.001 ECL (95% CI of intercept is 0.020–0.026; 95% CI of slope is 0.950–1.034) (). Collectively, these findings indicated a consistent detection of insulin and C-peptide levels in human serum when employing this methodology, aligning with the results obtained from clinical reference detection methods.
SERS Probes Were Employed for the Simultaneous Detection of Insulin and C-Peptide in Serum
To verify the feasibility of the immunoassay system for detecting insulin and C-peptide in serum simultaneously, we collected 19 groups of serum from the clinical laboratory. These samples were diluted 104 times and added to the prepared immunoassay system. SERS was used for continuous detection, with three repetitions. We compared the results obtained from this experimental method with those obtained from the clinical laboratory. The results are presented in and Table S2. The meanings represented by the horizontal and vertical coordinates and symbols are the same as those in . When compared with the results of laboratory detection, we found that the recovery rate of insulin detection ranged from 90.81% to 108.38%, with a relative standard deviation (RSD) of 0.25% to 3.04%. The recoveries of C-peptide ranged from 90.91% to 108.52%, with an RSD of 0.07% to 2.75%. The consistency of the results obtained with this method for insulin and C-peptide was further analyzed using MedCalc software to create Bland-Altman charts and Pass-Bablok regression. The Bland-Altman charts ( and ) demonstrated that all data points fall within the 95% consistency limit (ie, the mean ±1.96× standard deviation lines) nearly. The insulin detection group exhibited a mean bias of 0.335 (95% CI of bias: −1.925–2.596), with LOA ranging from −8.858 to 9.529. The 95% CI of LOA was calculated to be −12.7922 −13.4624 (). On the other hand, the mean bias of the C-peptide test group was −0.442 (95% CI of bias: −2.574–1.691), with LOA ranging from −9.114 to 8.231 (). The 95% CI of LOA was determined to be −12.824–11.941. Passing-Bablok regression analysis ( and ) also indicated good agreement between the two measurement methods. In the insulin detection group, the regression equation was Proposed Method = 0.191 + 0.995 ECL (95% CI of intercept was −1.038–1.329; 95% CI of slope is 0.979–1.007) (). Similarly, in the C-peptide detection group, the regression equation is Proposed Method = 0.03 + 1.00 ECL (95% CI of intercept is −0.025–0.062; 95% CI of the slope is 0.968–1.035) (). These findings provide evidence that the proposed method is capable of simultaneously detecting insulin and C-peptide in serum.
Figure 4 The results of serum insulin (A) and C-peptide (B) were compared with the results of clinical reference detection method (chemiluminescence method). Bland-Altman charts (C and D) and Pass-Bablok regression (E and F) were used for consistency analysis of the two detection methods.
Conclusion
As secreted substances of islet B cells, insulin and C-peptide are not only beneficial for the classification and monitoring of diabetes mellitus but also reflect the metabolic status of the body, related to tumor and cardiovascular disease. We constructed novel SERS nanoprobes by using a core-shell-satellites structured Au nanorods@Raman tags@SiO2@Ag nanocomposite. It has been successfully employed for the detection of insulin and C-peptide in trace serum samples with excellent reproducibility and accuracy. A variety of optimized experiments were performed by adjusting the reaction parameters to enhance their performance. Interestingly, we observed that the incorporation of Ag nanoparticles on SiO2 and the formation of core-shell-satellites structured nanocomposites played a crucial role in improving their SERS performance. Importantly, the as-prepared SERS probe exhibited simultaneous detection of insulin and C-peptide with a remarkable detection limit of 4.29 × 10⁻⁵ pM and 1.76 × 10⁻¹⁰ nM, respectively. These results are consistent with clinical detection methods, highlighting the reliability of our approach. The as-prepared SERS probe could be used to detect simultaneously for insulin and C-peptide with the detection limit of 4.29 × 10⁻⁵ pM and 1.76 × 10⁻¹⁰ nM, which is in good agreement with those of clinical detection. This method holds great potential for the quantitative detection of other disease-related molecular markers, offering a new perspective in the field. However, the reproducibility of nanomaterials is not good enough, so more researches are needed to carry out, such as reducing the nonspecific binding between target and SERS nanomaterials, aggregation of nanoparticles, improving the stability of SERS nanoprobes and so on.
Disclosure
The authors report no conflicts of interest in this work.
Acknowledgments
We thank the numerous individuals who contributed to this study. We are very grateful to the Affiliated Hospital of Xuzhou Medical University for providing serum samples and diagnostic information of all medical records. All serum samples were approved by the Ethics Committee of the Affiliated Hospital of Xuzhou Medical University (XYFY2022-KL370), and all subjects signed the informed consent.
Additional information
Funding
References
- Bertini A, Gárate B, Pardo F, et al. Impact of remote monitoring technologies for assisting patients with gestational diabetes mellitus: a systematic review. Front Bioeng Biotechnol. 2022;10:819697. doi:10.3389/fbioe.2022.819697
- So M, Elso CM, Tresoldi E, et al. Proinsulin C-peptide is an autoantigen in people with type 1 diabetes. Proc Natl Acad Sci USA. 2018;115:10732–10737. doi:10.1073/pnas.1809208115
- Maddaloni E, Bolli GB, Frier BM, et al. C-peptide determination in the diagnosis of type of diabetes and its management: a clinical perspective. Diabetes Obesity Metab. 2022;24:1912–1926. doi:10.1111/dom.14785
- Norton L, Shannon C, Gastaldelli A, DeFronzo RA. Insulin: the master regulator of glucose metabolism. Metabolism. 2022;129:155142. doi:10.1016/j.metabol.2022.155142
- Graham ML, Gresch SC, Hardy SK, Mutch LA, Janecek JL, Hegstad-Davies RL. Evaluation of commercial ELISA and RIA for measuring porcine C-peptide: implications for research. Xenotransplantation. 2015;22:62–69. doi:10.1111/xen.12143
- Warnken T, Huber K, Feige K. Comparison of three different methods for the quantification of equine insulin. BMC Vet Res. 2016;12:196. doi:10.1186/s12917-016-0828-z
- Bandres-Meriz J, Majali-Martinez A, Hoch D, et al. Maternal C-peptide and insulin sensitivity, but not bmi, associate with fatty acids in the first trimester of pregnancy. Int J Mol Sci. 2021;22:10422. doi:10.3390/ijms221910422
- Farino ZJ, Morgenstern TJ, Vallaghe J, et al. Development of a rapid insulin assay by homogenous time-resolved fluorescence. PLoS One. 2016;11. doi:10.1371/journal.pone.0148684
- Li HT, Liu XW, Li L, Mu XY, Genov R, Mason AJ. CMOS electrochemical instrumentation for biosensor microsystems: a review. Sensors. 2016;17:74. doi:10.3390/s17010074
- Liu X, Fang C, Yan JL, Li HL, Tu YF. A sensitive electrochemiluminescent biosensor based on AuNP-functionalized ITO for a label-free immunoassay of C-peptide. Bioelectrochemistry. 2018;123:211–218. doi:10.1016/j.bioelechem.2018.05.010
- Stoyanov AV, Connolly S, Rohlfing CL, Rogatsky E, Stein D, Little RR. Human C-peptide quantitation by LC-MS isotope-dilution assay in serum or urine samples. J Chromatogr Sep Tech. 2013;4:172. doi:10.4172/2157-7064.1000172
- Kinumi T, Goto M, Eyama S, Kato M, Kasama T, Takatsu A. Development of SI-traceable C-peptide certified reference material NMIJ CRM 6901-a using isotope-dilution mass spectrometry-based amino acid analyses. Anal Bioanal Chem. 2012;404:13–21. doi:10.1007/s00216-012-6097-1
- Chambers EE, Fountain KJ, Smith N, et al. Multidimensional LC-MS/MS enables simultaneous quantification of intact human insulin and five recombinant analogs in human plasma. Anal Chem. 2014;86:694–702. doi:10.1021/ac403055d
- Nedelkov D, Niederkofler EE, Oran PE, Peterman S, Nelson RW. Top-down mass spectrometric immunoassay for human insulin and its therapeutic analogs. J Proteomics. 2018;175:27–33. doi:10.1016/j.jprot.2017.08.001
- Lin T, Song YL, Liao J, Liu F, Zeng TT. Applications of surface-enhanced Raman spectroscopy in detection fields. Nanomedicine. 2020;15:2971–2990. doi:10.2217/nnm-2020-0361
- Le Ru EC, Meyer M, Etchegoin PG. Proof of single-molecule sensitivity in surface enhanced Raman scattering (SERS) by means of a two-analyte technique. J Phys Chem B. 2006;110:1944–1948. doi:10.1021/jp054732v
- Ding SY, Yi J, Li JF, et al. Nanostructure-based plasmon-enhanced Raman spectroscopy for surface analysis of materials. Nat Rev Mater. 2016;1:16021. doi:10.1038/natrevmats.2016.21
- Liu YJ, Cao WT, Ma MG, Wan P. Ultrasensitive wearable soft strain sensors of conductive, self-healing, and elastic hydrogels with synergistic ”soft and hard” hybrid networks. ACS Appl Mater Interfaces. 2017;9:25559–25570. doi:10.1021/acsami.7b07639
- Wang ZY, Zong SF, Wu L, Zhu D, Cui YP. SERS-activated platforms for immunoassay: probes, encoding methods, and applications. Chem Rev. 2017;117:7910–7963. doi:10.1021/acs.chemrev.7b00027
- Meng XD, Dai WH, Zhang K, Dong HF, Zhang XJ. Imaging multiple microRNAs in living cells using ATP self-powered strand-displacement cascade amplification. Chem Sci. 2018;9:1184–1190. doi:10.1039/c7sc04725h
- Wang YC, Jin YH, Xiao XY, et al. Flexible, transparent and highly sensitive SERS substrates with cross-nanoporous structures for fast on-site detection. Nanoscale. 2018;10:15195–15204. doi:10.1039/c8nr01628c
- Xu KC, Zhou R, Takei K, Hong MH. Toward flexible surface-enhanced raman scattering (SERS) sensors for point-of-care diagnostics. Adv Sci. 2019;6. doi:10.1002/advs.201900925
- Yang LL, Peng YS, Yang Y, et al. A novel ultra-sensitive semiconductor SERS substrate boosted by the coupled resonance effect. Adv Sci. 2019;6:1900310. doi:10.1002/advs.201900310
- Zhou YS, Zhao G, Bian JM, et al. Multiplexed SERS barcodes for anti-counterfeiting. ACS Appl Mater Interfaces. 2020;12:28532–28538. doi:10.1021/acsami.0c06272
- Tao W, Kong N, Ji XY, et al. Emerging two-dimensional monoelemental materials (Xenes) for biomedical applications. Chem Soc Rev. 2019;48:2891–2912. doi:10.1039/c8cs00823j
- Ju J, Hsieh CM, Tian Y, et al. Surface enhanced raman spectroscopy based biosensor with a microneedle array for minimally invasive in vivo glucose measurements. ACS Sens. 2020;5:1777–1785. doi:10.1021/acssensors.0c00444
- Wang XT, Guo L. SERS activity of semiconductors: crystalline and amorphous nanomaterials. Angew Chem Int Ed. 2020;59:4231–4239. doi:10.1002/anie.201913375
- Du Z, Qi YC, He J, Zhong DN, Zhou M. Recent advances in applications of nanoparticles in SERS in vivo imaging. Wiley Interdiscip Rev Nanomed Nanobiotechnol. 2021;13:1672. doi:10.1002/wnan.1672
- Dai X, Song ZL, Song WJ, et al. Shell-switchable SERS blocking strategy for reliable signal-on SERS sensing in living cells: detecting an external target without affecting the internal raman molecule. Anal Chem. 2020;92:11469–11475. doi:10.1021/acs.analchem.0c02747
- Liu H, Wei L, Hua J, et al. Enzyme activity-modulated etching of gold nanobipyramids@MnO2 nanoparticles for ALP assay using surface-enhanced Raman spectroscopy. Nanoscale. 2020;12:10390–10398. doi:10.1039/d0nr01837f
- Zhang C, Liu XZ, Xu ZW, Liu DB. Multichannel stimulus-responsive nanoprobes for H2O2 sensing in diverse biological milieus. Anal Chem. 2020;92:12639–12646. doi:10.1021/acs.analchem.0c02769
- Liu CC, Yang PP, Li JG, Cao SK, Shi J. NIR/pH-responsive chitosan hydrogels containing Ti3C2/AuNRs with NIR-triggered photothermal effect. Carbohydr Polym. 2022;295:119853. doi:10.1016/j.carbpol.2022.119853
- Wen C, Guo X, Gao C, et al. NIR-II-responsive AuNRs@SiO2-RB@MnO2 nanotheranostic for multimodal imaging-guided CDT/PTT synergistic cancer therapy. J Mat Chem B. 2022;10:4274–4284. doi:10.1039/d1tb02807c
- Quinson J, Aalling-Frederiksen O, Dacayan WL, et al. Surfactant-free colloidal syntheses of gold-based nanomaterials in alkaline water and mono-alcohol mixtures. ChemMater. 2023;35:2173–2190. doi:10.1021/acs.chemmater.3c00090
- Lee S, Namgoong JM, Jue M, et al. Selective detection of nano-sized diagnostic markers using Au-ZnO nanorod-based surface-enhanced raman spectroscopy (SERS) in ureteral obstruction models. Int J Nanomed. 2020;15:8121–8130. doi:10.2147/IJN.S272500
- Barbillon G, Graniel O, Bechelany M. Assembled Au/ZnO Nano-Urchins for SERS Sensing of the Pesticide Thiram. Nanomaterials. 2021;11:2174. doi:10.3390/nano11092174
- Guo YY, Li D, Zheng SQ, Xu NW, Deng W. Utilizing Ag-Au core-satellite structures for colorimetric and surface-enhanced Raman scattering dual-sensing of Cu (II. Biosens Bioelectron. 2020;159:112192. doi:10.1016/j.bios.2020.112192
- Wang GF, Wang WL, Shangguan E, Gao SY, Liu YF. Effects of gold nanoparticle morphologies on interactions with proteins. Mater Sci Eng C. 2020;111:110830. doi:10.1016/j.msec.2020.110830
- Prinz Setter O, Snoyman I, Shalash G, Segal E. Gold nanorod-incorporated halloysite nanotubes functionalized with antibody for superior antibacterial photothermal treatment. Pharmaceutics. 2022;14:2094. doi:10.3390/pharmaceutics14102094
- Huang XB, Wu SH, Hu HC, Sun JJ. AuNanostar@4-MBA@Au Core-Shell nanostructure coupled with exonuclease III-assisted cycling amplification for ultrasensitive SERS detection of ochratoxin A. ACS Sens. 2020;5:2636–2643. doi:10.1021/acssensors.0c01162
- Lin S, Hasi WL, Lin X, et al. Lab-on-capillary platform for on-site quantitative SERS analysis of surface contaminants based on Au@4-MBA@Ag core-shell nanorods. ACS Sens. 2020;5:1465–1473. doi:10.1021/acssensors.0c00398
- Xue XX, Chen L, Wang CX, et al. Highly sensitive SERS behavior and wavelength-dependence charge transfer effect on the PS/Ag/ZIF-8 substrate. Spectrochim Acta A Mol Biomol Spectrosc. 2021;247:119126. doi:10.1016/j.saa.2020.119126
- Pang YF, Wang CG, Lu LC, Wang CW, Sun ZW, Xiao R. Dual-SERS biosensor for one-step detection of microRNAs in exosome and residual plasma of blood samples for diagnosing pancreatic cancer. Biosens Bioelectron. 2019;130:204–213. doi:10.1016/j.bios.2019.01.039
- Jiang SQ, Li Q, Wang CW, Pang YF, Sun ZW, Xiao R. In situ exosomal MicroRNA determination by target-triggered SERS and Fe3O4@TiO2-based exosome accumulation. ACS Sens. 2021;6:852–862. doi:10.1021/acssensors.0c01900
- Zhou ZH, Xiao R, Cheng SY, et al. A universal SERS-label immunoassay for pathogen bacteria detection based on Fe3O4@Au-aptamer separation and antibody-protein A orientation recognition. Anal Chim Acta. 2021;1160:338421. doi:10.1016/j.aca.2021.338421
- Abazar F, Sharifi E, Noorbakhsh A. Antifouling properties of carbon quantum dots-based electrochemical sensor as a promising platform for highly sensitive detection of insulin. ED Manag. 2022;180:107560. doi:10.1016/j.microc.2022.107560
- Shepa J, Šišoláková I, Vojtko M, et al. NiO nanoparticles for electrochemical insulin detection. Sensors. 2021;21:5063. doi:10.3390/s21155063
- Noorbakhsh A, Alnajar AIK. Antifouling properties of reduced graphene oxide nanosheets for highly sensitive determination of insulin. Microchem J. 2016;129:310–317. doi:10.1016/j.microc.2016.06.009
- Wang J, Zhang XJ. Needle-type dual microsensor for the simultaneous monitoring of glucose and insulin. Anal Chem. 2001;73:844–847. doi:10.1021/ac0009393
- Liu TC, Chen MJ, Ren ZQ, Hou JY, Lin GF, Wu YS. Development of an improved time-resolved fluoroimmunoassay for simultaneous quantification of C-peptide and insulin in human serum. Clin Biochem. 2014;47:439–444. doi:10.1016/j.clinbiochem.2014.01.016
- Salimi A, Noorbakhash A, Sharifi E, Semnani A. Highly sensitive sensor for picomolar detection of insulin at physiological pH, using GC electrode modified with guanine and electrodeposited nickel oxide nanoparticles. Biosens Bioelectron. 2008;24:792–798. doi:10.1016/j.bios.2008.06.046
- Salimi A, Mohamadi L, Hallaj R, Soltanian S. Electrooxidation of insulin at silicon carbide nanoparticles modified glassy carbon electrode. Electrochem commun. 2009;11:1116–1119. doi:10.1016/j.elecom.2009.03.024
- Salimi A, Roushani M, Soltanian S, Hallaj R. Picomolar detection of insulin at renewable nickel powder-doped carbon composite electrode. Anal Chem. 2007;79:7431–7438. doi:10.1021/ac0702948
- Stoyanov AV, Rohlfing CL, Connolly S, Roberts ML, Nauser CL, Little RR. Use of cation exchange chromatography for human C-peptide isotope dilution - mass spectrometric assay. J Chromatogr A. 2011;1218:9244–9249. doi:10.1016/j.chroma.2011.10.080
- Thomas A, Brinkkötter PT, Schänzer W, Thevis M. Simultaneous determination of insulin, DesB30 insulin, proinsulin, and C-peptide in human plasma samples by liquid chromatography coupled to high resolution mass spectrometry. Forensic Toxicol. 2017;106–113. doi:10.1007/s11419-016-0343-8