Abstract
Staurosporine (STS) is a potent pan-kinase inhibitor with marked activity against several chemotherapy-resistant tumor types in vitro. The translational progress of this compound has been hindered by poor pharmacokinetics and toxicity. We sought to determine whether liposomal encapsulation of STS would enhance antitumor efficacy and reduce toxicity, thereby supporting the feasibility of further preclinical development. We developed a novel reverse pH gradient liposomal loading method for STS, with an optimal buffer type and drug-to-lipid ratio. Our approach produced 70% loading efficiency with good retention, and we provide, for the first time, an assessment of the in vivo antitumor activity of STS. A low intravenous dose (0.8 mg/kg) inhibited U87 tumors in a murine flank model. Biodistribution showed preferential tumor accumulation, and body weight data, a sensitive index of STS toxicity, was unaffected by liposomal STS, but did decline with the free compound. In vitro experiments revealed that liposomal STS blocked Akt phosphorylation, induced poly(ADP-ribose) polymerase cleavage, and produced cell death via apoptosis. This study provides a basis to explore further the feasibility of liposomally encapsulated STS, and potentially related compounds for the management of resistant solid tumors.
Introduction
Staurosporine (STS) is a pan-kinase inhibitor that exhibits potent activity against an array of cancer types in vitro.Citation1–Citation5 Even multidrug resistant tumor cells are rapidly driven into apoptosis, which has prompted the evaluation of STS for clinical use.Citation6,Citation7 However, translational development has not proved feasible because of poor pharmacokinetics and toxicity.Citation6,Citation8 A number of less potent but more stable STS analogs are in clinical trials, but these too are constrained by toxicity, which includes hyperglycemia with acidosis, pulmonary dysfunction, hypotension, creatinine elevation, diarrhea, nausea, and vomiting.Citation9,Citation10 Our aim was to assess whether liposomal encapsulation of STS would reduce toxicity and allow a comparatively low systemic dose to exert a significant antitumor effect in vivo.
The mechanism by which STS induces apoptosis is incompletely understood, but it is known that this compound inhibits multiple signaling pathways central to normal and tumor cell survival. STS, to a large extent, exerts its effects by interfering with phosphorylation of protein kinase B (Akt), which is a key convergence node for cytokine signaling and apoptosis pathways.Citation11–Citation13 Other members of the protein kinase family of signaling proteins, ie, protein kinase C, protein kinase A, and protein kinase G, also have important roles in tumorigenesis in different cancer types, including glioblastoma, and are inhibited by STS.Citation14–Citation17 Further, STS induces caspase-3-dependent apoptotic cell death through cleavage of several key proteins, such as poly(ADP-ribose) polymerase (PARP)1.Citation2,Citation18–Citation20 These interactions may account for the ability of STS to induce apoptosis in chemotherapy-resistant cancer cells, a characteristic that continues to elicit interest from a therapeutic perspective.
Liposomal encapsulation of STS has been proposed because this mode of drug delivery can reduce toxicity by substantially reducing normal tissue exposure.Citation21,Citation22 The liposomal bilayer would be expected to shield STS from plasma proteins, which tend to bind STS and reduce its circulation half-life. Optimal liposomal sizing (50–200 nm) combined with polyethylene glycol (PEG) conjugation to the external liposomal surface markedly slows circulatory clearance.Citation23,Citation24 Moreover, leaky microvasculature at tumor and metastatic sites facilitates preferential accumulation of liposomes, resulting in localization of drug to attain therapeutic concentrations in tumor tissue, even with a low intravenous systemic dose.Citation25–Citation27
While an attractive option, liposomal encapsulation the 7-hydroxy STS analog (UCN-01), has so far been quite limited in terms of loading efficiency.Citation28,Citation29 Hence, before conducting in vivo experiments with liposomal STS, we required a strategy by which this compound could be efficiently and stably encapsulated. We developed a novel remote loading approach modified from existing pH gradient methodology and utilizing optimized buffer composition. The final STS loading produced a drug-to-lipid ratio of 0.09 (mole/mole), compared with 0.03 for the 7-hydroxy STS analog, which is the highest previously reported in the literature for an STS class compound.Citation28,Citation29
Our goal here was to demonstrate the feasibility of liposomal STS as a potential cancer therapeutic. We utilized a resistant, fast-growing human U87 tumor murine flank model to test the hypothesis that liposomal encapsulation of STS reduces its systemic toxicity and facilitates effective antitumor activity in vivo. We also sought to investigate and compare the tumor cell killing mechanism of free and liposomal STS. Our study may provide a basis for further preclinical research exploring liposomally delivered STS and its analogs for managing multiple types of resistant solid cancers.
Materials and methods
Animal subjects
Athymic nu/nu mice of either gender and 5–6 weeks of age were used, with five mice housed in sterilized cages supplied with purified air passed through activated charcoal and HEPA filters. The mice were provided with autoclaved bedding, food, and water. All animal procedures were conducted in strict accordance with all appropriate regulatory standards under UC San Diego animal use protocol #S10057, which was reviewed and approved by the UC San Diego Institutional Animal Care and Use Committee.
Cell culture and reagents
A172, U87, U118, and U251 glioblastoma lines, a PC3 pancreatic cancer line, a B16F10 melanoma line, and a MDA-MB-231 breast cancer line were maintained under standard culture conditions in Dulbecco’s Modified Eagle’s Medium supplemented with 10% fetal bovine serum, glioblastoma 4 (GBM4) and glioblastoma 8 (GBM8) human tumor neurospheres were cultured in human basal neural stem cell medium: NeuroCult® NS-A Basal Medium (Human) supplemented with NeuroCult NS-A Proliferation Supplement (Human), epidermal growth factor, and basic fibroblast growth factor (obtained from Stem Cell Technologies Inc., Vancouver, BC, Canada).Citation30 Dioleoylphosphatidylethanolamine (DOPE), cholesterol, distearoylphosphatidylcholine (DSPC), and 1,2-distearoyl-sn-glycero-3-phosphothanolamine-B-[methoxy(polyethyleneglycol)-2000] (DSPE-mPEG2000) were purchased from Avanti Polar Lipids (Alabaster, AL, USA). STS was purchased from LC Laboratories (Woburn, MA, USA). A Sephadex G-50 column was sourced from GE Healthcare (Little Chalfont, UK), and the Sepharose CL6B and Dulbecco’s Modified Eagle’s Medium were purchased from Sigma-Aldrich (St Louis, MO, USA).
Preparation of liposomes
The composition of the liposomes included DSPC and was selected for stability and good payload retention, and PEG was attached to the liposomal surface to prevent opsonization and removal from the circulation by liver macrophages. The liposome formulation included cholesterol, DOPE, DSPC, and DSPE-mPEG2000 (6:6:6:1 molar ratio) in chloroform, and was evaporated under argon gas.Citation31 The dried lipid film was hydrated with a buffer containing ammonium phosphate, ammonium sulfate, sodium phosphate, or sodium sulfate (300 mM, and either pH 3 or pH 7.4), and vortexed for 1 minute to remove any adhering lipid film. Sonication in a bath sonicator (ULTRAsonik, Branson, Milford, CT, USA) for 1 minute at room temperature produced multilamellar vesicles. The multilamellar vesicles were in turn sonicated with a Ti-probe (450 sonicator; Branson Ultrasonics, Danbury, CT, USA) for 2 minutes to produce small unilamellar vesicles, indicated by formation of a translucent solution. Extrusion through a 100 nm pore size polycarbonate filter (Whatman, Maidstone, UK) was the final stage of a stepwise series of extrusions to reduce the size of the small unilamellar vesicles. A 6-(((4,4-difluoro-5-(2-thienyl)-4-bora-3a,4a-diazas-indacene-3-yl)styryloxy)acetyl) aminohexanoic acid, succinimidyl ester (BODIPY) 630/650 fluorophore was conjugated to DOPE, and this fluorescent lipid was incorporated into the particle at low concentration for imaging the liposomes in vitro and in vivo.
Reverse pH gradient for drug encapsulation
STS at neutral and basic pH is in the free base form (solubility in water 10–20 μM) while in acidic medium (10% citric acid) it forms an amine salt. We achieved a 10 mM STS concentration. The prepared liposomes with internal buffer at pH 3 or 7.4 were passed through a Sephadex G-50 column equilibrated with 4-(2-hydroxyethyl)-1-piperazineethanesul-fonic acid (HEPES) buffered saline (20 mM HEPES, 150 mM NaCl, pH 7.4) or phosphate-buffered saline to exchange the external buffer. After buffer exchange, STS in 10% citric acid at pH 3 was added to the liposome suspension, or the pH of the liposome suspension was increased to 7.4 by adding 1 N sodium hydroxide. The pH was measured with a pH meter. The solution was heated at 50°C for 20 minutes, left to stand for 4 hours at room temperature, and then applied to a Sephadex G-50 column and eluted with MilliQ water (EMD Millipore Bedford, MA, USA).
STS encapsulation efficiency
Encapsulation efficiency was quantified using a direct method, measuring the STS absorbance of loaded liposomes, and by high-performance liquid chromatography (HPLC). The two methods yielded very similar results. Using the direct method, STS absorbance at 294 nm was obtained by subtracting the absorbance of empty liposomes from that of STS-loaded liposomes. The concentration of encapsulated STS was then interpolated from a standard curve of absorbance versus concentration. Encapsulation efficiency was calculated by dividing the amount of STS entrapped by the total amount used to load the liposomes, multiplied by 100. For HPLC-based determination of encapsulation efficiency, the liposomes were first lyophilized and dissolved in HPLC grade methanol. The evaporation residue was dissolved in 100% HPLC grade acetonitrile, and reverse phase HPLC was performed using an Agilent 1100 series HPLC instrument (Agilent, Santa Clara, CA, USA) with an ultraviolet detector. Samples were injected into a Zorbax C18 column (Agilent) with an injection volume of 50 μL. Elution was performed with a mobile phase composed of 80% acetonitrile, 10% methanol, and 10% water (0.1% trifluoroacetic acid) at a flow rate of 0.8 mL per minute. STS was detected using ultraviolet light at 294 nm and 20°C. The concentration of STS was interpolated from a standard curve, and multiplied by 100 to yield the encapsulation efficiency of STS.
The published limit of detection of STS using liquid chromatography tandem mass-spectrometry is approximately 5 pmol, but more practically with ultraviolet detection the limit of detection value for STS is in the low ng range (20 ng/mL), while the limit of quantification in plasma using HPLC with ultraviolet detection is approximately 0.1 μg/mL.Citation32,Citation33
In vitro STS retention studies
Drug payload retention within liposomes is an important parameter that relates to circulation time and enhanced tumor accumulation of drug-loaded liposomes.Citation34 Hence we sought to measure retention of STS. STS-loaded liposomes were incubated in phosphate-buffered saline or 100% human serum at room temperature, and the experiment was repeated twice. Deidentified human serum was obtained via the UC San Diego Moores Cancer Center from human subjects providing informed consent (institutional review board approval number 100936). The STS concentration remaining in the liposomes was determined at 0.5, 1, 2, 4, 6, 12, 24, and 48 hours of incubation in phosphate-buffered saline or serum. For retention studies in phosphate-buffered saline, we used ultraviolet detection, and for plasma we used HPLC with ultraviolet detection. Separation of the liposomes from both phosphate-buffered saline and serum was performed by size exclusion chromatography. The phosphate-buffered saline liposome suspension was applied to a Sephadex G-50 column, while a Sepharose CL6B column was used for serum, both eluted with phosphate-buffered saline.Citation35 After separation, the concentration of STS within the liposomes incubated in phosphate-buffered saline was determined spectrophotometrically at 294 nm. The liposomes separated from serum were lyophilized and dissolved in methanol, and HPLC was performed as described earlier.
Activity of encapsulated STS against human glioblastoma cells in vitro
We evaluated the cytotoxic effect of STS-encapsulating liposomes and free STS on established human cancer cell lines, including A172, U251, U118, and U87 glioblastoma cells, and PC3 pancreatic and MDA-MB-231 breast cancer cells. All cells were grown in 96-well plates in complete medium with 10% fetal bovine serum at 37°C. We also used established patient-derived glioblastoma cell lines in the form of cancer stem cells acquired from fresh surgical isolates and grown in NeuroCult at 37°C.Citation36 With all cell lines, either free or liposomal STS was added and the cells were incubated for 72 hours. Tumor cell viability was evaluated using either the 3-(4,5-dimethylthiazol-2-yl)-2,5-diphenyltetrazolium bromide (MTT) (Sigma-Aldrich) or Alamar blue assays (AbD Serotec, Raleigh, NC, USA). The amount of STS loaded for in vitro testing and cell viability was the maximum that we could load. This was because our goal was to maximize the quantity of STS loaded into the liposomes so that tumor delivery would be enhanced to the greatest degree possible.
For experiments with free STS, 10 mmol/L stocks were first serially diluted in dimethylsulfoxide then with medium, to avoid precipitation. The concentration of free and liposomal STS added to cultures ranged between 200 nm and 0.1 nm, with two-fold decrements down the range. For both free and liposomal STS, cell viability was quantified using the MTT assay in all lines except GBM4 and GBM8.Citation37 The absorbance at 540 nm was measured after adding MTT. Results were expressed as: percent viability = (Absorbance (A) 540[treated cells] − background/A540[untreated cells] − background) × 100%. In GBM4 and GBM8 lines, cell viability was determined by adding Alamar blue to the cells and 6–12 hours later measuring fluorescence using excitation and emission wavelengths of 560 nm and 590 nm, respectively.Citation38 Results were expressed as: percent viability =(F1[treated cells] − background/F[untreated cells] − background) × 100%. Dose-response curves were plotted using GraphPad® Prism software (Graphpad Software, Inc., La Jolla, CA, USA) and inhibitory concentration 50% (IC50) values were calculated.
Fluorescence-activated cell sorting (FACS; BD Biosciences, Franklin Lakes, NJ, USA) analysis for apoptosis was performed to verify that both free and liposomal STS induced apoptosis compared with vehicle controls. Human U87 GBM cells were plated in a six-well plate at a density of 200,000 cells per well. After 18 hours of plating, the cells were incubated for 32 hours with either 200 nM of free STS, liposome-encapsulated STS, empty liposomes, or dimethylsulfoxide. This experiment was performed twice. The cells were stained using propidium iodide, which enters dead or dying cells, but cannot in a clear-cut way discriminate between primary necrosis and apoptosis. The cell population was measured by FACS, and the acquired data were analyzed using NIH ImageJ software (freeware from National Institutes of Health, Bethesda, MD, USA). Cell death was quantified by measuring the proportion of cells with fragmented DNA, ie, the sub G1 fraction (G0 fraction).
Mechanism of glioblastoma cell killing in vitro
Western blot analysis was performed for Akt, phospho-Akt, and cleaved PARP as an index of apoptosis. U87 cells were placed in a six-well plate at a density of 200,000 cells per well. After 18 hours of plating, the cells were incubated with 200 nM, 10 nM, or 0.1 nM of STS encapsulated in liposomes, free STS, or the control for 32 hours, and lysed with NP40 lysis buffer containing protease inhibitor (cOmplete, Mini; Roche Applied Sciences, Indianapolis, IN, USA) and phosphatase inhibitor cocktail (Sigma-Aldrich). The protein concentration was determined using a Bio-Rad protein assay kit (Bio-Rad Laboratories, Hercules, CA, USA). Equal amounts of protein (40 μg) were resolved on 4%–12% Nupage® Bis-Tris polyacrylamide gels (Invitrogen, Carlsbad, CA, USA). Protein was transferred to a nitrocellulose membrane and probed with primary antibodies to Akt, phospho-Akt, or cleaved PARP (Cell Signaling Technologies Inc., Danvers, MA, USA). Bands were detected by chemiluminescence (Amersham Pharmacia Biotech, Piscataway, NJ, USA).
Biodistribution of liposomes
Mice were subcutaneously injected with 2 × 10⁶ U87 cells. After the tumors reached 40–50 mm3, the mice were injected with BODIPY fluorescent dye-labeled liposomes containing STS. Four hours after the initial injection, fluorescein isothiocyanate-lectin was injected to label the tumor vascular endothelium. The tumor, liver, kidney, heart, and lung tissues were removed, sectioned, and examined under a scanning confocal microscope (Nikon Corporation, Tokyo, Japan). We acquired five images per organ and the BODIPY pixel count was normalized by the total pixels in each acquisition, which was the same size for all organ image acquisitions. BODIPY is covalently conjugated to the lipid and present within the liposomal bilayer, so was unlikely to be liberated. The labeled pixels were counted and normalized against the total pixels of each image.
In vivo antitumor activity and systemic toxicity of encapsulated STS
Athymic nu/nu mice aged 5–6 weeks were subcutaneously inoculated in both the right and left flank with 2 million U87 glioblastoma cells. In one group (n=4; total of eight tumors), the tumors were allowed to grow very large (180–200 mm3), while in a second group (n=5; total of ten tumors), the tumors were allowed to establish but the experiment was started earlier, when they reached 40–50 mm3. The mice in both tumor volume groups were sorted so that the treatment and control groups had the same average tumor size.
For the initial experiment, mice bearing tumors allowed to reach 180–200 mm3 were treated with three intravenous doses per week for 2 weeks of either phosphate-buffered saline, free STS (0.8 mg/kg), or encapsulated STS (0.8 mg/kg). The second cohort with 40–50 mm3 tumors was injected with either 200 μL of encapsulated STS for a 0.8 mg/kg STS dose three times per week for 3 weeks, or with 200 μL of empty liposomes or phosphate-buffered saline according to the same time schedule.
In all study groups, the tumors were measured weekly using calipers and volume was calculated using the standard formula: V =(length × [widthCitation2])/2.Citation39 The mice were sacrificed when the tumors reached 1,500 mm3, in accordance with our Institutional Animal Care and Use Committee protocol. Studies show that free STS clears from the circulation immediately, and the elevated doses required to bypass this effect are acutely toxic, while lower doses may have longer-term toxicity.Citation40,Citation41 In order to determine whether liposomal encapsulation of STS reduced toxicity, body weight was measured before and after the treatment period, because loss of body weight is a generally reliable sign of toxicity seen after STS treatment, and is often used as a toxicity measure in murine studies of cancer chemotherapy agents.Citation42–Citation44
Tumor cell proliferation with liposomal STS was assessed using Ki-67 staining. Paraffin-embedded tumor xenografts from animals treated with phosphate-buffered saline, free STS, and liposomal STS were sectioned, deparaffinized, heated at 97°C for 30 minutes for antigen retrieval, and blocked with peroxidase, 2.5% horse serum, and avidin/biotin. Sections were incubated with Ki-67 antibody (Abcam, Cambridge, MA, USA) for one hour at room temperature and then with secondary antibody for 30 minutes at room temperature. Slices were stained with DAB peroxidase substrate solution (Vector Laboratories, Burlingame, CA, USA) and counterstained with hematoxylin. The extent of Ki-67 staining was tabulated by counting stained cells at 40 × field using a light microscope (Nikon Corporation). Three separate fields of each slide were counted for Ki-67-positive cells.
Statistical analysis
All statistical analyses were performed with Excel (Microsoft, Redmond, WA, USA) or Prism (GraphPad). The statistical significance of the experiments was determined by a two-tailed Student’s t-test (parametric) and Mann–Whitney U test (nonparametric). P-values,0.05 were considered to be statistically significant. Both parametric and nonparametric tests were applied to address the possibility that the group variances may have differed. In all figures, the vertical bars represent the mean value ± standard deviation. In order to compare tumors, t-tests were performed at the final time point.
Results
Physical characterization of liposomes
Liposomal size and charge was measured with the STS-loaded liposomes in water, in phosphate-buffered saline, and in 10 mM NaCl (). The average liposomal size in distilled water was 108 ± 1.1 nm, which was very close to that in phosphate-buffered saline or NaCl (three measurements each, ). The zeta potential or liposome surface charge in all types of medium was close to the desired neutrality (, ten measurements in each medium). Scanning electron microscopy data confirmed that the STS-loaded liposomes in distilled water were spherical and intact (). The poly-dispersity index was low in water, in phosphate-buffered saline, and in 10 mM NaCl, at 0.15, 0.25, and 0.25. This is consistent with a homogeneous size distribution and absence of aggregation.
Encapsulation efficiency
Reverse pH gradient with ammonium-based buffers produced effective encapsulation
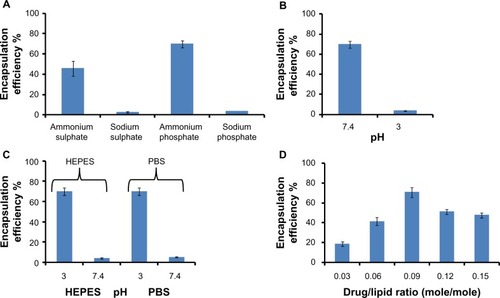
Liposomes were prepared by hydrating the lipid film with ammonium and sodium buffers. The extraliposomal buffer was exchanged through different external buffers (HEPES, phosphate-buffered saline) and purification achieved by size exclusion chromatography (). shows the effect of internal buffer composition and shows the effect of internal buffer pH. For these experiments, the external buffer pH was kept constant. The best encapsulation efficiencies of 70% and 65% were achieved when the internal buffer was ammonium phosphate or ammonium sulfate, respectively, and pH was 7.4 (). Sodium phosphate and sodium sulfate buffers produced very low encapsulation of 3%–4%. The encapsulation efficiency was the same whether the milieu external to the liposomes consisted of HEPES or phosphate-buffered saline ().
Figure 1 Parameters affecting staurosporine encapsulation in liposomes – the importance of a reverse pH gradient, buffer composition, and drug-to-lipid ratio. Each experiment for all four panels was repeated three times. (A) Encapsulation of staurosporine in liposomes driven by different internal buffers (n=3). (B) Effect of internal buffer pH on staurosporine encapsulation. The external buffer was held at constant pH 3. (C) Effect of external buffer and its pH. The internal buffer was held at constant pH 7.4. (D) Encapsulation efficiencies of liposomal staurosporine at increasing initial drug-to-lipid ratios (mole/mole). Each data point represents mean encapsulation efficiency calculated from three samples.
Abbreviations: PBS, phosphate-buffered saline; HEPES, 4-(2-hydroxyethyl)-1-piperazineethanesul fonic acid.
Optimal drug-to-lipid ratio for efficient STS encapsulation
STS was added in drug-to-lipid ratios of 0.03, 0.06, 0.09, 0.12, or 0.15 (mole/mole). STS uptake into the liposomes was measured as described. Liposomal loading capacity was highest when the drug-to-lipid ratio was 0.09 (mole/mole), with a peak value of 70%, compared with 25% obtained for previously described formulations ().Citation28 Our spectrophotometric measurements indicated that we loaded 81.5 μg of STS for each 1 mL of liposomes. The optimal loading regime including the reverse pH gradient, ammonium phosphate buffer, and optimal drug-to-lipid ratio was used for all the subsequent in vitro/vivo experiments in this study.
In vitro liposomal retention of STS
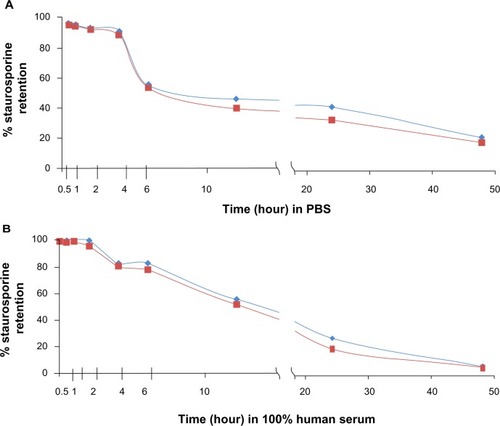
Liposomal retentionCitation34 studies performed in duplicate revealed that the encapsulating liposomes were stable for several hours, with comparatively little leakage of payload. reveal that after 2 hours of incubation in human serum, respectively, the liposomes retained more than 96% of the initial load of STS. The liposomes were not formulated to be thermosensitive and although we did not test at 37°C, we selected our lipids for stability and short-term (0–6 hours) payload retention within the temperature range of 22°C to 37°C.Citation45 We used DSPC lipid, which has a phase transition temperature of approximately 55°C, and DSPC liposomes have demonstrated stable payload retention between 4°C and 37°C.Citation46 By 6 hours of incubation in serum, the liposomes retained 82% of the STS, 55% after 12 hours, 25% after 24 hours, and 5% after 48 hours. In phosphate-buffered saline, 90% of the drug was retained after 4 hours, 56% after 6 hours, 45% after 12 hours, 42% after 24 hours, and 23% after 48 hours ().
Figure 2 Gradient-loaded liposomes are stable with good payload retention in vitro. Liposomes suspended in (A) PBS and (B) human serum. Graphs show results of duplicate tests. Retention was measured after incubation in PBS/serum at room temperature for a range of times. Virtually 100% staurosporine was contained within the liposomes by 3 hours of incubation in PBS or serum, with approximately 80% of the staurosporine remaining after 6 hours of incubation. Red = expt 1; blue = expt 2.
Abbreviation: PBS, phosphate-buffered saline; expt, experiment.
Activity of encapsulated STS against glioblastoma cells in vitro
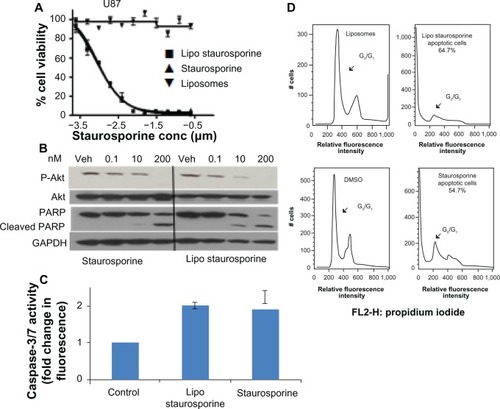
Encapsulation of STS within liposomes did not impede its cytotoxic effect. We evaluated the inhibitory effect of free and encapsulated STS on established and freshly derived human solid tumor cell lines by measuring cell viability (, –). The results with both patient-derived stem cells and established brain tumor lines show that the EC50 of free and liposomal STS was comparable (). Potency in these cell lines, and in the PC3 prostate tumor line, ranged from approximately 1 nM to 13 nM. The EC50 for the MDA-MB-231 breast tumor line was higher, at 113 nM with liposomal STS, but better than free STS with an EC50 of 507 nM. In addition, the FACS results indicated that both free and liposomal STS induced cell death compared with the controls, which were empty liposomes alone and dimethylsulfoxide alone (). The G0 fraction increased markedly from approximately 2.4% in controls to 54% with free STS and 62.9% with liposomal STS.
Figure 3 Potency and mechanism of liposomal staurosporine in vitro. (A) In vitro MTT cell viability assay results for free and liposomal staurosporine versus empty liposomes (control) were determined with U87 glioblastoma cells. First, 2,000 cells were plated and after 18 hours free or liposomal staurosporine was added. The concentration of free or liposomal staurosporine added to cultures ranged between 200 nm and 0.1 nm, with two-fold decrements down the range. Free and liposomal staurosporine had very similar potency while empty liposomes caused essentially no tumor cell killing. (B) Western blot analysis for Akt, P-Akt, and cleaved poly(ADP-ribose) polymerase. U87 cells were incubated with 200 nM, 10 nM, and 0.1 nM of staurosporine encapsulated in liposomes and staurosporine for 32 hours. (C) Bar graph showing caspase-3/7 activity as fold change from control (which is 1). Free and liposomal staurosporine yielded similar changes in caspase activity. (D) Fluorescence-activated cell sorting analysis for U87 glioblastoma cells incubated with either empty liposomes, 200 nM of staurosporine encapsulated in liposomes, dimethylsulfoxide, or free staurosporine. Representative plots of two repeats per condition are shown, and reveal that both free and liposomal staurosporine induced cell death, indicated by a G0/G1 shift, compared with the dimethylsulfoxide and empty liposome control treatments.
Abbreviations: conc, concentration; MTT, (3-(4,5-dimethylthiazol-2-yl)-2,5-diphenyltetrazolium bromide; Lipo, liposomal; PARP, poly(ADP-ribose) polymerase; GADPH, Glyceraldehyde 3-phosphate dehydrogenase; Akt, protein kinase B; DMSO, Dimethyl sulfoxide; Veh, DMSO vehicle control.
Mechanism of STS-induced glioblastoma cell killing in vitro
Morphologic changes clearly indicated a direct toxic effect on the cells, which rounded up and assumed an appearance consistent with apoptosis (). The cells showed evidence that fluorescent liposomes entered the cells (). The Western blot results for PARP cleavage were consistent with induction of apoptosis (). The Western blot analysis also indicated that Akt phosphorylation was blocked by STS ().Citation47,Citation48 In addition, we tested free and liposomal STS with other cell lines, including A172, U118, U251, GBM4, GBM8, PC3, and MDA-MB-231. All cell lines were driven into apoptosis and exhibited similar IC50 values with the free compound and the liposomal compound.
Biodistribution of liposomes
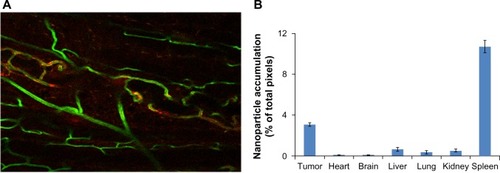
depicts liposomal accumulation within the sectioned U87 tumors growing subcutaneously in the mouse flank. is the quantitation for each listed organ from which five slices were acquired and imaged for two mice. The highest relative density of fluorescently labeled liposomes was recorded in the tumor tissue, although accumulation of the label was seen in other organs, in particular the spleen. It is noteworthy that very little accumulation was seen in the normal brain. The data do not reveal absolute amounts, but are nonetheless encouraging and consistent with an improvement of pharmacokinetics and biodistribution, providing a basis for subsequent, comprehensive biodistribution studies incorporating fluorescence and liquid chromatography-mass spectroscopy.
Figure 4 Liposomal BODIPY (boron-dipyrromethene) fluorescence attained a relatively high density in tumor tissue. (A) Liposomes (labeled red) clearly entered the tumor and accumulated at tumor microvessels (labeled green). (20 × scanning confocal image). (B) The bar graph shows the liposomal BODIPY pixel density for two mice bearing tumors that were injected intravenously with liposomes. Five images were acquired per organ in two mice, the pixel density was normalized by the total number of acquired pixels, and all organs were imaged with the same magnification. As expected, the spleen showed a high accumulation, but normal brain tissue showed very low accumulation. The filled columns indicate the average value while the superimposed line bars delineate the range.
Encapsulated STS exhibits in vivo antitumor activity with no evidence of toxicity based on body weight
We found that a relatively high dose of both free STS and liposomal STS (5 mg/kg) was acutely lethal, but 0.8 mg/kg was not, and the equivalent in vitro dose (40 nM) attained 100% tumor cell killing. Based on the literature, a 0.8 mg/kg dose injected as free STS in rodents would be entirely cleared after only a few circulatory passes, and no demonstrable effect on tumor growth would even be feasible.Citation33
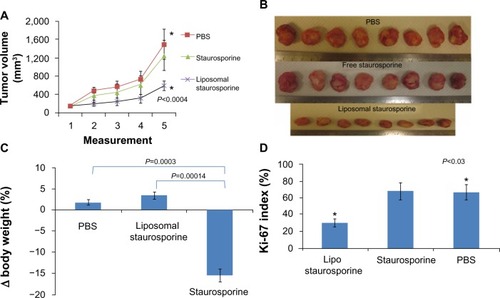
When the tumors were allowed to grow very large (>180 mm3) before treatment was started, treatment with liposomal STS over 2 weeks markedly slowed the growth of the tumors relative to those treated with phosphate-buffered saline and free STS. The plots in reveal a substantial and statistically significant effect (parametric P<0.0004; nonparametric P=0.00018), and the photographs in suggest little apparent variation in size. Free STS had no demonstrable antitumor effect and was toxic, as body weight did decline (parametric P=0.0003; nonparametric P=0.005), while animals treated with liposomal STS or phosphate-buffered saline had no weight difference (). Ki-67 staining in tumor tissue revealed that tumor proliferation was significantly reduced with liposomal STS (parametric and nonparametric, P<0.03; ).
Figure 5 Liposomal staurosporine markedly suppressed 180–200 mm3 U87 flank tumors with no body weight-related evidence of toxicity. There were four subjects per group for tumor size, tumor images, body weight, and Ki-67. (A) Control (■), liposomal staurosporine (×) and free staurosporine (▲). The x-axis represents measurements (mean ± standard deviation) on successive days after tumor implantation (Parametric P<0.0004, shown in figure; nonparametric P=0.00018). (B) Tumor images for liposomal staurosporine, free staurosporine, and PBS groups. (C) Body weight bar graph showing a significant decline in body weight with free staurosporine, indicating toxicity (parametric P=0.0003, shown in figure; nonparametric P=0.005). Note for the liposomal staurosporine group that, at the end of the treatment period, body weight as compared with pretreatment weight did not differ from the same measure in controls. (D) Proliferating tumor cells identified using Ki-67 in PBS, staurosporine, and liposomal staurosporine treatment groups. The PBS and liposomal staurosporine groups differed significantly (Parametric, shown in the figure, and nonparametric P<0.03) while PBS versus free staurosporine did not. * indicates comparison between PBC and liposomal staurosporine.
Abbreviations: PBS, phosphate-buffered saline; lipo, liposomal.
We next examined the antitumor effect when treatment was started with smaller (40–50 mm3) but well established and rapidly growing tumors. We compared tumor growth in mice that were treated with empty liposomes versus those treated with liposomal STS. reveal complete suppression of tumor growth with liposomal STS at 0.8 mg/kg (parametric P<0.0006; nonparametric P=0.00044).
Figure 6 Liposomal staurosporine completely inhibited the growth of established 40–50 mm3 U87 flank tumors with no evidence of toxicity. PBS (♦), liposomes (■), liposomal staurosporine (▲). The x-axis represents measurements on successive days after tumor implantation (n=5; parametric P<0.0006 shown in figure; nonparametric P=0.00044). * indicates PBS versus liposomal staurosporine. (B) Photographs of nude mice implanted subcutaneously in both flanks with U87 cells and treated. (C) Body weights for mice treated with PBS, empty liposomes, or liposomal staurosporine. Unpaired, parametric and nonparametric comparisons indicated no significant difference between weights taken before versus after treatment (PBS versus liposomal staurosporine parametric P=0.096; empty liposomes versus liposomal staurosporine, parametric P=0.16).
Abbreviation: PBS, phosphate-buffered saline.
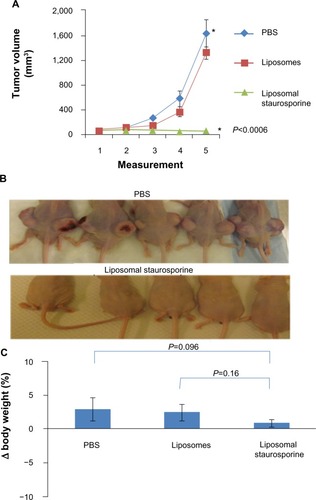
Body weight did not differ between the liposomal STS and empty liposome cohorts in the small tumor (40–50 mm3) group, again indicating a general absence of toxicity when STS was encapsulated (). Based on the literature, injection of 0.8 mg/kg STS in the free drug form is cleared from the circulation rapidly. Similarly, our results for the large tumor group (180–200 mm3) indicate that free STS at the doses we used had no detectable effect on tumor growth.Citation8 We did not administer free STS to mice bearing the smaller (40–50 mm3) tumors because we found evidence of systemic toxicity in the large tumor group.
Discussion
Our study demonstrates inhibition of tumors established in vivo using liposomal STS administered at a low intravenous dose. Liposomal encapsulation reduced toxic ity, as mice treated with liposomal STS experienced no loss of weight over the 41-day experimental period ( and ). In contrast, there was definite weight loss in mice injected with a comparable dose of free STS (). Biodistribution data revealed that the liposomes concentrated in tumors (), most probably via the enhanced permeability retention effect, and targeting may further enhance selectivity.Citation49 Notably, even when treatment was withheld until the tumors became much larger, liposomal STS markedly suppressed tumor growth (). These are the first in vivo results for STS loaded into liposomes, and support the feasibility of further translational investigations of liposomal STS for cancer treatment.
Collectively it has been hypothesized that the pharmacokinetic and toxicity related limitations of STS could be overcome by liposomal encapsulation.Citation50 The liposomes accumulated in the tumor and the spleen, as expected for a nanoparticle, and showed relatively much less accumulation in other organs. Interestingly, the normal brain has been found to have a low concentration which may be beneficial, assuming that liposomes accumulate in brain tumors via leakage from malformed tumor microvasculature, as demonstrated by Munson et al.Citation51 We explored a gradient-based method owing to its simplicity and efficient loading.Citation52,Citation53 Earlier gradient loading studies reported that liposomal uptake of drugs was driven by neutral external pH and low internal pH. We tested this and other pH profiles in an effort to optimize loading and, for the first time, describe enhancement of loading by reversing the gradient profile, so that external pH was low while internal pH was neutral (). Our methodology may be amenable for enhancement of liposomally encapsulating other potentially useful drug chemotypes that are currently limited due to poor loading.
We found that ammonium-based buffers resulted in higher loading compared with sodium salt buffers, and the best results were acquired using ammonium phosphate buffer. The reason is unknown, but ammonium groups are weakly acidic and can be transformed to ammonia, a weak base which is more lipophilic and could readily pass into the lipid bilayer, potentially affecting its barrier characteristics. We plan to address in a subsequent study the physical basis for improved loading with ammonium salt-based buffers, and to confirm the final loaded location of the STS. Moreover, given its chemical structure and hydrophobicity, it is quite possible that STS may have partitioned in the lipid bilayer of the liposomes, and a systematic experimental confirmation of this will be a primary focus in a forthcoming study.
Prevention of premature drug payload release from circulating liposomes is an essential requirement to ensure adequate accumulation of the compound in tumors.Citation8,Citation34 Previous gradient loading methods have only supported liposomal retention of weakly basic anthracyclines such as doxorubicin and to some extent the camptothecin analogs.Citation54,Citation55 The loading methodology and liposomal composition we describe resulted in high (≥96%) STS retention at 2 hours in human serum, with 82% remaining at 6 hours (). Thus, the liposomal bilayer did not require extensive modification or addition of stabilizers to slow payload efflux. Given that we observed liposomes accumulating at the tumor site by 5 hours after intravenous injection, the favorable liposomal retention of STS in serum would support effective tumor delivery. Future studies may examine the relationship with cellular retention of STS, because recent data indicate that this is crucial for STS-induced cell death in the model organism, Neurospora crassa.Citation56
Liposomal encapsulation did not change the nature or mechanism of cell killing by STS when compared with the free drug (). Moreover, the in vivo antitumor effect of liposomal STS was robust in the subcutaneous U87 tumor model, while the free compound did not elicit a detectable antitumor effect ( and ). The U87 model was used as a general platform since we aimed to explore the feasibility of liposomal STS as a general agent for resistant solid tumors (). In terms of brain tumors, a recent report has shown tumor accumulation via leaky tumor vasculature and a robust antitumor effect of liposomal doxorubicin in the rat C6 glioma.Citation51 Owing to its high degree of potency, we expect that even a low concentration of STS in brain tumors may exert a useful therapeutic effect. In our system, liposomal STS completely suppressed 40–50 mm3 tumors, and even much larger tumors (in the order of >180 mm3) had a significant reduction in growth, even with delayed treatment ( and ). The growth kinetics of the large versus small tumors differed, with the smaller tumors growing faster ( and ). Although the basis for this is not known, one possible explanation is that the larger tumors outstripped their blood perfusion, and potentially became internally hypoxic and necrotic so that a smaller proportion of their mass was actively proliferating.
The present study was primarily focused on demonstrating the feasibility of liposomal STS to justify further, more comprehensive efficacy, pharmacokinetic, and toxicity studies, and hence has limitations in terms of interpretation. For example, more detailed dynamic studies showing the change in liposomal biodistribution and STS concentration during the first 48 hours and diverse measures of toxicity will be pursued in follow-up research. Such indepth experiments were beyond the scope and intent of the present study. In addition, while the lipids we selected for our liposomal formulation are stable between room and body temperature (), later more detailed retention optimization studies will be conducted at 37°C in vitro and will subsequently be validated by in vivo experiments.
In summary, this study demonstrated for the first time the antitumor activity of liposomal STS at a low systemic dose with no apparent toxicity. The compound was not cleared before a therapeutic effect could be induced, and biodistribution data revealed preferential tumor accumulation. Moreover, we developed an efficient method for liposomal STS encapsulation, which may also be effective for other drug chemotypes. The present report provides the basis for pursuing comprehensive preclinical studies on the efficacy, pharmacokinetics, biodistribution, and toxicology of a range of encapsulated STS doses for solid tumor therapy.
Acknowledgments
The authors wish to thank Santosh Aryal for technical assistance with the scanning electron microscopy imaging and HPLC, Sara Weis for technical assistance with confocal imaging, and Matthew Gallagher and Gabi Gomez for technical assistance in the laboratory. We also thank Lori Davis for her excellent editorial and proofreading assistance. This work was supported in part by grants from the National Institutes of Health (NIH 3P30CA023100-25S8) and the Tuttleman Family Foundation to SK, Department of Defense (Armey) IDEA Awared BC095376, NIH 5R21CA164BB0-02 to DS.
Supplementary materials
For physical characterization, the liposome suspension was diluted 1:10 in MilliQ water, phosphate-buffered saline, and 10 mM NaCl. A 100 μL aliquot was sized using light backscattering Zetasizer (ZEN 3600; Malvern Instruments, Malvern, UK, ). The same instrument measured particle net charge expressed in mV. Size and surface zeta potential were obtained from three repeat measurements with a backscattering angle of 173°. Liposome morphology and size were further characterized using scanning electron microscopy (Supplementary ). Samples were prepared by applying 5 μL droplets of the liposome suspension onto a polished silicon wafer. After drying the droplets at room temperature overnight, the wafer was coated with chromium, and then imaged on an XL-30 electron microscope (Philips, Eindhoven, the Netherlands) to 30,000×. Although transmission electron microscopy would be expected to provide more morphologic detail, the scanning electron microscopy images shown here do confirm the spherical morphology of the liposomes, and dynamic light scattering measurements indicated an approximately 110 nm average diameter. For cell viability studies, all cells from A172, U118, U251, GBM4, GBM8, PC3, MDA-MB-231, and B16F10 lines were grown in 96-well plates in complete medium with 10% fetal bovine serum at 37°C, and then either free drug or drug-loaded liposomes were added and the cells incubated for another 72 hours (Supplementary ). For liposomal staurosporine uptake and resultant cell morphology, U87 cells were labeled with green fluorescent protein and were plated onto 12-well plates. The cells were incubated with empty liposomes or staurosporine-loaded liposomes. All liposomes were formulated with BODIPY fluorescent labeling on the exterior lipid shell, and after incubation the cells were washed and imaged with a scanning confocal microscope (Nikon Corporation; Supplementary ).
Figure S1 Characterization of staurosporine liposomes by DLS and SEM. (A) Size (diameter, nm) of staurosporine liposomes measured by differential light scattering (DLS). (B) Representative scanning transmission electron microscope (SEM) images showing the structure of staurosporine liposomes.
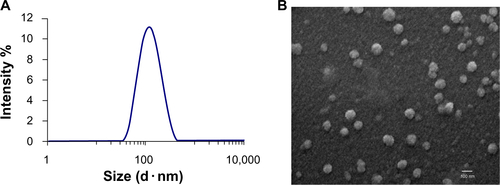
Figure S2 Graphs A–G depict staurosporine effects on viability (MTT assay) of the glioblastoma cell lines U118 (A), U251 (B), A172 (C), GBM4 (D), GBM8 (E) PC3 prostate tumor (F), and MDA-MB-231 breast tumor (G). Experiments were performed in triplicate and the mean ± standard error of the mean is indicated.
Abbreviations: conc, concentration; Lipo, liposomal; MTT, (3-(4,5-dimethylthiazol-2-yl)-2,5-diphenyltetrazolium bromide.
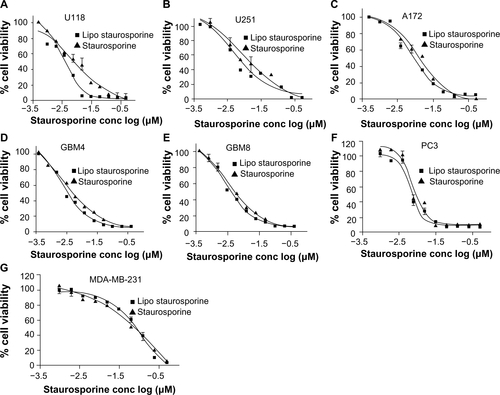
Figure S3 Liposomal uptake and morphological changes in U87 cells stably expressing GFP (green). Panel A is a brightfield image of the cells incubated with empty liposomes conjugated with fluorescent dye (BODIPY – red). Panel B shows these cells confocal imaged in the green channel (upper) and the red channel (lower). Panel C is a merge of green and red acquisitions and the arrows point to cells that clearly contain BODIPY labeled liposomes. Panel D is a brightfield image of U87 cells incubated with liposomes containing staurosporine. Note the rounded cells (arrows) which is consistent with apoptosis. Panel E shows the green and red channel acquisitions. Panel F is the merge. Note again the labeled liposomes are clearly inside the cells (arrows). In all images the white bars indicate 20 μM.
Abbreviations: GFP, green fluorescent protein; BODIPY, boron-dipyrromethene.
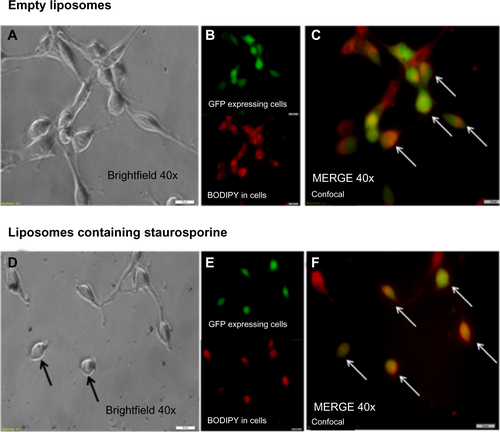
Table S1 The size and zeta potential of the staurosporine liposomal particles in PBS (saline) and water measured by laser light scattering using a Malvern Zetasizer (Malvern Instruments, Malvern, UK) as described in the text
Disclosure
The authors report no conflicts of interest in this work.
References
- TamaokiTNomotoHTakahashiIKatoYMorimotoMTomitaFStaurosporine, a potent inhibitor of phospholipid/Ca++dependent protein kinaseBiochem Biophys Res Commun198613523974023457562
- ZhangXDGillespieSKHerseyPStaurosporine induces apoptosis of melanoma by both caspase-dependent and -independent apoptotic pathwaysMol Cancer Ther20043218719714985459
- SchwartzGKRedwoodSMOhnumaTHollandJFDrollerMJLiuBCInhibition of invasion of invasive human bladder carcinoma cells by protein kinase C inhibitor staurosporineJ Natl Cancer Inst19908222175317562231770
- TangDLahtiJMKiddVJCaspase-8 activation and bid cleavage contribute to MCF7 cellular execution in a caspase-3-dependent manner during staurosporine-mediated apoptosisJ Biol Chem2000275139303930710734071
- BaltuchGHDooleyNPCouldwellWTYongVWStaurosporine differentially inhibits glioma versus non-glioma cell linesJ Neurooncol19931621411478289091
- FuseETaniiHKurataNUnpredicted clinical pharmacology of UCN-01 caused by specific binding to human alpha1-acid glycoproteinCancer Res19985815324832539699650
- AkinagaSGomiKMorimotoMTamaokiTOkabeMAntitumor activity of UCN-01, a selective inhibitor of protein kinase C, in murine and human tumor modelsCancer Res19915118488848921893379
- GurleyLRUmbargerKOKimJMBradburyEMLehnertBEStaurosporine Analysis and its Pharmacokinetics in the Blood of RatsLos Alamos, NMLos Alamos National Laboratory1994
- GescherAAnalogs of staurosporine: potential anticancer drugs?Gen Pharmacol19983157217289809468
- JarvisWDGrantSProtein kinase C targeting in antineoplastic treatment strategiesInvest New Drugs199917322724010665476
- TestaJRBellacosaAAKT plays a central role in tumorigenesisProc Natl Acad Sci U S A20019820109831098511572954
- VivancoISawyersCLThe phosphatidylinositol 3-Kinase AKT pathway in human cancerNat Rev Cancer20022748950112094235
- SatoSFujitaNTsuruoTInterference with PDK1-Akt survival signaling pathway by UCN-01 (7-hydroxystaurosporine)Oncogene200221111727173811896604
- BaldwinRMParolinDALorimerIARegulation of glioblastoma cell invasion by PKC iota and RhoBOncogene200827253587359518212741
- LawrieAMNobleMETunnahPBrownNRJohnsonLNEndicottJAProtein kinase inhibition by staurosporine revealed in details of the molecular interaction with CDK2Nat Struct Biol19974107968019334743
- FriedmanBFujikiHRosnerMRRegulation of the epidermal growth factor receptor by growth-modulating agents: effects of staurosporine, a protein kinase inhibitorCancer Res19905035335381688732
- da RochaABMansDRRegnerASchwartsmannGTargeting protein kinase C: new therapeutic opportunities against high-grade malignant gliomas?Oncologist200271173311854544
- FischerUJänickeRUSchulze-OsthoffKMany cuts to ruin: a comprehensive update of caspase substratesCell Death Differ20031017610012655297
- PorterAGJänickeRUEmerging roles of caspase-3 in apoptosisCell Death Differ1999629910410200555
- AffarEBGermainMWinstallECaspase-3-mediated processing of poly(ADP-ribose) glycohydrolase during apoptosisJ Biol Chem200127642935294211053413
- DrummondDCMeyerOHongKKirpotinDBPapahadjopoulosDOptimizing liposomes for delivery of chemotherapeutic agents to solid tumorsPharmacol Rev199951469174310581328
- AllenTMCullisPRDrug delivery systems: entering the mainstreamScience200430356651818182215031496
- GabizonACataneRUzielyBProlonged circulation time and enhanced accumulation in malignant exudates of doxorubicin encapsulated in polyethylene-glycol coated liposomesCancer Res19945449879928313389
- GabizonAAStealth liposomes and tumor targeting: one step further in the quest for the magic bulletClin Cancer Res20017222322511234871
- WangAZLangerRFarokhzadOCNanoparticle delivery of cancer drugsAnnu Rev Med20126318519821888516
- RuoslahtiESpecialization of tumour vasculatureNat Rev Cancer200222839012635171
- BrownJMGiacciaAJThe unique physiology of solid tumors: opportunities (and problems) for cancer therapyCancer Res1998587140814169537241
- TschaikowskyKProtein kinase C inhibitors suppress LPS-induced TNF production in alveolar macrophages and in whole blood: the role of encapsulation into liposomesBiochim Biophys Acta1994122211131218186258
- YamauchiMKusanoHNakakuraMKatoYReducing the impact of binding of UCN-01 to human alpha1-acid glycoprotein by encapsulation in liposomesBiol Pharm Bull20052871259126415997110
- YostSEPastorinoSRozenzhakSHigh-resolution mutational profiling suggests the genetic validity of glioblastoma patient-derived pre-clinical modelsPLoS One201382e5618523441165
- MurphyEAMajetiBKMukthavaramRAcevedoLMBarnesLAChereshDATargeted nanogels: a versatile platform for drug delivery to tumorsMol Cancer Ther201110697298221518727
- HewavitharanaAKShawPNNgYKFuerstJASimple screening method for staurosporine in bacterial cultures using liquid chromatography-tandem mass spectrometryJ Bioanal Biomed200911001004
- GurleyLRUmbargerKOKimJMBradburyEMLehnertBEDevelopment of a high-performance liquid chromatographic method for the analysis of staurosporineJ Chromatogr B Biomed Appl199567011251387493070
- CharroisGJAllenTMDrug release rate influences the pharmacokinetics, biodistribution, therapeutic activity, and toxicity of pegylated liposomal doxorubicin formulations in murine breast cancerBiochim Biophys Acta200416631–216717715157619
- KurataNKuramitsuTTaniiHDevelopment of a highly sensitive high-performance liquid chromatographic method for measuring an anticancer drug, UCN-01, in human plasma or urineJ Chromatogr B Biomed Sci Appl19987081–22232279653966
- WakimotoHKesariSFarrellCJHuman glioblastoma-derived cancer stem cells: establishment of invasive glioma models and treatment with oncolytic herpes simplex virus vectorsCancer Res20096983472348119351838
- RajeshMSenJSrujanMMukherjeeKSreedharBChaudhuriADramatic influence of the orientation of linker between hydrophilic and hydrophobic lipid moiety in liposomal gene deliveryJ Am Chem Soc200712937114081142017718562
- PageBPageMNoelCA new fluorometric assay for cytotoxicity measurements in-vitroInt J Oncol19933347347621573387
- JensenMMJørgensenJTBinderupTKjaerATumor volume in subcutaneous mouse xenografts measured by microCT is more accurate and reproducible than determined by 18F-FDG-microPET or external caliperBMC Med Imaging200881618925932
- GurleyLRUmbargerKOKimJMBradburyEMLehnertBEHigh-performance liquid chromatographic analysis of staurosporine in vivo. Its translocation and pharmacokinetics in ratsJ Chromatogr B Biomed Sci Appl19987121–22112249698244
- FuseETaniiHTakaiKAltered pharmacokinetics of a novel anticancer drug, UCN-01, caused by specific high affinity binding to alpha1-acid glycoprotein in humansCancer Res19995951054106010070963
- HoffmanWPNessDKvan LierRBAnalysis of rodent growth data in toxicology studiesToxicol Sci200266231331911896298
- ClarkeSJFarrugiaDCAherneGWPritchardDMBensteadJJackmanALBalb/c mice as a preclinical model for raltitrexed-induced gastrointestinal toxicityClin Cancer Res20006128529610656460
- IwamotoHTorimuraTNakamuraTMetronomic S-1 chemotherapy and vandetanib: an efficacious and nontoxic treatment for hepatocellular carcinomaNeoplasia201113318719721390182
- ChangHIYehMKClinical development of liposome-based drugs: formulation, characterization, and therapeutic efficacyInt J Nanomedicine20127496022275822
- AndersonMOmriAThe effect of different lipid components on the in vitro stability and release kinetics of liposome formulationsDrug Deliv2004111333915168789
- ChangFLeeJTNavolanicPMInvolvement of PI3 K/Akt pathway in cell cycle progression, apoptosis, and neoplastic transformation: a target for cancer chemotherapyLeukemia200317359060312646949
- MayoLDDonnerDBA phosphatidylinositol 3-kinase/Akt pathway promotes translocation of Mdm2 from the cytoplasm to the nucleusProc Natl Acad Sci U S A20019820115981160311504915
- MurphyEAMajetiBKBarnesLANanoparticle-mediated drug delivery to tumor vasculature suppresses metastasisProc Natl Acad Sci U S A2008105279343934818607000
- TschaikowskyKBrainJDStaurosporine encapsulated into pH-sensitive liposomes reduces tnf production and increases survival in rat endotoxin shockShock1994164014077735968
- MunsonJMFriedLRowsonSAAnti-invasive adjuvant therapy with imipramine blue enhances chemotherapeutic efficacy against gliomaSci Transl Med20124127127ra36
- DrummondDCNobleCOGuoZHongKParkJWKirpotinDBDevelopment of a highly active nanoliposomal irinotecan using a novel intraliposomal stabilization strategyCancer Res20066663271327716540680
- StensrudGSandeSAKristensenSSmistadGFormulation and characterisation of primaquine loaded liposomes prepared by a pH gradient using experimental designInt J Pharm2000198221322810767570
- NiuGCogburnBHughesJPreparation and characterization of doxorubicin liposomesMethods Mol Biol201062421121920217598
- SadzukaYTakabeHSonobeTLiposomalization of SN-38 as active metabolite of CPT-11J Control Release20051082–345345916182400
- FernandesASGonçalvesAPCastroAModulation of fungal sensitivity to staurosporine by targeting proteins identified by transcriptional profilingFungal Genet Biol201148121130113822001288