
 ?Mathematical formulae have been encoded as MathML and are displayed in this HTML version using MathJax in order to improve their display. Uncheck the box to turn MathJax off. This feature requires Javascript. Click on a formula to zoom.
Abstract
Superparamagnetic iron oxide nanoparticles are candidate contrast agents for magnetic resonance imaging and targeted drug delivery. Biodistribution and toxicity assessment are critical for the development of nanoparticle-based drugs, because of nanoparticle-enhanced biological reactivity. Here, we investigated the uptake, in vivo biodistribution, and in vitro and in vivo potential toxicity of manganese ferrite (MnFe2O4) nanoparticles, synthesized by an original high-yield, low-cost mechanochemical process. Cultures of murine Balb/3T3 fibroblasts were exposed for 24, 48, or 72 hours to increasing ferrofluid concentrations. Nanoparticle cellular uptake was assessed by flow-cytometry scatter-light measurements and microscopy imaging after Prussian blue staining; cytotoxicity was evaluated by 3-(4,5-dimethylthiazol-2-yl)-2,5-diphenyltetrazolium bromide (MTT) and colony-forming assays. After a single intravenous injection, in vivo nanoparticle biodistribution and clearance were evaluated in mice by Mn spectrophotometric determination and Prussian blue staining in the liver, kidneys, spleen, and brain at different posttreatment times up to 21 days. The same organs were analyzed for any possible histopathological change. The in vitro study demonstrated dose-dependent nanoparticle uptake and statistically significant cytotoxic effects from a concentration of 50 μg/mL for the MTT assay and 20 μg/mL for the colony-forming assay. Significant increases in Mn concentrations were detected in all analyzed organs, peaking at 6 hours after injection and then gradually declining. Clearance appeared complete at 7 days in the kidneys, spleen, and brain, whereas in the liver Mn levels remained statistically higher than in vehicle-treated mice up to 3 weeks postinjection. No evidence of irreversible histopathological damage to any of the tested organs was observed. A comparison of the lowest in vitro toxic concentration with the intravenously injected dose and the administered dose of other ferrofluid drugs currently in clinical practice suggests that there might be sufficient safety margins for further development of our formulation.
Introduction
In the last decade, many nanoparticle-based therapeutics have entered the pharmaceutical pipeline to improve the efficacy and reduce the systemic toxicity of a wide range of drugs. In fact, nanoparticle chemical and physical properties, such as shape, size, magnetic behavior, surface charge, and functionalization can be engineered to modulate pharmacokinetics, biodistribution, diffusivity through the extracellular matrix, and interaction at cellular and subcellular levels. Therefore, nanotherapeutics are being exploited to potentially overcome biological barriers, deliver hydrophobic drugs at preferential target sites of disease, or prepare formulations of unstable (eg, small interfering ribonucleic acid) and/or highly toxic drugs.Citation1–Citation3
Superparamagnetic iron oxide nanoparticles offer attractive possibilities for the improvement of site-specific drug delivery, thanks to their transportation to targeted areas by an external magnetic field.Citation4–Citation6 They have also been proposed for the enhancement of magnetic resonance imaging contrast in cancer detection,Citation7 which could be coupled with localized hyperthermia treatments in the so-called theragnostic approach.Citation8,Citation9 Despite these potential advantages, only a relatively small number of nanoparticles with iron cores have been approved for clinical use.Citation10,Citation11 In 1996, the US Food and Drug Administration approved ferumoxides as the first nanoparticle-based iron oxide imaging agents for the detection of liver lesions. Ferucarbotran was the second clinically approved superparamagnetic iron oxide developed for contrast-enhanced magnetic resonance imaging of the liver.Citation12 Ferumoxtran-10 has been used to image occult prostate cancer lymph-node metastases in humans. Ferumoxytol has been approved to treat iron-deficiency anemia in adult patients with chronic kidney disease, and is under clinical investigation for the detection of central nervous system inflammation, brain tumors, and cerebral metastases from lung or breast cancer. New magnetic particles and methods of synthesis and coating, with potentially improved performance, are continuously being developed.Citation13,Citation14 Superparamagnetic manganese ferrite (MnFe2O4) nanoparticles are particularly attractive as candidate contrast agents for magnetic resonance imaging, because of a very high magnetization due to their large magnetic spin.Citation15,Citation16 Since a fundamental aspect of drug development is the trade-off evaluation of risks and benefits, a parallel toxicological assessment of these new medical devices is in progress, especially in view of the possible specific biological reactivity of nanosized materials that has recently been emerging.Citation17 Until now, few data have been published. No significant induction of cytotoxicity was shown on HeLa cells treated with tetraethylene glycol stabilized nanoparticles up to a concentration of 200 μg/mL.Citation16 The surface charge of water-soluble manganese ferrite nanoparticles was shown to influence their uptake and toxicity on murine macrophages, with cationic particles being more biologically reactive.Citation18
Recently, we proposed a high-yield, low-cost mechanochemical process to synthesize manganese ferrite (MnFe2O4) nanoparticles, which were subsequently functionalized with citric acid and stabilized in ferrofluid form. Transmission electron microscopy (TEM) micrographs of manganese iron oxide nanoparticles show a powder constituted of unisolated particles having a mean diameter of 7.6 nm. Scanning electron microscopy analysis of the nanoparticles functionalized with citric acid shows significant agglomeration phenomena, and when dispersed in ferrofluid form, the average particle hydrodynamic diameter is about 60 nm. Complete characterization of the developed ferrofluid was reported in a previously published article.Citation19
To explore the ferrofluid prospects for biomedical application, we set up the study described in the present paper to investigate its biodistribution and organ-specific toxicity in vivo after intravenous administration in mice. In addition, the induction of cytotoxicity was evaluated in vitro as a function of dose and time of treatment.
Materials and methods
Synthesis and characterization of nanoparticles and ferrofluid
A stable aqueous ferrofluid consisting of manganese ferrite nanoparticles functionalized with citric acid was prepared as previously reported.Citation19 In brief, hydrated manganese ferrite nanoparticles with a mean particle size of about 8 nm were prepared by an unconventional bottom-up high-energy ball-milling method starting from manganese chloride tetrahydrate (MnCl2 · 4H2O), ferric chloride hexahydrate (FeCl3 · 6H2O), and sodium hydroxide (NaOH) in the presence of sodium chloride (NaCl), which was used as a dispersing agent.
The produced nanoparticles were functionalized with citric acid, stirring (90 minutes at 80°C under argon flow) an aqueous suspension of manganese ferrite powder in citric acid water solution at pH 5.2. The resulting oxide–citric acid nanocomposite contained 19±2 wt% of bounded organic compound, and had an equivalent diameter of ~52 nm. The functionalized nanopowder was dispersed in water at pH 7.4, obtaining a final concentration of ~3.8 mg/mL, a hydrodynamic diameter of 59±5 nm and a ζ-value of −37 mV. Physical and chemical characterization of the produced samples was performed according to methods reported in a previous article.Citation19 Structural characterization of the obtained materials was performed by powder diffractometry. A Seifert X3000 diffractometer (GE Measurement and Control, Billerica, MA, USA), equipped with CuKα radiation, was utilized to collect X-ray diffraction data. The organic fraction of the nanoparticles after functionalization was estimated by elemental analysis, measuring C, N, and H content (EA 1110 analyzer; Carlo Erba Reagents, Milan, Italy). Particle morphology was examined by electron microscopy (JEOL [Tokyo, Japan] 200X TEM and LEO 130 HRSEM [LEO Electron Microscopy, Oberkochen, Germany]) and surface area was obtained by N2 adsorption at 77 K (Nova 2200 surface-area analyzer; Quantachrome Instruments, Boynton Beach, FL, USA). Zeta potential and average hydrodynamic radius were measured on liquid dispersions by using a Zetasizer Nano ZS (Malvern Instruments, Malvern, UK) dynamic light-scattering and zeta-potential analyzer.
In vitro cytotoxicity assessment
The cytotoxic potential of the ferrofluid was investigated in the murine Balb/3T3 fibroblast cell line (American Type Culture Collection, Rockville, MD, USA), which is a validated cell-type model for in vitro cytotoxicity assessment, and is sensitive to metal compounds and nanoparticles.Citation20–Citation22
Two cytotoxicity assays were used: a 3-(4, 5-dimethylthiazol-2-yl)-2,5-diphenyltetrazolium bromide (MTT) assay and a colony-forming assay (CFA). Balb/3T3 cells were characterized for an average duplication time of 24 hours. Concentrations of 5, 10, 20, 50, and 100 μg/mL were tested. These concentrations correspond to 35, 70, 140, 350, and 700 μmol/L of Fe and half these values of Mn.
Intracellular nanoparticle uptake was investigated by flow-cytometry light-scatter measurements and microscopy imaging after Prussian blue staining. In brief, cells resuspended in medium were analyzed by a FACScalibur equipped with an air-cooled argon ion-excitation laser (488 nm) (BD Biosciences, San Jose, CA, USA). The side and forward light-scatter parameters were logarithmically and linearly set up, respectively. The amounts of particles taken up by the cells were estimated by side-scatter geometric mean peak-intensity changes measuring intracellular optical density variation, ie, cytoplasm refractive index.Citation23,Citation24 Data were analyzed by FlowJo software (TreeStar, Ashland, OR, USA). For Prussian blue staining, cells were fixed in 70% cold ethanol and stored overnight at −20°C. The following day, they were cytospun (Shandon CytoSpin® 2; Thermo Fisher Scientific, Waltham, MA, USA) onto microscope slides and stained with Prussian blue (5% potassium ferrocyanide: 5% hydrochloric acid, 1:1) at room temperature for 30 minutes.
MTT assay
The MTT assay allows the assessment of cytotoxic effects by impairment of the metabolic capability of the treated cell population relative to untreated controls.Citation25 In metabolically active cells, the yellow MTT is reduced by dehydrogenase enzymes to insoluble purple formazan dye crystals. After cell lysing, the intracellular crystals are solubilized, and the absorbance is quantified using a spectrophotometer microplate reader.
Subconfluent Balb/3T3 fibroblasts were cultured in 75 mL flasks in a humidified atmosphere of 5% CO2 at 37°C in high-glucose Dulbecco’s Modified Eagle’s Medium (DMEM; Sigma-Aldrich, St Louis, MO, USA) supplemented with 10% calf serum (Sigma-Aldrich), 1% L-glutamine (200 mM), 1% penicillin (10,000 IU/mL), and 1% streptomycin (10 mg/mL).
For the MTT assay, Balb/3T3 cells were seeded into a 96-well plate, and cultured for 24 hours (20×103 cells in 200 μL DMEM per well) before treatment. After sonication of the ferrofluid for 20 minutes, the cells were incubated with nanoparticles at defined concentrations for 24 or 48 hours. Four replicate wells were incubated for each concentration. In addition, six replicate wells were seeded with untreated control and six with 0.75 mM H2O2-exposed cells to serve as negative and positive controls, respectively.
After incubation, the medium was discarded and 200 μL fresh medium added per well after thorough washing with sterile phosphate-buffered saline. Twenty microliters of 5 mg/mL stock MTT reagent (Sigma-Aldrich) was then added per well, and the plate was left for 3 hours at 37°C in an incubator. Thereafter, the medium was discarded, and formazan crystals were solubilized by 45 minutes’ incubation in 200 μL of the solubilization buffer (10% sodium dodecyl sulfate, 0.01 M HCl in isobutylic alcohol). Readings were then taken on a VICTOR™ X3 multilabel plate reader (PerkinElmer, Waltham, MA, USA) at 550 nm, with background plate-absorbance subtraction at 690 nm. Percentage cell viability was calculated according to the following normalization equation:
where OD is optical density of the sample, control, or background at 550 or 690 nm.
Two independent experiments were carried out, for a total of eight repeats for each ferrofluid concentration and 12 repeats for the controls. All the results were expressed as means ± standard deviation, and were shown as cell-viability percentages in comparison with the control cells, which were considered 100% viable.
Colony-forming assay
The CFA is an in vitro cell-viability assay based on the ability of cells to survive after treatment with chemical or physical agents, retaining the ability to proliferate until the production of a visible colony.Citation26 This assay has been especially endorsed for testing nanoparticle toxicity, since it is not based on the detection of a colored reaction product, which in some cases has been demonstrated to interact with the nanomaterials tested, thus leading to invalid results.Citation27,Citation28
Cells from an exponentially growing culture were harvested by trypsin, counted, and then seeded in 60 mm petri dishes with 3 mL of culture medium at a density of 200 cells/dish. This cell number was sufficient to yield at least 100 colonies in the unexposed controls based on Balb/3T3 cell line-plating efficiency. The culture dishes were incubated at 37°C in humidified 95% air at 5% CO2 atmosphere. The cells were allowed to attach for about 20 hours, shorter than the 24-hour doubling time, which led us to assume that predominantly single cells were present at the time of exposure. Thereafter, culture medium was replaced with the ferrofluid solution at defined concentrations, and cells were exposed for 72 hours. After this time, the medium was replaced with complete fresh culture medium, and the plates were incubated at 37°C for an additional 6 days. Unexposed control cultures were processed in parallel. Cells were then fixed with methanol:acetic acid 3:1 and stained with 7% Giemsa solution. Colonies (>50 cells/colony) were manually counted under a stereomicroscope. The cytotoxic effect was measured as a decrease in the number of colonies formed after treatment compared to that of untreated controls.Citation29 Three independent experiments were performed in triplicate for each control and concentration point. The results were normalized to the untreated control and expressed in terms of surviving fraction ([average number of treated colonies/average number of control colonies] ×100).
In vivo biodistribution and toxicity assessment
We administered the ferrofluid at the highest achievable dose considering the upper-limit nanocomposite concentration and the maximum tolerated volume for intravenous injection in mice (~200 μL). The tested dose (150 μmol/kg of Fe) was ten times higher than that used in clinical practice for magnetic resonance imaging (ie, 15 μmol/kg of Fe for Endorem®, Guerbet, Paris, France).
All mouse experimental procedures were carried out according to the Italian legislation on animal experimentation and reviewed by the internal Institutional Animal Care and Use Committee (IACUC). The issue of sex influence on the biodistribution and toxicity of nanoparticles is debated, with some papers showing and some others not showing differences between males and females.Citation30,Citation31 In accordance with the IACUC, taking into account the “3-R” principles of animal welfare (reduction, refinement, replacement), it was decided to conduct the experiments on one sex only.
CD1 female mice (8 weeks old, n=24) were injected through the tail vein with 150 μmol/kg Fe/kg body weight of the ferrofluid suspension; a group of age-matched mice was injected with vehicle (H2O) and used as controls. Possible extravenous injection of the ferrofluid was checked by careful monitoring of the mice at the injection site immediately after injection and in the following days to exclude local blanching or tissue necrosis. At 6 hours, 24 hours, 7 days, and 21 days after the treatment (n=6 for each point) mice were deeply anesthetized with an intraperitoneal injection of 65 mg/kg pentobarbital, then allocated to two different groups (n=3 for each experimental time), in order to investigate: 1) the ferrofluid biodistribution by measurement of the manganese levels in various organs (liver, spleen, kidneys, brain), and 2) the possible histopathological changes in the same organs.
Quantification of manganese levels
To estimate the ferrofluid biodistribution and clearance, manganese levels were measured by inductively coupled plasma mass spectrometry (ICP-MS), because the endogenous iron level made iron determination a less sensitive approach to detect increases above each organ-specific background.
At the selected time points, after transcardiac perfusion with 5 mL of 0.9% NaCl solution, tissues were collected, weighed, and immediately frozen in liquid nitrogen to be maintained at −80°C until the time of analysis. Tissue samples were homogenized with an Ultra-Turrax homogenizer T25 equipped with an S25 N-18G disperser (IKA, Staufen, Germany) in nitrogen-purged distilled water (~20% tissue wet weight) in an ice bath. The total volume of each homogenate was measured. To determine manganese levels, 1 mL of each tissue homogenate was lyophilized in a test tube for 2 days at −60°C and 7 μmHg vacuum in a Modulyo 4K freeze dryer (Edwards High Vacuum International, Crawley, UK); the weight of the tissue was determined by comparing the difference in weight of the empty tubes and that after lyophilization of the tissue.
For dissolution of the organic samples, 0.5 mL of 69% HNO3 Hyperpure (Panreac Quimica, Barcelona, Spain) + 2 mL of 30% hydrogen peroxide Suprapur® (Merck, Darmstadt, Germany) were used. Ultrapure water (18.2 MΩ/cm at 25°C), obtained from a Milli-Q Element system (Merck), was used for dilution and preparation of standard manganese solutions. Single ICP standard solutions (Aristar BDH®; VWR, Radnor, PA, USA) for Mn 1,000 mg/L in nitric acid were used to prepare the calibrating solutions.
Four samples of each organ underwent the dissolution procedure. In particular, an aliquot of the lyophilized organ, exactly weighed, was placed in a 50 mL polypropylene tube and 5 mL of HNO3 was carefully added. Each sample was left to react for about 1 hour. Then, after adding 2 mL of H2O2, the sample was placed in a bath at 60°C for about 2 hours and subsequently cooled to room temperature. To each perfectly solubilized sample, deionized water was added up to a total volume of 50 mL. The solution was filtered through a 0.45 μm cellulose membrane filter and stored at 4°C until analysis.
The solutions were diluted 1:1 with ultrapure water for the ICP-MS analysis. Accuracy and analytical precision were assessed using a reference material (bovine muscle powder, RM 8414; National Institute of Standards and Technology, Ottawa, ON, Canada). All measurements of Mn concentrations were performed using a PerkinElmer ELAN 6100 ICP-MS spectrometer equipped with a Scott-type spray chamber.
Histopathological analysis
The mice were killed at the indicated time points, and their organs were removed for histological study. The samples were immediately fixed with 10% buffered formalin. After rinsing with phosphate-buffered saline, the formalin-fixed samples were dehydrated with a graded ethanol series and embedded in paraffin wax. Sections of the right lobe of the liver and spleen were cut in the axial plane; sections from the kidney and brain were cut in the coronal plane. Sections (4 μm thick) were analyzed after staining with hematoxylin and eosin, and examined for any sign of histological impairment using a light microscope. Prussian blue staining was also used to observe the distribution of iron in the tissues. The Prussian blue dye contained 10% potassium ferrocyanide and 20% hydrochloric acid, and was carried out on sections according to the protocol indicated by IHC World (http://www.ihcworld.com).
Statistical analysis
Statistical analysis of the differences between values of treated and untreated samples was performed by unpaired Student’s t-test. Differences were considered statistically significant when their probability was less than 0.05.
Results and discussion
In vitro cytotoxicity assessment
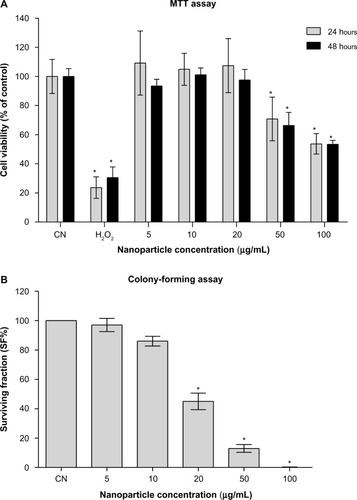
The nanoparticle-uptake capability of Balb/3T3 cells has been demonstrated, among others, for amorphous silica nanoparticlesCitation32 and cobalt nanoparticles,Citation33 likely by an endocytosis mechanism, suggesting that the cell line is a suitable model for nanotoxicology evaluations. The observations after Prussian blue staining () showed that Balb/3T3 fibroblasts internalized the iron oxide nanoparticles and the flow-cytometric light-scatter data (), confirming a trend of increased uptake at increasing exposure concentrations. Only at the highest-tested concentration did the uptake appear to increase between 24 and 48 hours of exposure, suggesting that mechanisms of uptake could be dynamic and influenced by the ferrofluid concentration itself. The results of the MTT assay () showed that cell viability was significantly decreased at the ferrofluid concentrations of 50 and 100 μg/mL, with a dose-dependent response, not significantly different between 24- and 48-hour exposures. Therefore, apparently, the further nanoparticle uptake detected between 24- and 48-hour exposures to 100 μg/mL did not aggravate the cytotoxicity induced by 24-hour exposure. As expected, the positive control treatment with H2O2 induced a marked reduction of cell viability at both treatment times. The CFA () showed that cell proliferation was significantly and dose-dependently impaired starting from the 20 μg/mL concentration. The higher CFA sensitivity could be partly due to longer exposure (72 hour), but it should be noted that even when the treatment time was the same, the CFA was shown to be more sensitive than the MTT assay.Citation34 The use of a battery of tests to evaluate the in vitro cytotoxicity of engineered nanoparticles has been endorsed.Citation22 The combination of MTT and CFA, which evaluate cell survival by different endpoints, namely metabolic competence and proliferating capacity, is particularly suitable.
Figure 1 (A and B) Evaluation of in vitro nanoparticle uptake. (A) Prussian blue staining of Balb/3T3 cells treated for 48 hours with the manganese ferrite nanofluid at the indicated concentrations. (B) Flow-cytometric analysis of dose- and time-dependent changes of side-scattered light in the nanofluid-exposed Balb/3T3 cells. Bar 20 μm.
Abbreviations: SSC, side scatter; FCM, flow cytometry; CN, untreated controls; NP, nanoparticle.
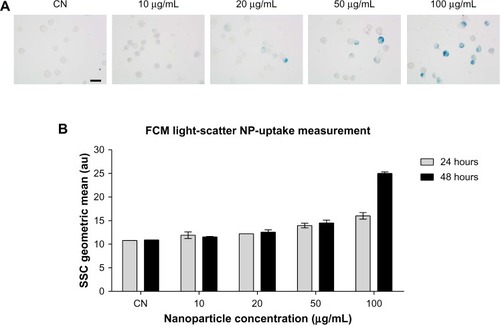
Figure 2 (A and B) Evaluation of in vitro cytotoxicity. (A) Results of the MTT assay: means ± SD of data normalized to untreated controls from eight measurements for each nanofluid concentration and 12 measurements for the untreated (CN) and H2O2-treated controls are shown. (B) Results of the colony-forming assay: mean ± SD of data normalized to untreated controls from three independent experiments in triplicate are shown.
Note: *P<0.05 with respect to untreated controls.
Abbreviations: MTT, 3-(4,5-dimethylthiazol-2-yl)-2,5-diphenyltetrazolium bromide; SD, standard deviation.
In vivo biodistribution and toxicity assessment
After intravenous injection of the ferrofluid, the behavior of all the animals was normal over the entire observation period, suggesting that the nanoparticles did not induce overt in vivo toxicity. To obtain a quantitative dosage of nanoparticle uptake in different organs, the manganese concentrations in liver, spleen, kidneys, and brain at 6 hours, 24 hours, 7 days, and 21 days after intravenous injection were analyzed using ICP-MS.
In the liver (), manganese levels peaked at 6 hours, showing a fivefold average increase compared to vehicle-treated mice (P<0.0001). After 24 hours, a reduction of the peak down to 50% of the level measured at 6 hours was observed; then, the manganese levels gradually declined over the next 3 weeks. However, at all data points analyzed, manganese levels remained significantly higher than in the vehicle-treated mice, suggesting that more than 3 weeks is required for the liver to completely get rid of the nanoparticles.
Figure 3 (A–D) Quantitative determination of nanoparticles in the liver and histological evaluation. (A) Changes in Mn levels at 6 hours, 24 hours, 7 days, and 21 days after intravenous injection. Data are presented as means ± standard error of mean (n=6). (B) Representative images of liver sections stained with Prussian blue to detect iron deposits (arrows and arrowhead) in the tissue at each time point; bar 10 μm. (C) Images of liver sections stained with hematoxylin and eosin showing normal tissue architecture; bar 50 μm. (D) High magnification (bar 10 μm) of liver region around the central vein (indicated with the dashed box in (C) at each time point reveals hydropic swelling of hepatocytes, particularly at 6 hours after nanoparticle injection. This cellular phenomenon is completely reversible, as confirmed by the normal appearance of hepatocytes at longer experimental times.
Abbreviation: CN, vehicle-treated mice.
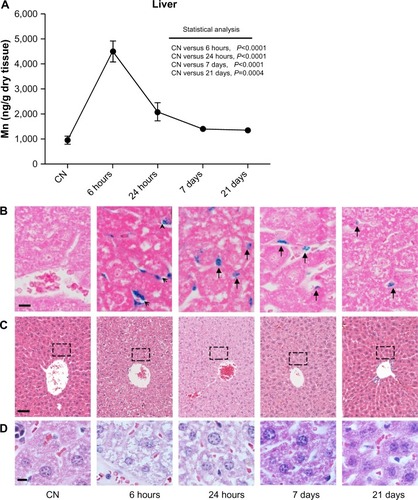
Prussian blue staining of histological sections was used to visually confirm ICP-MS data and to observe the tissue distribution of nanoparticles within a given organ. Prussian blue-stained liver sections () indicated that at 6 hours, the manganese ferrite nanoparticles were located in the liver sinusoids and the greatest quantity had already passed through the layer of endothelial cells. After 24 hours, virtually the totality of iron particles were phagocytosed by Kupffer cells inside the sinusoids. At longer experimental times (7 and 21 days), only a small number of Kupffer cells still retained iron particles, in agreement with the kinetics based on manganese quantitative ICP-MS data. As expected, Prussian blue staining was undetectable in liver sections of vehicle-treated mice. From a histological point of view, liver sections from mice killed 6 hours after treatment with ferrofluid solution showed hydropic swelling of hepatocytes compared with their vehicle-treated counterparts. As shown in , hepatocytes, particularly around the central vein, were characterized by a large pale cytoplasm, containing small clear vacuoles, and a normally located nucleus. After 24 hours, the cellular swelling was already almost completely resolved, and at both the 7- and 21-day experimental points, no differences were observed between treated and vehicle-treated mouse livers. No change in cell morphology reflecting cell death (ie, apoptosis or necrosis) was observed at any examined experimental time. This pattern is typical of an acute, entirely reversible nonlethal cell injury.
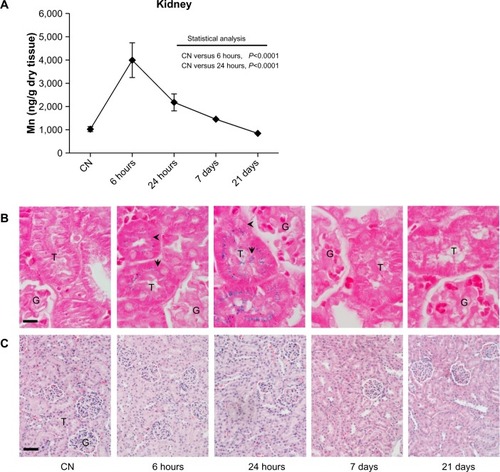
In , the biodistribution of manganese in the kidneys shows comparable kinetics to that observed in the liver, with a maximum peak measured after 6 hours and a halving of the amount after 24 hours. At longer experimental times, no statistically significant difference was observed in the manganese levels compared to the vehicle-treated mice. The Prussian blue staining of kidney sections () showed an expected absence of iron in the control group. On the contrary, cells were clearly labeled at both 6 and 24 hours after injection. Of note, despite the absence of iron labeling in the glomeruli at both experimental times, translocation phenomena were observed, with iron loading cortical tubules at 6 hours and exclusively medullary tubules at 24 hours. This biodistribution strongly supports the hypothesis of a rapid renal clearance, although it cannot be excluded that a quantity of nanoparticles may have undergone proximal tubule reabsorption. Microscopic examination of kidney sections did not show any apparent change in the cellular and tissue architecture compared to tissue from vehicle-treated mice.
Figure 4 (A–C) Quantitative determination of nanoparticles in the kidney and histological evaluation. (A) Time-dependent changes in Mn concentrations in kidney after the ferrofluid intravenous injection. Data are presented as means ± standard error of mean (n=6). (B) Prussian blue staining of kidney sections shows the presence of iron (arrow and arrowhead) exclusively at shorter experimental times. Translocation of iron from cortical (6 hours) to medullary (24 hours) tubules suggests a rapid renal clearance of injected nanoparticles; bar 10 μm. (C) Images of kidney sections stained with hematoxylin and eosin showing no relevant change in cellular and tissue architecture; bar 50 μm.
Abbreviations: G, glomerulus; T, tubule; CN, vehicle-treated mice.
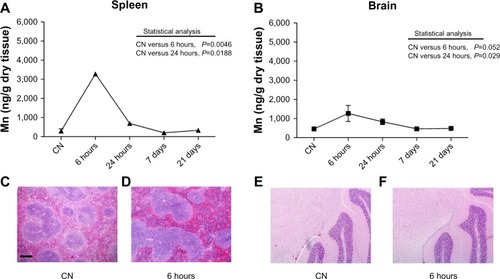
The quantitative analyses of manganese levels carried out in the spleen and brain showed a statistically significant increase of this metal after 6 and 24 hours after injection, with complete recovery of basal levels at the longer experimental times (). Due to the high quantity of iron normally present in the spleen and the very low levels of metal in the brain after injection, no information was extrapolated after Prussian blue staining in either organ. Anyway, from the histopathological point of view, no significant change was observed at any experimental time. Representative images of spleen and brain sections from mice killed 6 hours after treatment with ferrofluid solution compared to vehicle-treated mice are shown in –.
Figure 5 (A–F) Quantitative determination of nanoparticles in spleen and brain. Mn levels detected in (A) spleen and (B) brain. Data are presented as means ± standard error of mean (n=6). Images of spleen (C and D) and brain (E and F) sections stained with hematoxylin and eosin showing no histopathological change in the cellular and tissue architecture at 6 hours after nanoparticle injection compared to vehicle-treated mice (CN); bar 200 μm.
Conclusion
Biodistribution and toxicity assessment are critical for the development of nanoparticle-based drugs, because of nanoparticle-enhanced biological reactivity.Citation35 This study was undertaken to investigate the potential of a newly synthesized manganese iron oxide nanofluid for biomedical applications. The analysis of biodistribution demonstrated that after intravenous injection, the ferrofluid was taken up by different organs. Of note, the detection of ferrofluid in the brain showed that it crossed the blood–brain barrier, a critical limit for nanoparticle-based drug application. The safety assessment excluded irreversible organ toxicity in vivo up to 21 days after a single injection, confirming the biocompatibility of our formulation and supporting its potential use for magnetic resonance imaging contrast and targeted therapy. As usually recommended, parallel in vitro experiments were carried out under high-dose, long-term exposure conditions, not necessarily representative of likely in vivo exposure, to characterize the general level of toxicity of the test item. These experiments showed a dose-dependent reduction of cell viability starting from a concentration of 20 μg/mL. It is not uncommon that even when something is found to be toxic in vitro, it may not be so in vivo, and an overall biosafety assessment of the ferrofluid requires in vitro and in vivo results to be weighed up in terms of dose comparison. To compare in vitro and in vivo treatment doses, it can be roughly assumed that 1 kg body weight is equal to 1 L of culture medium. Therefore, our in vivo dose of 150 μmol/kg of Fe was about five times lower than the maximum-tested in vitro concentration (100 μg/mL of MnFe2O4, 700 μmol/L of Fe) and close to the lowest concentration (20 μg/mL of MnFe2O4, 140 μmol/L of Fe), eliciting some reduction in Balb/3T3 cell-proliferation capacity. Considering that i) our tested in vivo dose was about ten times higher than that currently used in clinical practice with other ferrofluid nanoformulations, and ii) in vitro toxicity was induced under 24–72 hours of continuous exposure, our results suggest that there might still be a sufficient safety margin for further development of our formulation. However, further studies are warranted to investigate mechanistic toxicity pathways and to evaluate in vivo toxicity of repeated injections to explore a prospective therapeutic application of the ferrofluid.
Acknowledgments
The authors are indebted to Drs Marco Vittori Antisari, Carmela Marino, Anna Saran, Eugenio Benvenuto, and Dario Della Sala for endorsing the research aims, and the staff efforts to achieve them. The research was supported by intramural financial resources.
Disclosure
The authors report no conflicts of interest in this work.
References
- EiflerACThaxtonCSNanoparticle therapeutics: FDA approval, clinical trials, regulatory pathways, and case studyMethods Mol Biol201172632533821424459
- ChengZAl ZakiAHuiJZMuzykantovVRTsourkasAMultifunctional nanoparticles: cost versus benefit of adding targeting and imaging capabilitiesScience2012338610990391023161990
- BijuVChemical modifications and bioconjugate reactions of nanomaterials for sensing, imaging, drug delivery and therapyChem Soc Rev201443374476424220322
- WangYXSuperparamagnetic iron oxide based MRI contrast agents: current status of clinical applicationQuant Imaging Med Surg201111354023256052
- TassaCShawSYWeisslederRDextran-coated iron oxide nanoparticles: a versatile platform for targeted molecular imaging, molecular diagnostics and therapyAcc Chem Res2011441084285221661727
- ReimerPBalzerTFerucarbotran (Resovist): a new clinically approved RES-specific contrast agent for contrast-enhanced MRI of the liver: properties, clinical development, and applicationsEur Radiol20031361266127612764641
- PankhurstAThanhNKJonesSKDobsonJProgress in applications of magnetic nanoparticles in biomedicineJ Phys D Appl Phys20094222224001
- YangHWHuaMYLiuHLHuangCYWeiKCPotential of magnetic nanoparticles for targeted drug deliveryNanotechnol Sci Appl201257686
- LingDHyeonTChemical design of biocompatible iron oxide nanoparticles for medical applicationsSmall201399–101450146623233377
- AdolphiNLButlerKSLovatoDMImaging of Her2-targeted magnetic nanoparticles for breast cancer detection: comparison of SQUID-detected magnetic relaxometry and MRIContrast Media Mol Imaging20127330831922539401
- ThiesenBJordanAClinical applications of magnetic nanoparticles for hyperthermiaInt J Hyperthermia200824646747418608593
- ThomasRParkIKJeongYYMagnetic iron oxide nanoparticles for multimodal imaging and therapy of cancerInt J Mol Sci2013148159101593023912234
- HyeonTChemical synthesis of magnetic nanoparticlesChem Commun (Camb)200321892793312744306
- SoenenSJDe CuyperMAssessing iron oxide nanoparticle toxicity in vitro: current status and future prospectsNanomedicine (Lond)2010581261127521039201
- LeeJHHuhYMJunYWArtificially engineered magnetic nanoparticles for ultra-sensitive molecular imagingNat Med2007131959917187073
- YangHZhangCShiXWater-soluble superparamagnetic manganese ferrite nanoparticles for magnetic resonance imagingBiomaterials201031133667367320144480
- PelazBCharronGPfeifferCInterfacing engineered nanoparticles with biological systems: anticipating adverse nano-bio interactionsSmall201399–101573158423112130
- YangSHHeoDParkJRole of surface charge in cytotoxicity of charged manganese ferrite nanoparticles towards macrophagesNanotechnology2012235050570223164999
- BellusciMAliottaCFioraniDManganese iron oxide superparamagnetic powder by mechanochemical processing. Nanoparticles functionalization and dispersion in a nanofluidJ Nanopart Res2012146904914
- MazzottiFSabbioniEGhianiMCoccoBCeccatelliRFortanerSIn vitro assessment of cytotoxicity and carcinogenic potential of chemicals: Evaluation of the cytotoxicity induced by 58 metal compounds in the BALB/3T3 cell lineAltern Lab Anim200129560161111604101
- WatahaJCHanksCTSunZEffect of cell line on in vitro metal ion cytotoxicityDent Mater19941031561617758857
- PontiJColognatoRRauscherHColony forming efficiency and microscopy analysis of multi-wall carbon nanotubes cell interactionToxicol Lett20101971293720435104
- SuzukiHToyookaTIbukiYSimple and easy method to evaluate uptake potential of nanoparticles in mammalian cells using a flow cytometric light scatter analysisEnviron Sci Technol20074183018302417533873
- TodukaYToyookaTIbukiYFlow cytometric evaluation of nanoparticles using side-scattered light and reactive oxygen species-mediated fluorescence-correlation with genotoxicityEnviron Sci Technol201246147629763622703531
- MosmannTRapid colorimetric assay for cellular growth and survival: application to proliferation and cytotoxicity assaysJ Immunol Methods1983651–255636606682
- FrankenNARodermondHMStapJHavemanJvan BreeCClonogenic assay of cells in vitroNat Protoc2006152315231917406473
- StoneVJohnstonHSchinsRPDevelopment of in vitro systems for nanotoxicology: methodological considerationsCrit Rev Toxicol200939761362619650720
- Monteiro-RiviereNAInmanAOZhangLWLimitations and relative utility of screening assays to assess engineered nanoparticles toxicity in a human cell lineToxicol Appl Pharmacol2009234222223518983864
- HillegassJMShuklaALathropSAMacPhersonMBFukagawaNKMossmanBTAssessing nanotoxicity in cells in vitroWiley Interdiscip Rev Nanomed Nanobiotechnol20102321923120063369
- PaekHJLeeYJChungHEModulation of the pharmacokinetics of zinc oxide nanoparticles and their fates in vivoNanoscale2013523114161142723912904
- ChenJWangHLongWSex differences in the toxicity of polyethylene glycol-coated gold nanoparticles in miceInt J Nanomedicine201382409241923861586
- UboldiCGiudettiGBroggiFGillilandDPontiJRossiFAmorphous silica nanoparticles do not induce cytotoxicity, cell transformation or genotoxicity in Balb/3T3 mouse fibroblastsMutat Res20127451–2112022094287
- SabbioniEFortanerSFarinaMInteraction with culture medium components, cellular uptake and intracellular distribution of cobalt nanoparticles, microparticles and ions in Balb/3T3 mouse fibroblastsNanotoxicology201481889923167736
- CeriottiLKobADrechslerSOnline monitoring of BALB/3T3 metabolism and adhesion with multiparametric chip-based systemAnal Biochem200737119210417709091
- JainTKReddyMKMoralesMALeslie-PeleckyDLLabhasetwarVBiodistribution, clearance and biocompatibility of iron oxide magnetic nanoparticles in ratsMol Pharm20085231632718217714