
Abstract
Photodynamic therapy is generally considered to be safer than conventional anticancer therapies, and it is effective against different kinds of cancer. However, its clinical application has been significantly limited by the hydrophobicity of photosensitizers. In this work, a system composed of the hydrophobic photosensitizer aluminum–phthalocyanine chloride (AlPc) associated with water dispersible poly(methyl vinyl ether-co-maleic anhydride) nanoparticles is described. AlPc was associated with nanoparticles produced by a method of solvent displacement. This system was analyzed for its physicochemical characteristics, and for its photodynamic activity in vitro in cancerous (murine mammary carcinoma cell lineage 4T1, and human mammary adenocarcinoma cells MCF-7) and noncancerous (murine fibroblast cell lineage NIH/3T3, and human mammary epithelial cell lineage MCF-10A) cell lines. Cell viability and the elicited mechanisms of cell death were evaluated after the application of photodynamic therapy. This system showed improved photophysical and photochemical properties in aqueous media in comparison to the free photosensitizer, and it was effective against cancerous cells in vitro.
Introduction
Photodynamic therapy (PDT) has been shown to be effective against different types of cancer.Citation1,Citation2 It is based on the combination of two separately innocuous components, light and a photosensitizer (PS), inside a biological target.Citation3 Basically, the target is first exposed to the PS and then irradiated with light at a wavelength intensely absorbed by the PS, but which is poorly absorbed by biological structures.Citation3–Citation5 Once the PS absorbs light, reaching an excited state, it can emit fluorescence or phosphorescence, it can react with different surrounding molecules, generating radicals – type 1 photoreaction – or it can catalyze the conversion of triplet oxygen (3O2) into singlet oxygen (1O2) – type 2 photoreaction.Citation3,Citation4 The oxidative burst generated by these photoreactions can induce stress and/or death by apoptosis or necrosis in the target cell.Citation6 However, despite the encouraging results obtained so far with anticancer PDT, an ideal PS has not been found.Citation1,Citation3,Citation7
The first-generation porphyrinoid PSs are the ones most used in clinical anticancer PDT. However, they present important drawbacks such as absorption of light at relatively short wavelengths, low extinction coefficients, and induction of prolonged skin photosensitization (1–2 months).Citation1,Citation7,Citation8 Improved, second-generation PSs have been developed over the last few decades.Citation1,Citation7,Citation8 Among these second-generation PSs, phthalocyanine derivatives have attracted considerable attention, mainly because they present some optimal characteristics for anticancer PDT, such as absorption of light at 660–770 nm, high quantum yield for the generation of singlet oxygen, and rapid, prolonged accumulation inside cancerous cells.Citation7–Citation9 However, most phthalocyanine derivatives exhibit high hydrophobicity, which limits their clinical efficacy for different reasons, such as the loss in photodynamic activity,Citation10 or the pharmacokinetic issues that may arise from molecule aggregation, such as poor tissue distribution, hampering intravenous use.Citation9
Hydrophobic phthalocyanine derivatives aggregate in aqueous media, undergoing self-quenching, a phenomenon that drastically reduces the photodynamic activity of the PSs, ie, their capacity to produce reactive species by photoreactions.Citation11 In this context, the association of hydrophobic PSs to water-dispersible drug nanocarriers has been suggested as a solution to the aggregation issue.Citation12–Citation16 This approach also presents the advantage of allowing tumors to be targeted by passive and active strategies.Citation12,Citation17,Citation18 This kind of system, in which the PS is associated to carriers, is often referred to as third-generation PS.Citation19 In this context, in recent years, poly(methyl vinyl ether-co-maleic anhydride) (PVM/MA) has been reported to be a good candidate for composing versatile, biodegradable, water-dispersible drug nanocarriers.Citation20–Citation23 In the present work, PVM/MA nanoparticles (NPs) were used as water-dispersible carriers for aluminum–phthalocyanine chloride (AlPc). This new third-generation PS system showed improved photophysical properties in aqueous media and photodynamic activity in vitro against cancerous cells.
Materials and methods
Chemicals and cells
PVM/MA (Gantrez® AN-119) was kindly gifted by ISP Corporation (São Paulo, São Paulo, Brazil). Dulbecco’s Modified Eagle’s Medium (DMEM) (HyClone™; Thermo Fisher Scientific, Waltham, MA, USA). Penicillin, streptomycin, and fetal bovine serum (Gibco®; Life Technologies, Carlsbad, CA, USA). Phosphate buffered saline (PBS) (Laborclin produtos para laboratórios Ltda, Pinhais, Paraná, Brazil). Dimethyl sulfoxide, acetone, ethanol (Vetec Química Fina Ltda, Xerém, Rio de Janeiro, Brazil). All other materials were purchased from Sigma-Aldrich (St Louis, MO, USA). The cell lineages used included: murine mammary carcinoma cell lineage 4T1 (kindly provided by Dr Suzanne Ostrand-Rosenberg; MD, USA); human mammary adenocarcinoma cells MCF-7; murine fibroblast cell lineage NIH/3T3 (Rio de Janeiro Cell Bank [RJCB], Rio de Janeiro, Brazil); and human mammary epithelial cell lineage MCF-10A (kindly provided by Dr Maria Mitzi Brentani, University of São Paulo, São Paulo, Brazil).
Production of PVM/MA particles by solvent displacement
PVM/MA particles were obtained through a solvent displacement method based on a previously described protocol.Citation24 Briefly, PVM/MA was dissolved in acetone at concentrations of 10 mg/mL, 20 mg/mL, 30 mg/mL, 40 mg/mL, 60 mg/mL, and 80 mg/mL. Next, 10 mL of ethanol and 10 mL of distilled water were added, in that sequence, to 5 mL of each PVM/MA solution, under mild stirring at room temperature. Stirring was continued for 10 minutes, and then the organic solvents were removed by distillation at 45°C under reduced pressure (80 mbar) in a rotavapor apparatus (Rotavapor® R II; BÜCHI Labortechnik AG, Flawil, Switzerland). The volume of the aqueous dispersion was then completed to 10 mL with distilled water and centrifuged at 22,000 ×g for 30 minutes. The fully transparent supernatant was removed and the pellet was resuspended in 5 mL of distilled water. This dispersion was immediately analyzed for its colloidal characteristics.
Colloidal characterization
The hydrodynamic diameter (HD) and zeta potential of NPs dispersed in PBS were measured at 25°C, pH 7.4, by photon correlation spectroscopy and electrophoretic laser Doppler velocimetry (Zetasizer Nano ZS; Malvern Instruments, Malvern, UK), respectively. The polydispersity index (PDI) was calculated by the equipment software from dynamic light scattering measurements. All measurements were performed in triplicate and the results are presented as mean ± standard error of the mean (SEM).
Effect of Tween® 20 on AlPc aggregation
Molecular aggregation impairs the photodynamic efficiency of a PS and, thus, must be avoided.Citation16 This phenomenon is observed for hydrophobic phthalocyanines, such as AlPc, in aqueous media.Citation9 Therefore, the biocompatible surfactant Tween® 20 was added to the precipitation medium to reduce the aggregation of AlPc during and after its incorporation to PVM/MA NPs.
Different concentrations of Tween 20 were tested. Briefly, 28 mL of ethanol and 21 mL of distilled water were added, in that sequence, under mild stirring, at RT, to 14 mL of a 20 mg/mL PVM/MA acetone solution. Then, seven aliquots of 9 mL were separated; Tween 20 was added in different amounts and the volume of each aliquot was completed to 10 mL with distilled water. The final concentrations of Tween 20 ranged from 0%–2% (w:v). Next, 350 μL of 300 μM AlPc in ethanol was added dropwise to each aliquot under mild stirring. Organic solvents were removed, as described before; the dispersions were washed twice with 4 mL of distilled water (22,000 ×g for 30 minutes) and the NPs were then redispersed in 2 mL of distilled water. The concentration of AlPc was measured as described below. Dispersions were then diluted in distilled water to 1 µM AlPc, and fluorescence intensity (excitation [ex] λ 350 nm, emission [em] λ 690 nm) was measured in triplicate with a spectrofluorophotometer. The result was expressed as the normalized mean ± SEM of the fluorescence quantum yield (ΦF).
Measurement of AlPc concentration
Samples were diluted 20-fold in ethanol 99%, left at RT for 30 minutes, and the fluorescence intensity (ex λ 350 nm, em λ 680 nm) was then read with a spectrofluorophotometer. The concentration of AlPc was calculated on the basis of the measured fluorescence intensity with the equation of the standard curve obtained with AlPc in ethanol 95% (r2>0.999, in the range of 0.15–5.0 μM AlPc).
Effect of AlPc concentration on AlPc aggregation and on its efficiency of association to PVM/MA nanoparticles
Dispersions of PVM/MA NPs were prepared as described before, with 20 mg/mL of PVM/MA in acetone. To 5 mL aliquots of this dispersion, 500 μL of AlPc in ethanol, at concentrations ranging from 12–384 μM, were dropwise added under mild stirring and RT. Then, samples were left under stirring for 10 minutes, organic solvents were removed, the NPs were washed twice with 2 mL of distilled water, and they were resuspended in 0.5 mL of distilled water. The concentration of AlPc was measured as described before, and the dispersions were then diluted with water to 1 µM AlPc. The absorption spectrum and fluorescence intensity (ex λ 350 nm, em λ 690 nm) of each sample were measured with a spectrofluorophotometer. AlPc association efficiency was calculated as the percentage of AlPc remaining in the final dispersion in relation to the initially added amount. The ΦF was normalized and expressed as the mean ± SEM.
Association of AlPc to PVM/MA nanoparticles
The procedures described above led to the establishment of a standard protocol for associating AlPc to PVM/MA NPs. Throughout the following text, the NPs obtained by this protocol are referred to as AlPc-NP.
AlPc-NP was prepared by adding 10 mL of ethanol, 7.5 mL of distilled water, and 2.5 mL of 15% (w:v, in water) Tween 20, in that sequence, to 5 mL of 20 mg/mL of PVM/MA in acetone, under mild stirring at RT. Next, 833 μL of 300 μM AlPc in ethanol were added dropwise, and the dispersion was continued under mild stirring for 10 minutes at RT. The organic solvents were then removed by distillation at 45°C under reduced pressure (80 mbar) in a rotavapor apparatus; the volume of the remaining aqueous dispersion was completed to 10 mL with distilled water and this NP dispersion was washed twice (22,000 ×g for 30 minutes) with distilled water. Finally, the NPs were resuspended in 5 mL of PBS or distilled water; a 50 μL aliquot was separated for characterization, and the remaining volume was kept frozen at −20°C until usage. Pure PVM/MA NPs were prepared through the same protocol, without AlPc.
Scanning electron microscopy
The shape and surface morphology of NPs were both investigated in a field-emission scanning electron microscope (JSM-7001F; JEOL, Tokyo, Japan). Briefly, 20 μL of AlPc-NP dispersed in water were deposited on copper supports. Next, the sample was left to dry for 5 hours at room temperature in a jar containing silica gel desiccant, and then coated with gold using Blazers SCD 050® sputter coater (Blazers Union AG, Fürstentun, Liechtenstein). The images were digitalized using an UltraScan™ camera connected to DigitalMicrograph™ 3.6.5 computer software (Gatan, Inc., Pleasanton, CA, USA).
Photophysical characterization
Fluorescence and absorption spectra, optical density, turbidity, and fluorescence intensity, in the visible region of the electromagnetic spectrum, were all measured in a spectrofluorophotometer (Spectramax® M2; Molecular Devices LLC, Sunnyvale, CA, USA) at 25°C.
Infrared spectroscopy
Ten milliliters of AlPc-NP dispersed in water were prepared, as described before, and separated into two aliquots. A 5 mL aliquot was immediately frozen and lyophilized, while the other was left at 25°C in the dark for 6 hours, then frozen and lyophilized. These lyophilized samples, pure AlPc, and PVM/MA were then analyzed for their transmittance spectra in the infrared region of the electromagnetic spectrum with a Fourier transform infrared spectrophotometer (FTIR) (FT/IR 4100; Jasco Products Company, Oklahoma City, OK, USA) with a resolution of 4 cm−1, in the range of 500–4,000 cm−1.
Detection of singlet oxygen
Singlet oxygen was detected by a previously reported spectroscopic method.Citation25,Citation26 This method is based on the fact that the probe 1,3-diphenylisobenzofuran (DPBF) reacts irreversibly with singlet oxygen, causing a directly proportional decrease in the DPBF-specific optical density at λ 414 nm.Citation25,Citation26 Briefly, 5 μL of 5.5 mM DPBF in ethanol were added to 600 µL aliquots of the following samples: AlPc in ethanol; AlPc in PBS; AlPc-NPs in PBS; dissolved AlPc-NPs in PBS; and pure PVM/MA NPs in PBS. Then, each mixture was irradiated with a laser (λ 670 nm; energy density of 0.5 J/cm2). Absorption of the samples was read at 414 nm before and after irradiation. The difference between optical densities before and after irradiation was used as an index of singlet oxygen production. Samples without DPBF were used as blanks. The concentration of AlPc in all samples was 1 μM. The concentration of PVM/MA in AlPc-NPs and pure dispersed PVM/MA NPs was 0.6 mg/mL.
Cells and culture conditions
Cancerous (4T1 [murine] and MCF-7 [human]) and noncancerous (NIH/3T3 [murine] and MCF-10A [human]) cell lines were used in this work. NIH/3T3, 4T1, and MCF-7 cells were cultured in DMEM, and supplemented with 10% (v:v) fetal bovine serum and 1% (v:v) antibiotic solution (100 IU/mL penicillin and 100 mg/mL streptomycin). MCF-10A cells were cultured in DMEM/F12 (1/1, v:v) supplemented with 5% (v:v) equine serum, 20 ng/mL of epidermal growth factor, 10 μg/mL of bovine insulin, 0.5 μg/mL of hydrocortisone, 100 ng/mL of cholera toxin, and 1% (v:v) antibiotic solution (100 IU/mL penicillin and 100 mg/mL streptomycin). All cells were maintained at 37°C in a 5% CO2 and humidified atmosphere.
AlPc-NP incorporation/adsorption by cells
This experiment was performed to check the time profile of AlPc-NP incorporation/adsorption by cell lines used in this work. Briefly, 4T1, MCF-7, NIH/3T3, and MCF-10A cells were cultured for 24 hours according to conditions described in the Cells and culture conditions section, at a density of 1×10³ cells/well in 96-well plates. Then, the culture medium was replaced by 200 μL of AlPc-NPs dispersed in culture medium at a concentration of AlPc of 0.25 μM. Next, cells were incubated at 37°C, 5% CO2, and 80% humidity for 1 minute, 5 minutes, 10 minutes, 15 minutes, 30 minutes, or 60 minutes, in the dark. Then, the culture medium was removed, the cells were washed twice with 200 μL of PBS, and the AlPc was extracted with 200 μL of dimethyl sulfoxide for 30 minutes. Next, fluorescence was read at ex λ 350 nm and em λ 680 nm. This experiment was performed with two different pools of cells in quintuplicate, and the results were expressed as normalized fluorescence intensity.
Intracellular distribution of AlPc-NPs
The intracellular localization of AlPc-NPs was visualized by confocal microscopy. For this experiment, 4T1, MCF-7, NIH/3T3, and MCF-10A cells were cultured on coverslips placed in a 24-well plate for 24 hours, according to the conditions described in the Cells and culture conditions section, at a density of 2×10⁴ cells/well. Next, cells were exposed to AlPc-NPs dispersed in culture medium at a concentration equivalent to 0.25 μM AlPc for 15 minutes, at 37°C, 5% CO2, and 80% humidity, then washed twice with PBS, fixed with paraformaldehyde 4% (w:v) for 30 minutes, again washed twice with PBS, and mounted on glass slides. Next, cells were visualized in a confocal microscope (Leica TCS SP5, Leica Microsystems, Wetzlar, Germany) and AlPc fluorescence was detected at ex λ 405 nm and em λ 633 nm.
Cell treatment design
4T1, MCF-7, NIH/3T3, and MCF-10A cells were cultured for 24 hours under the standard conditions described above. Next, cells were treated as follows: 1) irradiated with a laser (λ 670 nm) at energy densities of 0.0 J/cm2, 3.8 J/cm2, 11.5 J/cm2, 22.9 J/cm2, and 34.4 J/cm2; 2) exposed to blank PVM/MA NPs dispersed in PBS for 15 minutes in the dark at concentrations of 0.15 mg/mL, 0.3 mg/mL, 0.6 mg/mL, 1.2 mg/mL, 2.4 mg/mL, 4.8 mg/mL, and 7.2 mg/mL of PVM/MA; 3) exposed to AlPc-NPs dispersed in PBS for 15 minutes in the dark at concentrations of 0.25 μM, 0.5 μM, 1.0 μM, 2.0 μM, 4.0 μM, 8.0 μM, and 12.0 μM of AlPc; and 4) exposed to AlPc-NPs dispersed in PBS for 15 minutes in the dark at concentrations of 0.25 μM, 0.5 μM, 1.0 μM, and 2.0 µM of AlPc, washed twice with PBS, and then irradiated with a laser (λ 670 nm) at energy densities of 0.0 J/cm2, 0.48 J/cm2, 1.38 J/cm2, and 3.82 J/cm2
After the treatments, cells were cultured for 24 hours under standard conditions and their viability was assessed by the 3,(4,5-dimethylthiazol-2-yl)-2,5-diphenyltetrazolium bromide (MTT) assay, as described in Assessment of cell viability.
Assessment of cell viability
Cell viability was assessed by exposing cells to the yellow dye MTT assay, which is converted by the mitochondria of viable cells to an insoluble purple formazan.Citation27 Briefly, after receiving their respective treatment, cells were washed twice with PBS and then incubated with 0.5 mg/mL of MTT in culture medium for 2.5 hours at 37°C, 5% CO2, and 80% humidity. Next, the MTT solution was removed and formazan was extracted from the cells with 200 µL of dimethyl sulfoxide (DMSO). The absorption was then measured at λ 595 nm using a spectrophotometer (Spectramax® M2; Molecular Devices LLC). This experiment was performed in quintuplicate for each treatment, and the results were expressed as percentages relative to control.
Detection of fragmented DNA
This experiment is based on the fact that propidium iodide (PI) binds DNA, allowing cell DNA content to be measured by flow cytometry. Briefly, 4T1, MCF-7, NIH/3T3, and MCF-10A cells were cultured under standard culture conditions on 12-well microplates at a density of 3×10⁴ cells/well for 24 hours. Next, the culture medium was removed, cells were washed twice with PBS, and 400 μL of AlPc-NPs dispersed in culture medium was added to each well, at the AlPc-NP lethal concentration LC50 specific to each cell line, as follows: 0.3 μM to 4T1; 0.6 μM to NIH/3T3; 1.8 μM to MCF-7; and 0.5 μM to MCF-10A. LC50 was calculated based on the viability of the cells exposed to different concentrations of AlPc-NPs, and they were then irradiated with laser (λ 670 nm) at 0.48 J/cm2. After 15 minutes of incubation with AlPc-NPs, the culture medium was removed, cells were washed twice with PBS, 400 µL PBS was added to each well, and cells were then irradiated with a laser (λ 670 nm) at 0.48 or 1.38 J/cm2. Next, PBS was replaced by a culture medium and cells were cultured under standard conditions for 24 hours. Then, the floating and adhered cells were harvested, centrifuged, and resuspended in 100 μL of PBS. For DNA fragmentation analysis, 200 μL of a PI-containing buffer (0.1% w:v sodium citrate, 0.1% w:v Triton™ X-100 and 20 μg/mL PI; Life Technologies) was added, and the mixture was then incubated for 30 minutes in the dark at RT. Next, samples were evaluated using FACSscan™ flow cytometry (FACSCalibur™; BD Biosciences, San Jose, CA, USA) at FL2-H (fluorescence 2 height; 560–580 nm) and analyzed by the CellQuest™ software (BD Biosciences). Ten thousand events were counted in triplicate per sample in the CyFlow® Space cytometer (Partec GmbH, Münster, Germany). Fragmented DNA was identified in sub-G1 (DNA content <2 n) populations. This experiment was performed twice, and the results were expressed as the percentage of events presenting fragmented DNA in all counted events.
Cell death analysis
The frequency of cell death by apoptosis or necrosis was analyzed after AlPc-NP-based PDT in vitro by the acridine orange/ethidium bromide double staining method.Citation28 Briefly, cells were cultured under standard culture conditions for 24 hours in 12-well plates at a density of 3×10⁴ cells/well. Then, culture medium was removed, and the cells were washed twice with PBS and exposed to 400 μL of AlPc-NPs in PBS at LC50, as described before, for 15 minutes. Cells were washed twice with PBS; 400 μL of PBS was added to each well, and then cells were irradiated with a laser (λ 670 nm) at 0.48 J/cm2 or 1.38 J/cm2. Next, cells were washed twice with PBS and cultured under standard conditions for 24 hours. Floating and adhered cells were then harvested, centrifuged, resuspended in 100 μL of PBS containing 50 μg/mL orange acridine and 50 μg/mL ethidium bromide, and left in the dark at RT for 5 minutes. Ten microliters of that suspension of cells were dispersed on a glass slide and analyzed in a fluorescence microscope. This experiment was performed twice, and 100 cells were analyzed per sample in triplicate, in three different regions of the slide. Results were expressed as the mean ± SEM of the percentage of cells in apoptosis or necrosis.
Statistical analysis
Correlation between variables was analyzed with the Spearman test. Statistical differences between groups were assessed by one-way analysis of variance, followed by Tukey or Bonferroni’s posttests (α=0.05) on GraphPad Prism 5.0 software (GraphPad Software, Inc., La Jolla, CA, USA).
Results and discussion
Hydrophobic phthalocyanine derivatives present excellent photophysical and photochemical characteristics, as well as rapid accumulation in cancerous cells.Citation9 However, the issue of their aggregation in aqueous media has severely limited their application in anticancer PDT. In this context, water-dispersible nanocarriers have been proposed to circumvent this problem.Citation5,Citation15,Citation29 In the present work, a third-generation system intended for anticancer PDT, composed of a hydrophobic phthalocyanine derivative associated to PVM/MA NPs, is described.
PVM/MA concentration affects colloid characteristics
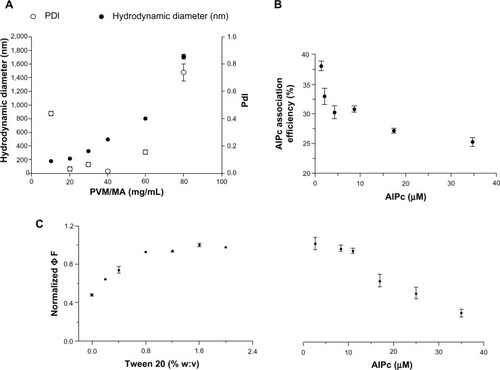
The PVM/MA NPs were produced by a solvent displacement method based on a previous work.Citation24 This method enabled the HD of PVM/MA NPs to be tuned by simply controlling the initial concentration of the polymer, corroborating previous work.Citation30 There was a significant positive correlation between the concentration of PVM/MA and the HD of NPs produced by solvent displacement (rSpearman =0.95; P<0.01; ). Narrow particle size distributions were obtained in the range of 20–40 mg/mL (2.5%–5.0% w:w, in acetone) with PDI values below 0.1, while poor quality colloids were obtained only for both the lowest and highest PVM/MA concentrations tested, as indicated by their higher values of PDI. In subsequent experiments, the concentration of PVM/MA was set to 20 mg/mL because it yielded NPs with an average HD of about 200 nm, which is interesting for parenteral administration and drug delivery purposes.Citation18
Figure 1 The effect of some process parameters on colloid and photophysical characteristics of nanoparticles.
Notes: (A) Hydrodynamic diameter and PDI of PVM/MA nanoparticles produced by solvent displacement in function of the initial PVM/MA concentration. (B) Efficiency of the AlPc association to PVM/MA nanoparticles in the function of the AlPc concentration in precipitation medium; (C) influence of Tween 20 and AlPc concentrations on the ΦF (excitation λ 350 nm, emission λ 690 nm) of AlPc nanoparticles dispersed in phosphate buffered saline, pH 7.2, at a concentration equivalent to 1 μM AlPc.
Abbreviations: PVM/MA, poly(methyl vinyl ether-co-maleic anhydride; AlPc, aluminum–phthalocyanine chloride; ΦF, fluorescence quantum yield; PDI, polydisperity index.
ΦF is affected by the concentrations of Tween 20 and AlPc
AlPc was associated to the preformed NPs dispersed in the precipitation medium, which is aqueous and thus promotes the aggregation of AlPc. Therefore, in order to avoid AlPc aggregation, the surfactant Tween 20 was added to the precipitation medium. This surfactant markedly reduced the aggregation of AlPc associated to PVM/MA NPs (AlPC-NPs). Consequently, a significant positive correlation was observed between the concentration of Tween 20 in the precipitation medium and the ΦF of AlPC-NPs (rSpearman =0.96; P<0.01; ). In subsequent experiments, Tween 20 was added at 1.5% (w:v) to the precipitation medium.
The results also showed that the concentration of AlPc affects the ΦF of the final formulation. shows a negative, significant correlation between the concentration of AlPc used in the precipitation medium and the ΦF of AlPc-NPs (rSpearman =−0.98; P<0.001). When prepared with 35 µM of AlPc, for example, AlPc-NPs presented a value of ΦF that was about only 30% of that observed for the formulation prepared with 11 µM AlPc. This is probably related to the effect of the mean distance between vicinal AlPc molecules on the intensity of quenching effects.Citation11,Citation31,Citation32
AlPc association efficiency
As shows, there was a significant negative correlation between the efficiency of association of AlPc to PVM/MA NPs and the initial AlPc concentration used in the process (rSpearman =−0.83; P<0.05). In subsequent experiments, the initial AlPc concentration was set to 10 μM in the precipitation medium.
Colloid characterization
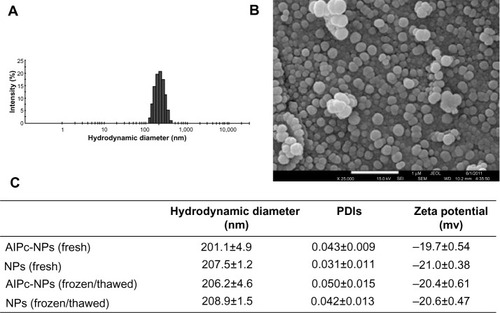
PVM/MA NPs, either with AlPc (AlPc-NPs) or without AlPc (NPs), showed narrow particle size distribution, PDI below 0.1, and negative zeta potential in aqueous medium at pH 7.2 (). The negative zeta potential reflects the presence of carboxylate groups on the surface of NPs. AlPc load in AlPc-NP was 0.9 μg/mg, as determined in the lyophilized samples. The HD did not significantly change with the association of AlPc to NPs, and was close to 200 nm for both NP and AlPc-NP. None of these characteristics was significantly affected by a freeze/thaw cycle, and all remained stable for at least 60 days at −20°C. Moreover, AlPc-NPs are spherically shaped, as shown by scanning electron microscope images.
Figure 2 Characteristics of PVM/MA NPs with AlPc-NPs or without AlPc-NPs.
Notes: (A) Histogram showing the distribution of the AlPc-NPs’ hydrodynamic diameter values; (B) scanning electron microscopy image of AlPc-NPs; (C) colloidal characteristics of AlPc-NPs and NPs, fresh and after a single cycle of freezing/thawing. (B and C) Nanoparticles were suspended in phosphate buffered saline, pH 7.2.
Abbreviations: AlPc, aluminum–phthalocyanine chloride; NPs, nanoparticles; PVM/MA, poly(methyl vinyl ether-co-maleic anhydride); PDI, polydispersity index.
Photophysical characterizations
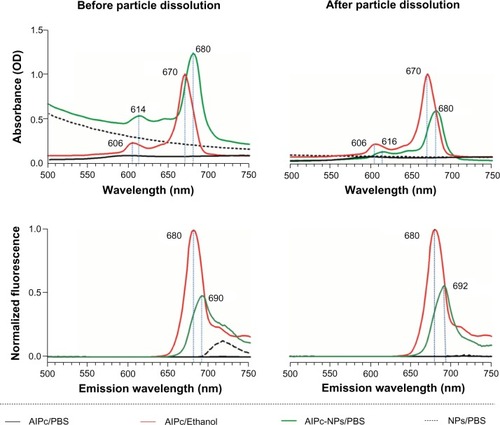
The photophysical characteristics of AlPc-NP were assessed and compared to those of free AlPc. In comparison to free AlPc in PBS, an aqueous medium, AlPc-NP presented improved photophysical and photochemical characteristics. Both the absorption and fluorescence of free AlPc are close to zero in PBS () – a medium that promotes aggregation of this molecule.Citation13 On the other hand, when dissolved in ethanol, AlPc showed intense absorption with its typical strong Q band (670 nm) and intense fluorescence emission. When associated to PVM/MA NPs (AlPc-NPs) dispersed in PBS, AlPc presented intense absorption and fluorescence, with a hyperchromic effect in relation to free AlPc in PBS and a bathochromic shift of about 10 nm for both fluorescence emission and absorption peaks in comparison to free AlPc in ethanol. The peak observed at 720 nm is due to the turbidity of the NP suspensions (NP/PBS and AlPc-NP/PBS), and this fades away after the dissolution of NPs.
Figure 3 Absorbance and fluorescence (excitation at λ 350 nm) spectra of NPs and AlPc-NPs (1 μM AlPc) dispersed in PBS, before and after NP dissolution, and of 1 μM free AlPc in PBS or ethanol.
Abbreviations: OD, optical density; AlPc, aluminum–phthalocyanine chloride; PBS, phosphate buffered saline; NP, nanoparticle.
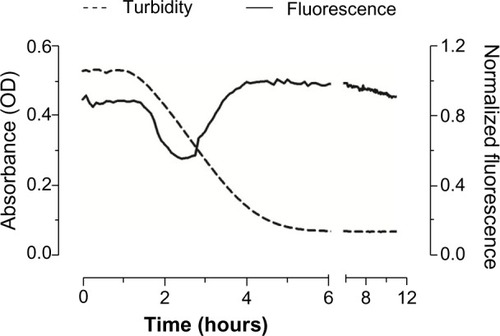
The dissolution of AlPc-NPs occurred within a few hours, as evidenced by the gradual decrease in the turbidity of the dispersion (). The decrease in turbidity begins at about 1 hour and stops at 5 hours. At 6 hours, it was not possible to observe any remaining NPs in the scanning electron microscope images (data not shown). Interestingly, even after the complete dissolution of the AlPc-NPs in PBS, its photodynamic activity was maintained, suggesting that AlPc remains associated to PVM/MA even after the dissolution of NPs. In other systems, such as those based on poly(lactic-co-glycolic) acid, the photodynamic activity of hydrophobic PS molecules in aqueous media may be significantly reduced after the disintegration of NPs.Citation32,Citation33 A strong Coulomb interaction between the negative, carboxylate groups of PVM/MA and the positive, metallic center of AlPc may be responsible for keeping AlPc associated to the polymer strands even after the dissolution of NPs.
Figure 4 Variation of turbidity (absorbance at λ 510 nm) and fluorescence (excitation λ 350 nm, emmission λ 670 nm) with time for AlPc-NPs (1 μM AlPc) dispersed in PBS at 25°C.
Abbreviations: OD, optical density; AlPc, aluminum–phthalocyanine chloride; NPs, nanoparticles; PBS, phosphate buffered saline.
FTIR spectra
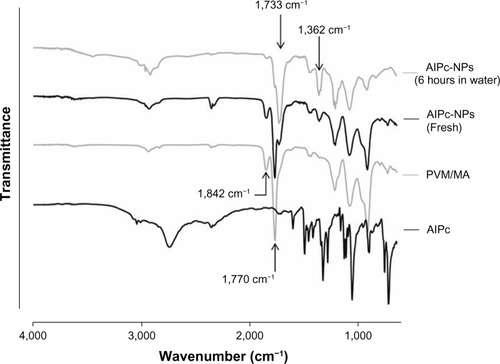
PVM/MA anhydride groups readily react with water, producing carboxyl groups, as confirmed by the FTIR spectrum of AlPc-NPs exposed to water for 6 hours. It clearly shows an intense reduction in the intensity of the anhydride bands, at 1,770 cm−1 and 1,842 cm−1,Citation34 in comparison to the spectra of both fresh AlPc-NPs and pure PVM/MA (). Moreover, two bands typical of carboxyl groups, at 1,362 cm−1 and 1,733 cm−1,Citation34 appeared for AlPc-NPs after 6 hours of exposure to water. Fresh AlPc-NPs also showed bands of carboxyl groups and a reduction in the intensity of anhydride bands, as a consequence of the exposure of PVM/MA to the water added during the process of NP preparation.
Figure 5 FTIR spectra of AlPc, PVM/MA, fresh AlPc-NPs, and AlPc-NPs exposed to water for 6 hours.
Notes: The appearance of carboxyl bands, at 1,362 cm−1 and 1,733 cm−1, and the decrease in the intensity of anhydride bands, at 1,770 cm−1 and 1,842 cm−1, shows that the anhydride groups of PVM/MA are hydrolyzed when AlPc-NPs are exposed to water.
Abbreviations: AlPc, aluminum–phthalocyanine chloride; NPs, nanoparticles; PVM/MA, poly(methyl vinyl ether-co-maleic anhydride); FTIR, Fourier transform infrared spectrophotometer.
It is possible to control the time of PVM/MA dissolution in aqueous media through simple steps of NP surface modification, such as the crosslinking of polymer strands with a diamineCitation23 or associating them with polymers by hydrogen bonds. This kind of modification can give the NPs some interesting properties for drug delivery and controlled release purposes.
Because of the anhydride groups, PVM/MA NPs also allow several targeting molecules to be easily converted to their surface.Citation20,Citation35 Moreover, carboxyl groups generated by the hydrolysis of anhydride groups form hydrogen bonds with other molecules exposed on the cell membrane and with other possible biological targets.Citation23 This phenomenon can also be explored to increase the incorporation of PS molecules by target cells.
AlPc-NP produces oxidant species in aqueous medium under light irradiation
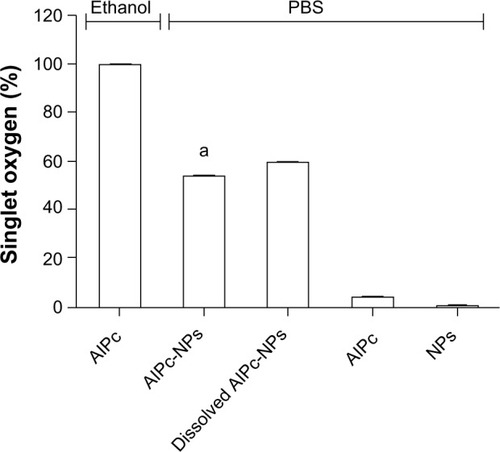
As shows, under irradiation with a laser (λ 670 nm; 0.5 J/cm2 energy density), the level of oxidant species generated by AlPc-NPs in PBS was equivalent to more than 50% of that observed with free AlPc in ethanol; on the other hand, free AlPc in PBS reached less than 5%. This result matches the increase in ΦF previously discussed and shows that the association of AlPc to PVM/MA NPs enhances the photochemical performance of this PS in aqueous media. After its dissolution, AlPc-NPs generated about 10% more oxidant species in comparison to the fresh formulation.
Figure 6 Generation of singlet oxygen by 1 μM free AlPc in ethanol or PBS, and by pure PVM/MA NPs, fresh AlPc-NPs (1 μM AlPc), and dissolved AlPc-NPs (1 µM AlPc) in PBS under irradiation with a laser (λ 670 nm, energy density of 0.5 J/cm2).
Note: aP<0.05 versus all the other groups.
Abbreviations: PBS, phosphate buffered saline; AlPc, aluminum–phthalocyanine chloride; NPs, nanoparticles; PVM/MA, poly(methyl vinyl ether-co-maleic anhydride).
AlPc-NP is incorporated by cells in vitro
shows that AlPc-NP was incorporated by both cancerous and noncancerous cells. It was observed that murine cancerous cells, 4T1, incorporated 16.4% and 30.7% more AlPc-NPs than did murine noncancerous cells (NIH/3T3) at 30 minutes and 60 minutes of incubation, respectively. Cancerous cells of human origin (MCF-7) incorporated 18.8% and 73.9% more AlPc-NPs than did the noncancerous cells (MCF-10A) at 30 minutes and 60 minutes, respectively. The higher incorporation seen in cancerous cells may be due to the higher endocytic activity of these cells.Citation17 shows the intracellular distribution of AlPc-NPs after 15 minutes of exposure to AlPc-NP in cells from all lines. Fluorescence imaging by confocal microscopy clearly shows that AlPc-NP is concentrated in the cytosol of the cells.
Figure 7 In vitro incorporation of AlPc-NPs by cancerous (4T1 [murine] and MCF-7 [human]) and noncancerous (NIH/3T3 [murine] and MCF-10A [human]) cells.
Notes: (A) Evolution of incorporation with time; aP<0.01 for 4T1 versus NIH/3T3, P<0.001 for MCF-7 versus MCF-10A; bP<0.001 for 4T1 versus NIH/3T3 and for MCF-7 versus MCF-10A. (B) Confocal images of cells exposed to AlPc associated to PVM/MA NPs (AlPc-NPs; concentration equivalent to 0.25 μM AlPc) for 15 minutes; AlPc appears in red; the scale bar (white rod) length is equal to 50 μm for 4T1, NIH/3T3, and MCF-10, and 10 μm for MCF-7.
Abbreviations: AlPc, aluminum–phthalocyanine chloride; NPs, nanoparticles; PVM/MA, poly(methyl vinyl ether-co-maleic anhydride).
![Figure 7 In vitro incorporation of AlPc-NPs by cancerous (4T1 [murine] and MCF-7 [human]) and noncancerous (NIH/3T3 [murine] and MCF-10A [human]) cells.Notes: (A) Evolution of incorporation with time; aP<0.01 for 4T1 versus NIH/3T3, P<0.001 for MCF-7 versus MCF-10A; bP<0.001 for 4T1 versus NIH/3T3 and for MCF-7 versus MCF-10A. (B) Confocal images of cells exposed to AlPc associated to PVM/MA NPs (AlPc-NPs; concentration equivalent to 0.25 μM AlPc) for 15 minutes; AlPc appears in red; the scale bar (white rod) length is equal to 50 μm for 4T1, NIH/3T3, and MCF-10, and 10 μm for MCF-7.Abbreviations: AlPc, aluminum–phthalocyanine chloride; NPs, nanoparticles; PVM/MA, poly(methyl vinyl ether-co-maleic anhydride).](/cms/asset/645d5807-5d70-455e-a585-a8ba70737246/dijn_a_57420_f0007_c.jpg)
Photodynamic activity against cells in vitro
The cytotoxic potential of laser, PVM/MA NPs, and AlPc-NP alone was evaluated. As show, laser and PVM/MA NPs, at any of the energy densities and concentrations tested, respectively, were not toxic to the studied cells. These results are in accordance with basic features of PDT, which assume that both the light source and drug carrier are innocuous when used separately.Citation36 In addition, the absence of significant cell death after exposure to PVM/MA NPs shows that this material is biocompatible.
Figure 8 Viability of cancerous (4T1 [murine] and MCF-7 [human]) and noncancerous (NIH/3T3 [murine] and MCF-10A [human]) cells after exposure to laser alone, PVM/MA NPs, and AlPc associated to PVM/MA NPs.
Notes: (A) Laser (670 nm) alone; (B) PVM/MA NPs in the dark; and (C and D) AlPc associated to PVM/MA NPs (AlPc-NPs) in the dark. (A and B) There were no statistically significant differences between the viabilities of treated and nontreated cells. aP<0.05 versus 0 μM; bP<0.001 versus 0 μM; cP<0.01 versus 0 μM.
Abbreviations: PVM/MA, poly(methyl vinyl ether-co-maleic anhydride); AlPc, aluminum–phthalocyanine chloride; NPs, nanoparticles.
![Figure 8 Viability of cancerous (4T1 [murine] and MCF-7 [human]) and noncancerous (NIH/3T3 [murine] and MCF-10A [human]) cells after exposure to laser alone, PVM/MA NPs, and AlPc associated to PVM/MA NPs.Notes: (A) Laser (670 nm) alone; (B) PVM/MA NPs in the dark; and (C and D) AlPc associated to PVM/MA NPs (AlPc-NPs) in the dark. (A and B) There were no statistically significant differences between the viabilities of treated and nontreated cells. aP<0.05 versus 0 μM; bP<0.001 versus 0 μM; cP<0.01 versus 0 μM.Abbreviations: PVM/MA, poly(methyl vinyl ether-co-maleic anhydride); AlPc, aluminum–phthalocyanine chloride; NPs, nanoparticles.](/cms/asset/502aa0d4-931e-475b-b7d7-4a456af964bf/dijn_a_57420_f0008_c.jpg)
In , a significant reduction in the viability of murine 4T1 and NIH/3T3 cells was noted when they were exposed in the dark to AlPc-NPs, starting at 4.0 μM and 8.0 μM of AlPc, respectively. On the other hand, the same treatment was not cytotoxic to the human cell lines at any of the tested AlPc-NP concentrations, as shown in . These results determined the highest nontoxic AlPc concentration (2.0 μM) for the subsequent PDT experiments.
Even for cell lineages from the same species, different susceptibility to toxic compounds may be found. For different cancer cell lineages, the susceptibility to some substances may vary even more significantly than for normal cells, as differences in metabolism are easily observed in this kind of cell.Citation37 Therefore, the species factor may not be responsible for the difference observed in our experiments.
After testing the cytotoxicity of isolated components of the system, and ensuring the internalization of AlPc by cells (), PDT was performed in vitro with AlPc-NPs at different concentrations. shows that PDT with AlPc-NPs was able to induce significant reductions in the viability of cells from all lines. For murine cells (4T1 and NIH/3T3) and human cancerous cells (MCF-7) at low laser energy densities, cytotoxicity was clearly dependent on the concentration of AlPc-NP. At the highest laser energy density, 3.82 J/cm2, the maximum effect was reached even at 0.25 μM of AlPc-NP for all cells.
Figure 9 Viability of cancerous (4T1 [murine] and MCF-7 [human]) and noncancerous (NIH/3T3 [murine] and MCF-10A [human]) cells after exposure to AlPc associated to poly(methyl vinyl ether-co-maleic anhydride) nanoparticles, at different concentrations of AlPc, for 15 minutes followed by the application of light (laser, 670 nm) at different energy densities in vitro.
Note: Pairs of means in the same graph identified with different letters are statistically different (P<0.05).
Abbreviation: AlPc, aluminum–phthalocyanine chloride.
![Figure 9 Viability of cancerous (4T1 [murine] and MCF-7 [human]) and noncancerous (NIH/3T3 [murine] and MCF-10A [human]) cells after exposure to AlPc associated to poly(methyl vinyl ether-co-maleic anhydride) nanoparticles, at different concentrations of AlPc, for 15 minutes followed by the application of light (laser, 670 nm) at different energy densities in vitro.Note: Pairs of means in the same graph identified with different letters are statistically different (P<0.05).Abbreviation: AlPc, aluminum–phthalocyanine chloride.](/cms/asset/7010b64c-a916-40ef-adc7-78c7e31e756c/dijn_a_57420_f0009_c.jpg)
The observed cell death after AlPc-NP-mediated PDT (), along with the finding that AlPc-NP is incorporated by both normal and cancerous cells (), shows that AlPc-NP is delivered to cultured cells in a nonspecific manner. That was expected, since the specific delivery of drugs to the tumor with nanobased systems is mainly dependent on the altered physiological characteristics of cancerous tissues in vivo.Citation38,Citation39
Malignant neoplastic tissues have abnormal and aberrant blood vessels that are much more permeable to NPs when compared to normal noncancerous blood vessels.Citation39 This phenomenon is classically referred to as the enhanced permeability and retention effect, and is one of the most important theories explaining the enhanced drug delivery to tumor tissues related to nanobased drug carriers.Citation40,Citation41 Therefore, the differences in the specificity of drug delivery are better observed in in vivo experimental methods.
Cell death mechanism and DNA fragmentation
shows that DNA fragmentation was more intense in cells treated with PDT at the lowest laser energy density tested (0.48 J/cm2). This profile was observed for all the cell lines tested. On the other hand, DNA fragmentation in the cells receiving PDT at the highest energy density applied, 1.38 J/cm2, was statistically equal to the control.
Figure 10 DNA fragmentation and cell death assessed after exposure of cells to LC at 10% (LC10) of AlPc-NPs for 15 minutes followed by the application of light (laser, λ 670 nm) at different energy densities in vitro.
Notes: (A) DNA fragmentation and (B) cell death. The values of LC50 for 4T1, NIH/3T3, MCF-7, and MCF-10A were 0.31 μM AlPc, 0.63 μM AlPc, 0.46 μM AlPc, and 1.80 μM AlPc, respectively. (A) The difference between pairs of means in the same graph identified with different letters are statistically significant (P<0.05). (B) *Groups presenting with a statistically significant difference between the means for apoptosis and necrosis; no statistically significant differences were observed between the results of different cell lineages of the same origin.
Abbreviations: NPs, nanoparticles; LC, lethal concentrations; AlPc, aluminum–phthalocyanine chloride.
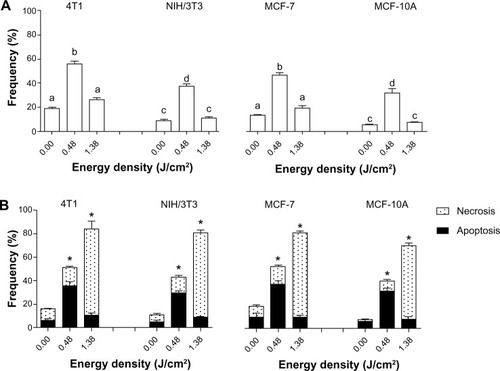
The results show a bell-shaped distribution of DNA damage in the function of energy density in all cell types. Interestingly, the predominant mechanism of cell death induced by AlPc-NP-mediated PDT was affected by the laser energy density applied. In , it is possible to note that in cells treated with PDT at the lowest laser energy density, apoptosis was predominant. On the other hand, at higher energy density, necrosis was the predominant mechanism of cell death, and the frequency of cell death was also increased in the highest energy groups.
These results indicated that low-energy PDT leads to the activation of the effector mechanisms related to apoptosis in a typical oxidative stress-induced apoptosis pathway.Citation42,Citation43 In contrast, cells treated with high-energy PDT presented a predominant pattern of necrotic cell death. These observations are in accordance with other reports, which identified a significantly increased intracellular oxidative stress when high-light energies were applied in the PDT protocols in comparison with low-light energy protocols.Citation44,Citation45 When oxidative stress is too intense, as observed in the high-energy groups, the cellular machinery that initiates apoptosis is also affected, and cell death occurs via necrosis.Citation45,Citation46
Thus, at lower energy doses, limited damage is caused to cell structures. This damage is not enough to promote cell necrosis, but it is able to activate the cellular machinery responsible for the initiation of apoptosis. On the other hand, the more intense severe damage caused by higher energy doses is capable of significantly destroying important cell structures – such as the cell membrane, for example – leading to death by necrosis.
Interestingly, based on the fact that cell death by necrosis induces a robust inflammatory response and potentiates an antitumoral immune response,Citation47 it is possible to suggest that the high-energy PDT can stimulate immune activation against the remaining tumor cells. Actually, this hypothesis has already been suggested and described as an advantage of PDT over traditional antitumor therapies, such as some chemotherapy protocols that are generally immunosuppressive.Citation48–Citation50
Conclusion
In conclusion, the system composed by AlPc associated to PVM/MA NPs presents photodynamic activity in aqueous media, and may be used for anticancer PDT. This new third-generation PS should be further studied, especially for its drug delivery ability in in vivo models. Moreover, PVM/MA NPs may also be tested as a carrier for other PSs.
Acknowledgments
Financial support from the Brazilian agencies: National Counsel of Technological and Scientific Development (CNPq, Brasília, Distrito Federal, Brazil), Funding Authority for Studies and Projects (FINEP, Rio de Janeiro, Rio de Janeiro, Brazil), Agency for the Support and Evaluation of Graduate Education (CAPES, Brasília, Distrito Federal, Brazil), and Research Funding Foundation of Distrito Federal (FAP/DF, Brasília, Distrito Federal, Brazil) is gratefully acknowledged.
Disclosure
The authors report no conflicts of interest in this work.
References
- YanoSHiroharaSObataMCurrent states and future views in photodynamic therapyJournal of Photochemistry and Photobiology C: Photochemistry Reviews20111214667
- MooreCMPendseDEmbertonMPhotodynamic therapy for prostate cancer – a review of current status and future promiseNat Clin Pract Urol200961183019132003
- DolmansDEFukumuraDJainRKPhotodynamic therapy for cancerNat Rev Cancer20033538038712724736
- MacDonaldIJDoughertyTJBasic principles of photodynamic therapyJ Porphyr Phthalocyanines200152105129
- Figueiró LongoJPMuehlmannLAVieira VellosoNEffects of photodynamic therapy mediated by liposomal aluminum-phthalocyanine chloride on chemically induced tongue tumorsChemotherapy201212
- BuytaertEDewaeleMAgostinisPMolecular effectors of multiple cell death pathways initiated by photodynamic therapyBiochim Biophys Acta2007177618610717693025
- O’ConnorAEGallagherWMByrneATPorphyrin and nonporphyrin photosensitizers in oncology: preclinical and clinical advances in photodynamic therapyPhotochem Photobiol20098551053107419682322
- DettyMRGibsonSLWagnerSJCurrent clinical and preclinical photosensitizers for use in photodynamic therapyJ Med Chem200447163897391515267226
- ChanWSMarshallJFSvensenRBedwellJHartIREffect of sulfonation on the cell and tissue distribution of the photosensitizer aluminum phthalocyanineCancer Res19905015453345382369730
- KobayashiMKigawaYSatohKSawadaKSolvent effect on the aggregation of amphiphilic phthalocyanines substituted by polyethyleneoxideJ Porphyr Phthalocyanines2012162183191
- LovellJFLiuTWChenJZhengGActivatable photosensitizers for imaging and therapyChem Rev201011052839285720104890
- LimCKHeoJShinSNanophotosensitizers toward advanced photodynamic therapy of cancerCancer Lett2013334217618723017942
- DhamiSPhillipsDComparison of the photophysics of an aggregating and non-aggregating aluminum phthalocyanine system incorporated into unilamellar vesiclesJ Photochem Photobiol A Chem19961001–37784
- NunesSMSquillaFSTedescoACPhotophysical studies of zinc phthalocyanine and chloroaluminum phthalocyanine incorporated into liposomes in the presence of additivesBraz J Med Biol Res200437227328414762584
- Ricci-JúniorEMarchettiJMPreparation, characterization, photocytotoxicity assay of PLGA nanoparticles containing zinc (II) phthalocyanine for photodynamic therapy useJ Microencapsul200623552353816980274
- RossettiFCLopesLBCarolloARThomaziniJATedescoACBentleyMVA delivery system to avoid self-aggregation and to improve in vitro and in vivo skin delivery of a phthalocyanine derivative used in the photodynamic therapyJ Control Release2011155340040821763732
- SharmanWMvan LierJEAllenCMTargeted photodynamic therapy via receptor mediated delivery systemsAdv Drug Deliv Rev2004561537614706445
- TorchilinVTumor delivery of macromolecular drugs based on the EPR effectAdv Drug Deliv Rev201163313113520304019
- JosefsenLBBoyleRWPhotodynamic therapy: novel third-generation photosensitizers one step closer?Br J Pharmacol200815411318362894
- ArbósPWirthMArangoaMAGaborFIracheJMGantrez AN as a new polymer for the preparation of ligand-nanoparticle conjugatesJ Control Release200283332133012387941
- ArbósPCampaneroMAArangoaMARenedoMJIracheJMInfluence of the surface characteristics of PVM/MA nanoparticles on their bioadhesive propertiesJ Control Release2003891193012695060
- SalmanHHGamazoCde SmidtPCRussell-JonesGIracheJMEvaluation of bioadhesive capacity and immunoadjuvant properties of vitamin B(12)-Gantrez nanoparticlesPharm Res200825122859286818679774
- IracheJMHuiciMKonecnyMEspuelasSCampaneroMAArbosPBioadhesive properties of Gantrez nanoparticlesMolecules200510112614518007282
- GómezSGamazoCSan RomanBVauthierCFerrerMIrachelJMDevelopment of a novel vaccine delivery system based on Gantrez nanoparticlesJ Nanosci Nanotechnol200669–103283328917048548
- HeXWuXWangKShiBHaiLMethylene blue-encapsulated phosphonate-terminated silica nanoparticles for simultaneous in vivo imaging and photodynamic therapyBiomaterials200930295601560919595455
- SpillerWKlieschHWöhrleDHackbarthSRöderBSchnurpfeilGSinglet oxygen quantum yields of different photosensitizers in polar solvents and micellar solutionsJ Pept Res199822145158
- MosmannTRapid colorimetric assay for cellular growth and survival: application to proliferation and cytotoxicity assaysJ Immunol Methods1983651–255636606682
- TakahashiAMatsumotoHYukiKHigh-LET radiation enhanced apoptosis but not necrosis regardless of p53 statusInt J Radiat Oncol Biol Phys200460259159715380596
- da Volta SoaresMOliveiraMRdos SantosEPNanostructured delivery system for zinc phthalocyanine: preparation, characterization, and phototoxicity study against human lung adenocarcinoma A549 cellsInt J Nanomedicine2011622723821499420
- BallyFGargDKSerraCAImproved size-tunable preparation of polymeric nanoparticles by microfluidic nanoprecipitationPolymer2012532250455051
- MasterAMRodriguezMEKenneyMEOleinickNLGuptaASDelivery of the photosensitizer Pc 4 in PEG-PCL micelles for in vitro PDT studiesJ Pharm Sci20109952386239819967780
- VargasAEidMFanchaouyMGurnyRDelieFIn vivo photodynamic activity of photosensitizer-loaded nanoparticles: formulation properties, administration parameters and biological issues involved in PDT outcomeEur J Pharm Biopharm2008691435318023564
- PaszkoEEhrhardtCSengeMOKelleherDPReynoldsJVNanodrug applications in photodynamic therapyPhotodiagnosis Photodyn Ther201181142921333931
- LiYLeePIA new bioerodible system for sustained local drug delivery based on hydrolytically activated in situ macromolecular associationInt J Pharm20103831–2455219748559
- SalmanHHGamazoCCampaneroMAIracheJMSalmonella-like bioadhesive nanoparticlesJ Control Release20051061–211315970347
- CastanoAPDemidovaTNHamblinMRMechanisms in photodynamic therapy: part one – photosensitizers, photochemistry and cellular localizationPhotodiagnosis Photodyn Ther200414279293
- LotanRDifferent susceptibilities of human melanoma and breast carcinoma cell lines to retinoic acid-induced growth inhibitionCancer Res197939310141019427741
- MuehlmannLAJoanittiGASilvaJRLongoJPAzevedoRBLiposomal photosensitizers: potential platforms for anticancer photodynamic therapyBraz J Med Biol Res201144872973721969965
- NicholsJWBaeYHOdyssey of a cancer nanoparticle: from injection site to site of actionNano Today20127660661823243460
- YokoyamaMDrug targeting with nano-sized carrier systemsJ Artif Organs200582778416094510
- MaedaHWuJSawaTMatsumuraYHoriKTumor vascular permeability and the EPR effect in macromolecular therapeutics: a reviewJ Control Release2000651–227128410699287
- TrineiMGiorgioMCicaleseAA p53-p66 Shc signalling pathway controls intracellular redox status, levels of oxidation-damaged DNA and oxidative stress-induced apoptosisOncogene200221243872387812032825
- RyterSWKimHPHoetzelAMechanisms of cell death in oxidative stressAntioxid Redox Signal200791498917115887
- TapajósECLongoJPSimioniARIn vitro photodynamic therapy on human oral keratinocytes using chloroaluminum-phthalocyanineOral Oncol200844111073107918620899
- LuoYKesselDInitiation of apoptosis versus necrosis by photodynamic therapy with chloroaluminum phthalocyaninePhotochem Photobiol19976644794839337618
- MarchalSFadlounAMaugainED’HallewinMAGuilleminFBezdetnayaLNecrotic and apoptotic features of cell death in response to Foscan photosensitization of HT29 monolayer and multicell spheroidsBiochem Pharmacol20056981167117615794937
- AmaravadiRKThompsonCBThe roles of therapy-induced autophagy and necrosis in cancer treatmentClin Cancer Res200713247271727918094407
- CastanoAPMrozPHamblinMRPhotodynamic therapy and anti-tumour immunityNat Rev Cancer20066753554516794636
- GargADNowisDGolabJAgostinisPPhotodynamic therapy: illuminating the road from cell death towards anti-tumour immunityApoptosis20101591050107120221698
- KorbelikMStottBSunJPhotodynamic therapy-generated vaccines: relevance of tumour cell death expressionBr J Cancer200797101381138717971767