
Abstract
Background
Recently, graphene and graphene-related materials have attracted much attention due their unique properties, such as their physical, chemical, and biocompatibility properties. This study aimed to determine the cytotoxic effects of graphene oxide (GO) that is reduced biologically using Ganoderma spp. mushroom extracts in MDA-MB-231 human breast cancer cells.
Methods
Herein, we describe a facile and green method for the reduction of GO using extracts of Ganoderma spp. as a reducing agent. GO was reduced without any hazardous chemicals in an aqueous solution, and the reduced GO was characterized using a range of analytical procedures. The Ganoderma extract (GE)-reduced GO (GE-rGO) was characterized by ultraviolet-visible absorption spectroscopy, X-ray diffraction, Fourier-transform infrared spectroscopy, X-ray photoelectron spectroscopy, dynamic light scattering, scanning electron microscopy, Raman spectroscopy, and atomic force microscopy. Furthermore, the toxicity of GE-rGO was evaluated using a sequence of assays such as cell viability, lactate dehydrogenase leakage, and reactive oxygen species generation in human breast cancer cells (MDA-MB-231).
Results
The preliminary characterization of reduction of GO was confirmed by the red-shifting of the absorption peak for GE-rGO to 265 nm from 230 nm. The size of GO and GE-rGO was found to be 1,880 and 3,200 nm, respectively. X-ray diffraction results confirmed that reduction processes of GO and the processes of removing intercalated water molecules and the oxide groups. The surface functionalities and chemical natures of GO and GE-rGO were confirmed using Fourier-transform infrared spectroscopy and X-ray photoelectron spectroscopy. The surface morphologies of the synthesized graphene were analyzed using high-resolution scanning electron microscopy. Raman spectroscopy revealed single- and multilayer properties of GE-rGO. Atomic force microscopy images provided evidence for the formation of graphene. Furthermore, the effect of GO and GE-rGO was examined using a series of assays, such as cell viability, membrane integrity, and reactive oxygen species generation, which are key molecules involved in apoptosis. The results obtained from cell viability and lactate dehydrogenase assay suggest that GO and GE-rGO cause dose-dependent toxicity in the cells. Interestingly, it was found that biologically derived GE-rGO is more toxic to cancer cells than GO.
Conclusion
We describe a simple, green, nontoxic, and cost-effective approach to producing graphene using mushroom extract as a reducing and stabilizing agent. The proposed method could enable synthesis of graphene with potential biological and biomedical applications such as in cancer and angiogenic disorders. To our knowledge, this is the first report using mushroom extract as a reducing agent for the synthesis of graphene. Mushroom extract can be used as a biocatalyst for the production of graphene.
Introduction
Graphene is a single-atom-thick, two-dimensional sheet of hexagonally arranged carbon atoms packed into a honeycomb lattice, and is of great interest in the fields of materials science, physics, and chemistry.Citation1–Citation3 Due its unique physical, chemical, and biocompatibility properties, graphene has been used in various applications, including biosensing,Citation3 diagnosis,Citation4 antibacterial development,Citation5–Citation8 antiviral material development,Citation9 and cancer targeting.Citation10 Recently, graphene family nanomaterials (GFNs) have been explored in several applications in the field of nanobiotechnology and in biomedical applications due to their unique intrinsic properties.Citation11 Liu et al developed a highly soluble NGO–PEG–SN38 (nano-graphene oxide-polyethylene glycol readily complexes with a water insoluble aromatic molecule SN38) complex that exhibited high cancer cell-killing potency similar to that of the free SN38 molecules in organic solvents.Citation12 Due to increasing demand for graphene materials, researchers in both academic fields and in industry have explored the possibility of using nontoxic and ecofriendly biological materials for reduction and functionalization of graphene oxide (GO). Several research groups have established various methods for the synthesis of graphene and its derivatives, including exfoliation of graphite (Gt),Citation13 flash reduction,Citation14 hydrothermal dehydration,Citation15 mechanical exfoliation,Citation16 epitaxial growth,Citation17 photocatalysis,Citation18 and photodegradation.Citation19 Liu et alCitation20 developed a one-step electrochemical exfoliation of ionic liquid-functionalized Gt for the production of homogeneous graphene, bottom-up organic synthesis.Citation21 Subrahmanyam et alCitation22 synthesized graphene flakes including two to four layers in the inner wall region of the arc chamber using arc discharge between Gt electrodes under a mixed atmosphere of hydrogen and helium in different proportions without using any catalyst. Wang et alCitation23 produced large-scale graphene nanosheets using arc evaporation of a Gt rod in the air. Xu and SuslickCitation24 synthesized polystyrene-functionalized graphene using a sonochemical approach. Reduction of GO by chemical methods seems to be promising, due to its low cost and potential for large-scale production, and it is also appropriate for chemical modification and subsequent processing; however, in chemical methods, the usage of hydrazine and hydrazine derivatives as strong reducing agents for formation of graphene can be toxic or explosive and challenging to handle for larger-scale production.Citation6,Citation9 Earlier, several studies reported the production of graphene using various biological systems, such as bacterial respiration,Citation25 poly(allylamine),Citation26 potassium hydroxide,Citation27 polyvinyl pyrrolidone,Citation28 ascorbic acid,Citation29 sugar,Citation30 and baker’s yeast.Citation31 Recently, we and other researchers developed a greener approach for synthesis of graphene using various bacteria, such as Escherichia coli,Citation7,Citation32 Escherichia fergusonii,Citation33 and Bacillus marisflavi.Citation34
The application of graphene materials is dependent on physicochemical properties such as particulate state, number of layers, surface functional groups, surface charge, and size and shape.Citation35 In addition, the toxicity of graphene materials is one of the crucial factors in biomedical applications. The toxicities of carbon and graphene nanomaterials suggest that they can be used as antimicrobial agents, coatings, or products.Citation36 GO and reduced GO (rGO) nanowalls significantly inhibited the growth of Gram-negative E. coli and Gram-positive Staphylococcus aureus.Citation19 Graphene and graphene derivatives effectively inhibited growth of bacteria through direct interaction between extremely sharp edges of graphene sheets and the cell wall membrane of the bacteria. Liu et alCitation37 demonstrated antibacterial activity of GO–silver (Ag) composites and Ag nanoparticles, wherein GO–Ag composites showed a significant effect than Ag nanoparticles. The dose-dependent antibacterial effects of GO and graphene have been reported in E. coli and Pseudomonas aeruginosa.Citation8,Citation38 The cytotoxic effects of graphene incorporated in titanium dioxide film were investigated against Caenorhabditis elegans nematodes, under solar light-induced stress conditions.Citation39 Zhang et alCitation40 studied the effects of graphene and carbon nanotubes (CNTs) in pheochromocytoma (PC-12) cells and found that the CNTs were more toxic than graphene. Wang et alCitation41 reported that the dose-dependent toxicity of single-layer GO sheets in human lung epithelial cells or fibroblasts were caused by internalization of GO into cytoplasm and into membrane-bound vacuoles. Chang et alCitation42 suggested that GO will not enter A549 cells and shows no obvious toxicity to A549 cells, regardless of the size or dose of GO. Liao et alCitation43 reported that the biocompatibility of graphene-related materials depends on physical and chemical properties as well as on the exposure environment. The treatment of few layer graphene with a dose of 10 μg/mL for 24 hours in neuronal cells showed an increased intracellular generation of reactive oxygen species (ROS) and induction of mitochondrial injury.Citation40 Among various nanomaterials, GFNs have been explored in several biomedical applications due to their unique mechanical properties, such as high elasticity, flexibility, and adaptability for tissue engineering.Citation44–Citation46 Singh et alCitation47 reported that the amine-modified graphene showed neither stimulatory nor inhibitory effects on human platelets.
Recently, different types of fungal biomass or extracts have been used as reducing agents for synthesis of Ag and gold nanoparticles, such as those derived from Verticillium,Citation48 Fusarium oxysporum Schlecht,Citation49 Aspergillus fumigatus,Citation50 Penicillium fellutanum,Citation51 and Volvariella volvacea.Citation52 Highly medicinal mushrooms such as Ganoderma neojaponicum Imazeki have been shown to synthesize nanoparticles extracellularly with a resulting size of 5 nm synthesized nanoparticles.Citation53 Ganoderma spp. have a group of bioactive components which have pharmacological properties.Citation54 Therefore, we have taken advantage of these Ganoderma extracts to be used as reducing and stabilizing agents for the reduction of GO. The primary benefits of using fungal extracts are nontoxicity, availability, and absence of toxic waste from the process of synthesis. In addition, mushrooms contain many pharmaceutically important compounds, which have diverse biological activity and the capacity to secrete a large number of active substances, which play an important role as reducing agents for synthesis of Ag and gold nanoparticles. Therefore, we explored the possibility of using Ganoderma spp. for synthesis of graphene. Herein, we describe a green approach to reducing GO in an aqueous solution using mushroom extracts. Further, the effects of as-prepared Ganoderma extract (GE)-rGO in human breast cancer cells were evaluated.
Materials and methods
Materials
Gt powder, NaOH, KMnO4, NaNO3 anhydrous ethanol, 98% H2SO4, 36% HCl, and 30% hydrogen peroxide (H2O2) aqueous solution were purchased from Sigma-Aldrich (St Louis, MO, USA). Penicillin–streptomycin solution, trypsin–ethylenediaminetetraacetic acid solution, Dulbecco’s Modified Eagle’s Medium (DMEM), and 1% antibiotic–antimycotic solution were obtained from Gibco® (Life Technologies, Carlsbad, CA, USA). Fetal bovine serum, in vitro toxicology assay kit was purchased from Sigma-Aldrich.
Culturing and maintenance of Ganoderma spp
The cultures of Ganoderma spp. were collected from forest near Pollachi, Tamilnadu, India. Culturing and maintenance were followed as described previously.Citation53–Citation55 Briefly, the mycelia were cultured on potato dextrose agar and incubated at 28°C ±2°C for 7 days. The mycelia were then transferred to glucose yeast malt peptone broth. The inoculated medium was incubated at 28°C ±2°C and agitated at 150 rpm for 10 days. After incubation, the mycelia were harvested and washed with distilled water. The mycelia were freeze-dried and stored at 4°C in air-tight containers prior to use.
Preparation of mycelia hot aqueous extract
The preparation of mushroom extract was carried out according to the method described previously.Citation53–Citation55 In brief, the freeze-dried mycelia were soaked in distilled water at a ratio of 1:20 and double-boiled for 30 minutes, left to cool, and filtered through Whatman filter paper No 4. The hot aqueous extract was then freeze-dried at −50°C ±2°C for 48 hours and stored at 4°C in airtight containers. The freeze-dried hot aqueous extract of the mycelia was used as the reducing and stabilizing agent for the reduction of GO.
Synthesis of GO
Synthesis of GO was followed as described previously.Citation8,Citation32–Citation35 In a typical synthesis process, natural Gt powder (2 g) was added to cooled (0°C) H2SO4 (350 mL), and then KMnO4 (8 g) and NaNO3 (1 g) were added gradually while stirring. The mixture was transferred to a 40°C water bath and stirred for 60 minutes. Deionized water (250 mL) was slowly added and the temperature was increased to 98°C. The mixture was maintained at 98°C for a further 30 minutes and the reaction was terminated by the addition of deionized water (500 mL) and 30% H2O2 solution (40 mL). The color of the mixture changed to brilliant yellow, indicating the oxidation of pristine Gt to Gt oxide. The mixture was then filtered and washed with diluted HCl to remove metal ions. Finally, the product was washed repeatedly with distilled water until pH 7.0 was achieved and the synthesized Gt oxide was further sonicated by ultrasonication for 15–30 minutes.
Reduction of GO by GE
Reduction of GO was performed as described previously.Citation8,Citation32–Citation35 In typical synthesis, a mixed aqueous solution containing GO (1 mg/mL) and GE (1 mg/mL) was ultrasonicated for 15 minutes and the mixture was maintained at 40°C for 24 hours. The change of color from yellow-brown to black took place after 24 hours, whereas no color change was observed either in the solution kept without GO or in culture filtrate alone. The mixture was then cooled to room temperature and ultrasonicated for a further 10 minutes. Finally, a homogeneous GE-rGO suspension was obtained without aggregation. After the reduction process, the stable black dispersion was sonicated for 5 minutes to disperse the fungal extract from graphene materials and then centrifuged at 10,000 rpm for 10 minutes to remove fungal extract as a supernatant liquid.
Characterization
Characterization of GO and GE-rGO were carried out according to methods described previously.Citation32–Citation35 Ultraviolet-visible (UV-vis) spectra were recorded using a WPA Biowave II spectrophotometer (Biochrom, Cambridge, UK). The particle sizes of the GO and GE-rGO dispersions were measured using a Zetasizer Nano ZS90 instrument (Malvern Instruments, Malvern, UK). X-ray diffraction (XRD) analyses were performed in a Bruker D8 DISCOVER X-ray diffractometer (Bruker AXS GmBH, Karlsruhe, Germany). The X-ray source was 3 kW with a Cu target, and high-resolution XRD patterns were measured using a scintillation counter (λ =1.5406 Å). The XRD was run at 40 kV and 40 mA, and samples were recorded at 2θ values between 5° and 80°. The dried powder of GO and GE-rGO was diluted with potassium bromide and recorded Fourier transform infrared spectroscopy (FTIR) (PerkinElmer, Waltham, MA, USA) and spectrum within the range of 500–4,000 cm−1. The chemical bonding of carbon was investigated using X-ray photoelectron spectroscopy (XPS). A JSM-6700F semi-in-lens field emission scanning electron microscope was used to acquire scanning electron microscopy (SEM) images. The solid samples were transferred to a carbon tape held in an SEM sample holder, and then the analyses were performed at an average working distance of 6 mm. Raman spectra of GO and GE-rGO were measured using a WITEC Alpha300 laser with a wavelength of 532 nm. Calibration was initially performed using an internal silicon reference at 500 cm−1 and gave a peak position resolution of less than 1 cm−1. The spectra were measured from 500 to 4,500 cm−1. All samples were deposited onto glass slides in powdered form without using any solvent. Surface images were measured using tapping-mode atomic force microscopy (SPA 400; Seiko Instruments Inc., Chiba, Japan) operating at room temperature. Height and phase images were recorded simultaneously using nanoprobe cantilevers (SI-DF20; Seiko Instruments Inc.).
Cell culture and exposure to GE, GO, and GE-rGO
Cell culture and treatment were followed according to methods described previously.Citation34 MDA-MB-231 human breast cancer cells were kindly provided by Kyung Jin Lee, Institute for Life Sciences, ASAN Medical Center, University of Ulsan College of Medicine, Seoul, South Korea. MDA-MB-231 breast cancer cell lines were grown adherently and maintained in DMEM containing 10% fetal calf serum; and 1% antibiotic solution containing penicillin, and streptomycin at 37°C in 5% CO2. All experiments were performed in six-well plates, unless stated otherwise. Cells were seeded onto the plates at a density of 1×10⁶ cells per well and incubated for 24 hours prior to the experiments. The cells were washed with phosphate-buffered saline ([PBS] pH 7.4) and incubated in fresh medium containing different concentrations of GO and GE-rGO dissolved in water. GO or GE-rGO suspensions were freshly prepared before the cells were exposed, and were diluted to appropriate concentrations from 0 to 150 μg/mL with the culture medium, then immediately applied to the cells. Cells that were not treated with GO or GE-rGO served as controls in each experiment. Similarly, another control experiment was also performed with various concentrations of GE without GO or GE-rGO.
Cell viability assay
WST-8 assay was followed as described previously.Citation34,Citation43 Typically, 1×10⁴ cells were seeded in a 96-well plate and cultured in DMEM supplemented with 10% fetal bovine serum at 37°C under 5% CO2. After 24 hours, the cells were washed twice with 100 μL of serum-free DMEM and incubated with 100 μL of different concentrations of GO or GE-rGO suspensions in serum-free DMEM. After 24 hours’ exposure, the cells were washed twice with serum-free DMEM and 15 μL of WST-8 solution was added to each well containing 100 μL of serum-free DMEM. After a 1 hour incubation at 37°C under 5% CO2, 80 μL of the mixture was transferred to another 96-well plate, because residual GO or GE-rGO can affect the absorbance values at 450 nm. The absorbance of the mixture solutions was measured at 450 nm using a microplate reader. The cell-free control experiments were performed to see if the GO and GE-rGO reacted directly with the WST-8 reagents. Typically, 100 μL of GO or GE-rGO suspensions with different concentrations (0–150 μg/mL) were added to a 96-well plate and 10 μL of WST-8 reagent solution was added to each well; the mixture solution was incubated at 37°C under 5% CO2 for 1 hour. After incubation, the GO or GE-rGO were centrifuged and 50 μL of supernatant was transferred to another 96-well plate. The optical density was measured at 450 nm.
Membrane integrity
Cell membrane integrity of MDA-MB-231 human breast cancer cells was evaluated by determining the activity of lactate dehydrogenase (LDH) leaking out of the cell, according to the manufacturer’s instructions (TOX7 in vitro toxicology assay kit; Sigma-Aldrich) and also as per a method described previously.Citation34 Briefly, cells were exposed to various concentrations of GO and GE-rGO (0–150 μg/mL) for 24 hours and then 100 μL per well of each cell-free supernatant was transferred in triplicate into wells in a 96-well plate, and 100 μL of LDH assay reaction mixture was added to each well. After 3 hours of incubation under standard conditions, the optical density of the color generated was determined at a wavelength of 490 nm using a microplate reader.
Determination of ROS
ROS were estimated according to methods described previously.Citation34 Intracellular ROS were measured based on the intracellular peroxide dependent oxidation of 2′,7′-dichlorodihydrofluorescein diacetate ([DCFH-DA]; Molecular Probes®; Life Technologies) to form the fluorescent compound 2′,7′-dichlorofluorescein, as previously described. Cells were seeded onto 24-well plates at a density of 5×10⁴ cells per well and cultured for 24 hours. After washing twice with PBS, fresh medium containing 100 μg/mL concentrations of GO or GE-rGO was added and the cells incubated for 24 hours, after which 20 μM of DCFH-DA was add to the cells, and incubation continued for 30 minutes at 37°C. The cells were rinsed with PBS, 2 mL of PBS was added to each well, and fluorescence intensity was determined with a spectrofluorometer (Gemini EM) with excitation at 485 nm and emission at 530 nm. For control, 20 μM of DCFH-DA was added to the cells, and the cells were grown for 24 hours without graphene. To determine the effect of N-acetylcystein (NAC) in the presence of graphene, the cells were incubated with 5 mM NAC for 1 hour prior to exposing them to graphene materials or 1 mM H2O2 for 24 hours. DCFH-DA (20 μM) was then added and the cells were incubated for 30 minutes at 37°C before changes in 2′,7′-dichlorofluorescein fluorescence were measured.
Results and discussion
Synthesis and characterization of GO and GE-rGO
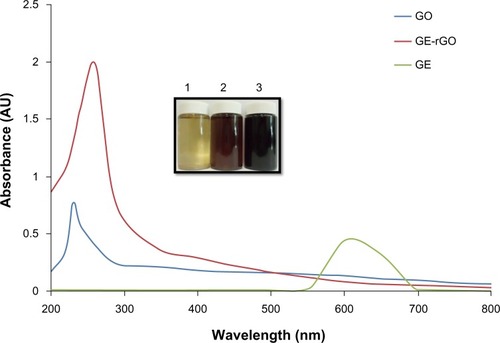
Twenty milligrams of mushroom extract powder was added to 20 mL of deionized water and then sonicated for 30 minutes to obtain a homogeneous dispersion. Then, 1 mg/mL of GO was added to 20 mL of GE dispersion (1 mg/mL), and the mixture was kept at 37°C for 24 hours. After reduction, homogeneous black dispersion was obtained (, inset), which has been stable for more than 6 months without precipitation. A distinctive color change from brown to black indicates the partial restoration of the π network between the sheets due to removal of the oxygen-containing bonds resulting in electronic conjugation within reduced sheetsCitation31–Citation35,Citation39,Citation56,Citation57 and also confirms the reduction of GO. Further, the reduction of GO was proved using UV-vis absorption spectroscopy; the absorption spectra showed that the peak of the GO suspension was around 230 nm, while the absorption peaks of the reduced suspensions shifted into wavelengths of around 260 nm, corresponding to deoxygenation of the GO suspension under the reduction processes.Citation39 After completion of the deoxidization process, the peak was red-shifted to 265 nm and, at the same time, the absorbance in the whole spectral region was increased dramatically (). The UV-vis spectrum of the GO solution revealed a characteristic absorption band at 230 nm corresponding to π-π* transitions of the aromatic C=C bond and n-π* transitions of the C=O bond in GO, respectively. After reduction of GO by GE, the peak at 230 nm shifted to 265 nm, which suggests that electronic conjugation was restored (). This result also suggests that GO was successfully reduced by GE and that the aromatic structure of graphene may have been restored.Citation31–Citation35 Similar findings were observed at 270.9 nm for Colocasia esculenta leaf aqueous extract-reduced GO and at 268 nm for both Mesua ferrea Linn leaf aqueous extract-reduced GO and Clonorchis sinensis peel aqueous extracts-reduced GO.Citation58 These data indicate that the electronic conjugation was restored. We also examined the absorption spectrum of GE extract, which showed one peak between 550 and 650 nm, which is completely different from the absorption spectra of GO and GE-rGO.
Figure 1 Synthesis and characterization of GE-rGO by ultraviolet-visible spectroscopy.
Notes: The inset shows an aqueous solution of GE 1) and aqueous dispersions of GO before 2) and after 3) the reduction with GE. Spectra of GO exhibited a maximum absorption peak at approximately 230 nm, which corresponds to a π-π transition of aromatic C–C bonds. The absorption peak for reduced GO was red-shifted to 265 nm. The phenomenon of red-shift is used as a tool for monitoring the reduction of GO. At least three independent experiments were performed for each sample and reproducible results were obtained. Data from a representative experiment are shown.
Abbreviations: AU, arbitrary units; GE, Ganoderma extract; GO, graphene oxide; GE-rGO, GE-reduced GO.
XRD analyses of GO and GE-rGO
The crystal structures of GO and GE-rGO were confirmed using XRD analysis.Citation31–Citation35 show the XRD spectra of GO and GE-rGO, respectively. The characteristic peak of GO appeared at 2θ =11.8 nm, corresponding to a d-spacing of 0.74 nm due to the formation of hydroxyl and epoxy and carboxyl groups (). In contrast to GO, the GE-rGO showed no peaks at 11.8°, suggesting that most of the oxygen functional groups of GO were removed, while the presence of an intense diffraction peak at around 26.5° suggests that the typical π stacking of the GO was functionalized by GE. This also indicates that the GE played an important role in deoxygenation of GO. The higher interlayer spacing value of exfoliated GO was due to the introduction of numerous oxygenated functional groups on the carbon sheets.Citation6,Citation8,Citation18,Citation19,Citation32 After the exfoliated GO was reduced by GE, a new diffraction peak was observed (2θ =26.5°; d-spacing =0.34 nm). This new and sharp peak at 2θ =26.5° indicates a highly organized crystal structure with an interlayer spacing of 0.34 nm (). Our results are in agreement with earlier results.Citation12,Citation59
Figure 2 XRD patterns of GO and GE-rGO.
Notes: In the XRD pattern of GO (A), the strong and sharp peak at 2θ =11.8° corresponds to an interlayer distance of 7.6 Å. GE-rGO (B) has a broad peak centered at 2θ =26.5°, which corresponds to an interlayer distance of 3.4 Å. These XRD results are related to the reduction of GO by GE and the process of removing intercalated water molecules and oxide groups. At least three independent experiments were performed for each sample and reproducible results were obtained. Data from a representative experiment are shown.
Abbreviations: AU, arbitrary units; GE, Ganoderma extract; GO, graphene oxide; GE-rGO, GE-reduced GO; XRD, X-ray diffraction.
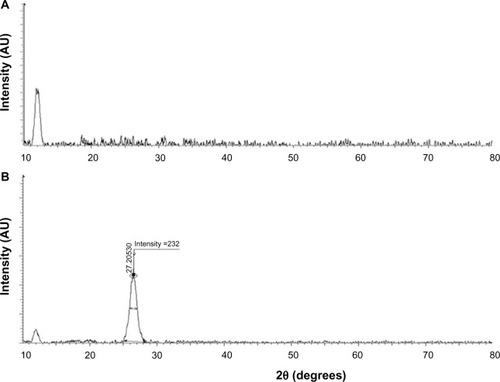
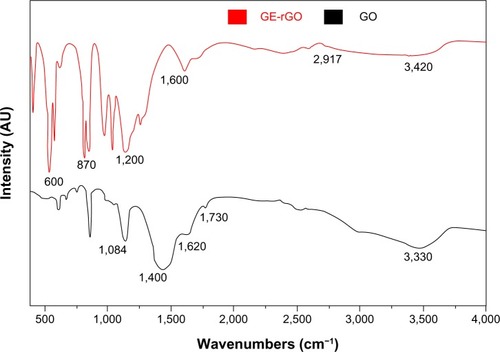
Figure 3 Fourier transform infrared spectroscopy spectra of GO and GE-rGO.
Abbreviations: AU, arbitrary units; GE, Ganoderma extract; GO, graphene oxide; GE-rGO, GE-reduced GO.
FTIR spectra of GO and GE-rGO
shows FTIR spectra of the GO and GE-rGO. Strong absorption peaks were observed at 3,330, 1,730, 1,620, 1,400, and 1,084 cm−1, due to the vibration and deformation bands of O–H and C=O stretching vibrations from carbonyl groups, C=C configurable vibrations from the aromatics, C–OH stretching vibrations, C–O vibrations from epoxy groups, and C–O vibrations from alkoxy groups, respectively;Citation32,Citation35 however, most of the peaks related to the oxygen-containing functional groups were removed in the FTIR spectrum of GE-rGO, suggesting that these oxygen-containing functional groups were removed in the process of reduction using mushroom extracts. Interestingly, some new peaks also appeared in the spectra of GE-rGO at 1,200 and 1,600 cm−1, attributed to the skeletal vibration of the graphene sheets. In addition, as shown in , GO had very strong peaks at 3,330 cm−1 (O–H), attributed to the water molecules, whereas, in the GE-rGO sample, the intensities of the bands associated with the oxygen functional groups were significantly decreased.Citation32,Citation35,Citation56–Citation60
XPS analysis of GO and GE-rGO
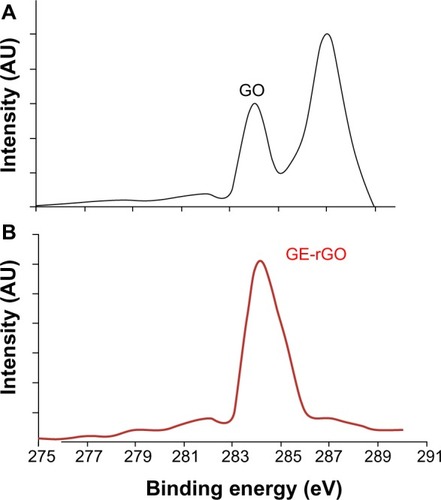
XPS is a valuable technique for determining the elemental composition, empirical formula, chemical state, and electronic state of elements.Citation31 XPS was used to investigate chemical analysis of GO and GE-rGO. The binding energy of 285.0 eV was designated to the C–C, C=C, and C-H bonds on the surface of the sheets. shows the C1s XPS spectrum of GO, which had two large peaks at 284.6 eV, corresponding to spCitation2 carbon components, and at 286.7 eV, corresponding to C–O single-bond components of hydroxyl and epoxide.Citation6,Citation9,Citation31 The peaks corresponding to those oxygen functional groups in the spectrum of GE-rGO were significantly decreased after reduction by mushroom extract.Citation31 The spectrum of GE-rGO indicates that the mushroom extracts removed a significant number of oxygen components from GO. Furthermore, the results showed a significant decrease of oxygenated carbon-related signals at 286–289 eV after reduction (), revealing that most of the epoxide, hydroxyl, and carboxyl functional groups were removed after the reduction. Akhavan and Ghaderi performed the reduction of chemically exfoliated GO with E. coli bacteria in mixed-acid fermentation with an anaerobic condition at different times. They showed that, as the exposure time increased (from 0 to 48 hours), the oxygen-containing functional groups of the GO decreased by 60%, indicating a relative chemical reduction of the sheets by interaction with the bacteria.Citation7 Khanra et al, using baker’s yeast as a reducing agent, demonstrated successful reduction of GO, in which most of the oxygen functionalities were removed efficiently and the majority of the conjugated graphene networks were restored after the reduction.Citation31 Taking these results together, the biological material is another alternative source for the preparation of graphene.
Figure 4 X-ray photoelectron spectroscopy analysis of GO (A) and GE-rGO (B).
Abbreviations: AU, arbitrary units; GE, Ganoderma extract; GO, graphene oxide; GE-rGO, GE-reduced GO.
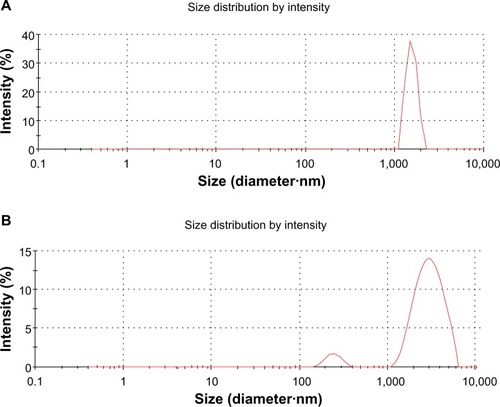
Size distribution analysis of GO and GE-rGO by dynamic light scattering
The lateral size distributions of GO and GE-rGO were evaluated using dynamic light scattering (DLS).Citation8,Citation32–Citation34,Citation38 DLS measurements were performed in an aqueous solution to elucidate the size of GE-rGO after reduction of GO with a low concentration (250 μg/mL) of GE-rGO. The average hydrodynamic diameter of GO was found to be 1,880±20 nm, whereas the average hydrodynamic diameter of GE-rGO showed a size of 3,200±50 nm (). This obvious change in the size distribution indicated that GO was functionalized on the surfaces, with the resulting rGO leading to an increased Brownian motion rate after the reduction process.Citation60 Since the particles in the DLS analysis were assumed to be spherical, and could only be used to reflect the trend of changes in the size of graphene, the DLS results can reveal only the size differences between GO and rGO.Citation38,Citation60 Stankovich et alCitation13 reported that functionalized graphene nanoplates treated with isocyanate produce a DLS peak of 560±60 nm, which is not their average dimension but rather the effective hydrodynamic diameter of an equivalent sphere described by the tumbling of the platelets.
Figure 5 DLS characterizations of GO and GE-rGO.
Notes: Aqueous dispersions of GO (A) and GE-rGO (B) were characterized by DLS analysis using a particle size analyzer at the scattering angle θ =90°. The data show the average values from triplicate measurements. The sample concentrations were all 250 μg/mL.
Abbreviations: DLS, dynamic light scattering; GE, Ganoderma extract; GO, graphene oxide; GE-rGO, GE-reduced GO.
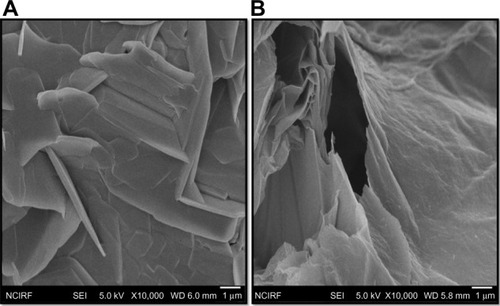
Morphological analyses of GO and GE-rGO by SEM
In order to understand the lateral sizes of GO and GE-rGO, the dispersions were dropped onto aluminum foil, and dozens of SEM images were taken randomly for each sample. The morphology of SEM pictures of GO and GE-rGO are presented in . SEM images showed GO as multilayered, wavy, folded flakes (). GE-rGO images revealed that the reduced GO material consisted of several layers stacked on top of one another like sheets of paper, with silky, wrinkled, and flower-like curling morphology. The SEM images of GE-rGO revealed that most of the GO was efficiently reduced to ultrathin sheets with wavy and porous structures of graphene (). This biologically synthesized graphene showed similar agreement with earlier graphene sheets that were prepared from Gt powder through oxidation followed by rapid thermal expansion in nitrogen atmosphere.Citation61 The graphene sheets were found to possess a curled morphology consisting of a thin, wrinkled, paper-like structure, with fewer layers (approximately four layers) and a large specific surface area.Citation61 This difference in morphology between the folded, stacked structure of GO and the folded structures of reduced graphene suggests that the GE reduction process played a significant role in the transformation of GO to graphene.
Figure 6 SEM images of GO and GE-rGO.
Note: Representative SEM images of GO (A) and GE-rGO (B) dispersions at 500 μg/mL.
Abbreviations: GE, Ganoderma extract; GO, graphene oxide; GE-rGO, GE-reduced GO; SEM, scanning electron microscopy.
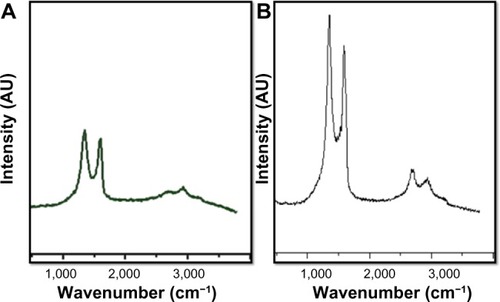
Raman spectra of GO and GE-rGO
Raman spectroscopy is a valuable, nondestructive technique by which to characterize ordered and disordered crystal structures of carbon.Citation62 Raman spectroscopy is a rapid way to obtain information about the structure and quality of carbon materials.Citation63 The typical features of carbon in Raman spectra are the G-band around 1,582 cm−1 and the D-band around 1,350 cm−1. The G-band is usually assigned to the E2g phonon of C spCitation2 atoms, while the D-band is a breathing mode of κ-point phonons of A1g symmetry.Citation64 The Raman spectrum of the GO displayed a strong G-band at 1,608 cm−1 and a D-band at 1,355 cm−1 (). In the Raman spectrum of GE-rGO, the G-band was broadened and shifted upward to 1,587 cm−1. At the same time, the intensity of the D-band at 1,351 cm−1 was substantially increased (). These phenomena could be attributed to the significant decrease of the size of the in-plane spCitation2 domains due to oxidation and ultrasonic exfoliation and the partially ordered Gt crystal structure of graphene nanosheets.Citation13 The data obtained from Raman spectra of GE-rGO provided evidence for a structural change due to the process of reduction by Ganoderma spp. extracts; the G-peak and D-peak were both widened and were shifted to approximately 1,587 cm−1 and 1,351 cm−1, respectively (). Interestingly, the D/G intensity ratio of GE-rGO (2.1) was higher than that of GO (1.8), indicating the introduction of spCitation3 defects after functionalization and incomplete recovery of the structure of graphene.Citation65 However, the increase in the D/G intensity ratio, compared to pristine Gt, indicates a decrease in the size of the in-plane spCitation2 domains and a partially ordered crystal structure of the GE-rGO.Citation64 Variations in the relative intensities of the G-peak and D-peak indicate a change in the electronic conjugation state. This change suggests an increase in the number of spCitation2 domains following reduction of GO.Citation63 The results of the present study agree with those of previous reports that used various biological molecules, such as vitamin C, reducing sugars, melatonin, yeast, bacteria, and phytoextracts, for synthesis of graphene.Citation8,Citation31,Citation32,Citation56,Citation58,Citation66
Figure 7 Raman spectroscopy analyses of GO and GE-rGO samples.
Notes: Raman spectra were obtained using a laser excitation of 532 nm at a power of <1 mW. The figure shows representative Raman spectra of GO and GE-rGO samples after removal of the fluorescent background. The intensity ratios of the D-peak to the G-peak were 1.8 and 2.1 for GO (A) and GE-rGO (B), respectively. At least three independent experiments were performed for each sample and reproducible results were obtained.
Abbreviations: GE, Ganoderma extract; GO, graphene oxide; GE-rGO, GE-reduced GO.
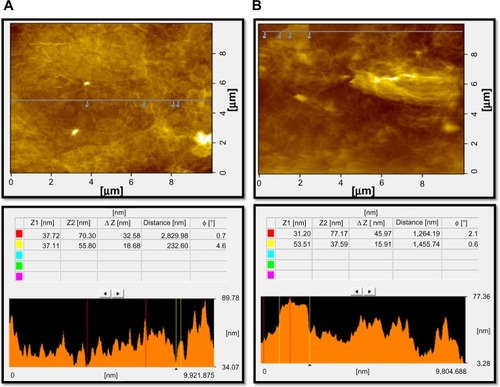
Surface and height profile of GO and GE-rGO by atomic force microscopy
Further characterization of GO and GE-rGO was carried out using atomic force microscopy (AFM) to measure the surface and height profiles. show typical AFM images of GO and GE-rGO dispersions in water, after their deposition on a freshly cleaned glass surface. The average thickness of as-prepared GE-rGO, measured from the height profile of the AFM image, was about 45.97 nm, whereas GO showed a thickness of about 32.58 nm: that is, the thickness of GE-rGO was greater than that of GO. Our findings suggest that the reducing properties of mushroom extract could account for the increasing of the thickness of GE-rGO through removal of oxygen-containing functional groups in GO. Similarly, Stankovich et alCitation13 reported that GO sheets are thicker due to the presence of covalently bound oxygen and the displacement of the spCitation3 hybridized carbon atoms slightly above and below the original graphene plane. Zhu et alCitation16 reported that the average thickness of as-prepared graphene nanosheets was increased when compared to well-exfoliated GO sheets, which was due to the capping reagent’s important role in increasing the thickness. Melatonin-reduced GO showed greater thickness than GO, which was due to the adsorption of reductant entities.Citation66
Figure 8 Surface and thickness analysis of GO (A) and GE-rGO (B) by atomic force microscopy.
Abbreviations: GE, Ganoderma extract; GO, graphene oxide; GE-rGO, GE-reduced GO.
Effects of GE, GO, and GE-rGO on MDA-MB-231 human breast cancer cells
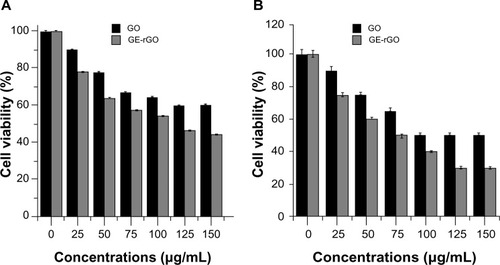
In this experiment, we evaluated the impacts of GE, GO, and GE-rGO on the viability, LDH leakage, and ROS generation in breast cancer cells. The functions of graphene materials are different due to their physicochemical characteristics. In order to confirm the inhibitory effect of GE, we first treated cells with various concentrations of extracts of Ganoderma spp. (0–1,000 μg/mL) for 24 hours. The results suggested that the MDA-MB-231 cells treated with GE had no significant effect on cell viability () and that GE neither inhibited nor promoted the cell viability in tested concentrations. Further, we examined the cytotoxic effects of GO and GE-mediated GE-rGO on MDA-MB-231 human breast cancer cells using WST-8, which did not react with graphene materials.Citation43 As shown in , the GO-treated groups exhibited low cytotoxicity at concentrations of 50 μg/mL and lower, whereas, in GE-rGO treated cells, the cell viability rate decreased correspondingly dependant on concentrations and the effect was significantly higher than in GO-treated groups. These results suggest that the effect was dose dependent both in GO and GE-rGO. Incubation with GO for 24 hours displayed dramatic cell death (40%) at the highest concentration, 150 μg/mL (P<0.05), compared with controls, whereas treatment with GE-rGO significantly reduced the cell viability by up to 60% at the concentration of 75 μg/mL (P<0.05). Further, we examined the impact of GO and GE-rGO on cells at a longer exposure time (48 hours). Interestingly, GE-rGO-treated cells showed a more prominent inhibitory effect than GO-treated (). Wang et alCitation41 observed that GO was indeed internalized into the cells, located mainly inside cytoplasm such as lysosomes, mitochondrion, and endoplasm, which was one of the reasons for cell death. Li et alCitation67 demonstrated that pristine graphene induces cytotoxicity through the mechanism of maintaining the level of mitochondrial membrane potential in the cells and the generation of ROS, then causing apoptosis by the activation of the mitochondrial pathway. Akhavan et alCitation68 estimated cell viability using concentration- and size-dependent graphene sheets and nanoplatelets. They found significant cell destruction by 1.0 μg/mL of rGO nanoplatelets with average lateral dimensions of 11 nm, while the rGO sheets with average lateral dimensions of 3.8 μm could exhibit a significant cytotoxic effect only at a high concentration (100 μg/mL) after a 1 hour exposure in human mesenchymal stem cells.Citation68 Akhavan et al concluded that concentration and size play an important role in toxicity of graphene materials in human mesenchymal stem cells.Citation68 Jaworski et alCitation69 reported that cell viability was significantly reduced using a concentration of 100 μg/mL, resulting in a survival rate of 54% in U87 cells and 60% in the U118 line. Akhavan and Ghaderi suggested that the cytotoxicity of the non-aggregated reduced GO sheets was due to extremely sharp edges and charge transfer between the cells and graphene materials.Citation6 Wang et al proposed a mechanism for graphene-induced cell death, in which graphene interacts with the cell surface and sends a signal that leads to downregulation, causing cells to detach, float, and shrink; or graphene enters into cytoplasm and the nucleus, disturbing the cell metabolism and inducing cell apoptosis and death.Citation41
Figure 9 Effect of GE on cell viability of MDA-MB-231 human breast cancer cells.
Notes: Cell viability of MDA-MB-231 human breast cancer cells was determined using WST-8 assay after 24 hours’ exposure to different concentrations of GE. The results represent the means of three separate experiments, and error bars represent the standard error of the mean. GE groups showed no statistically significant differences from the control group by the Student’s t-test (P<0.05).
Abbreviations: AU, arbitrary units; GE, Ganoderma extract.
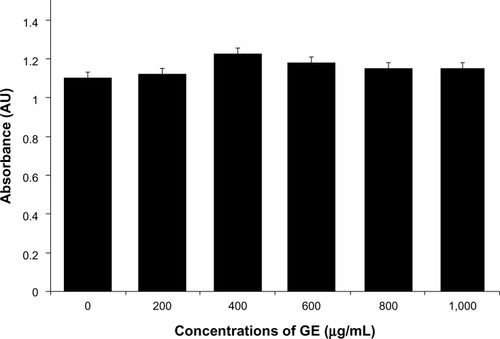
Figure 10 Effects of GO and GE-rGO on cell viability of MDA-MB-231 human breast cancer cells.
Notes: Cell viability of MDA-MB-231 human breast cancer cells was determined using WST-8 assay after 24 hours’ (A) and 48 hours’ (B) exposure to different concentrations of GO or GE-rGO. The results represent the means of three separate experiments, and error bars represent the standard error of the mean. GO- and GE-rGO-treated groups showed statistically significant differences from the control group by the Student’s t-test (P<0.05).
Abbreviations: GE, Ganoderma extract; GO, graphene oxide; GE-rGO, GE-reduced GO.
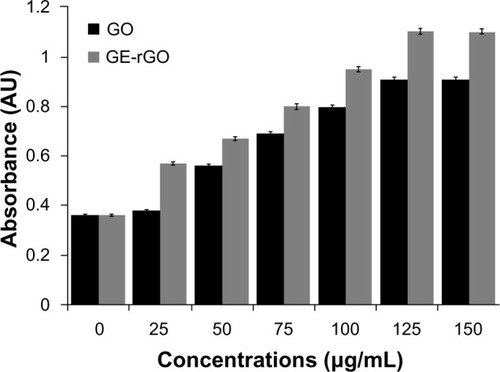
GE-rGO activates the leakage of LDH
The impact of GO and GE-rGO on LDH leakage in human breast cancer cells was evaluated using an LDH leakage assay. Intracellular LDH released into the culture medium was also used as an indicator of cytotoxicity. Cells were exposed to 0–150 μg/mL of GO and GE-rGO for 24 hours. Both GO and GE-rGO induced cell death in a dose-dependent manner after 24 hours’ incubation, as determined by WST-8 assay. After 24 hours of treating cells with GO and GE-rGO, cytotoxic effects occurred at a given concentration between 25 and 150 μg/mL. As we expected, 24 hours of treatment with 25–150 μg/mL of GE-rGO led to significantly (P<0.05) higher LDH activity in the cell culture medium than in untreated and GO-treated cells (). It is evident that the GE-rGO shows higher leakage of LDH to the medium occurred at higher concentrations (100 and 150 μg/mL). Jaworski et alCitation69 suggested that membrane integrity was significantly disrupted in U87 cells, even with a lower concentration of graphene platelets.
Figure 11 Effects of GO and GE-rGO on lactate dehydrogenase activity in MDA-MB-231 human breast cancer cells.
Notes: Lactate dehydrogenase activity was measured by changes in optical densities due to NAD+ reduction, monitored at 490 nm, using the cytotoxicity detection lactate dehydrogenase kit. The results represent the means of three separate experiments, and error bars represent the standard error of the mean. GO- and GE-rGO-treated groups showed statistically significant differences from the control group by the Student’s t-test (P<0.05).
Abbreviations: AU, arbitrary units; GE, Ganoderma extract; GO, graphene oxide; GE-rGO, GE-reduced GO; NAD, Nicotinamide adenine dinucleotide.
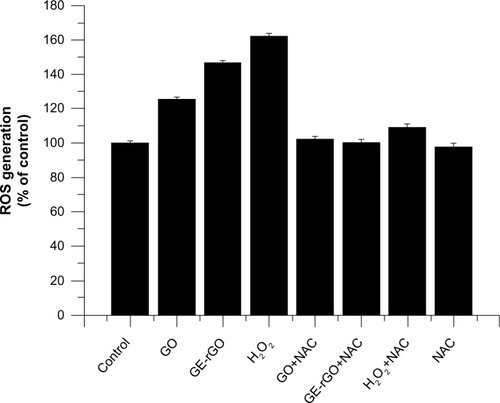
GE-rGO induces oxidative stress
ROS generation and the induction of oxidative stress seem to be the most possible mechanisms of toxic effects of inhaled nanoparticles.Citation70 ROS are induced upon exposure of cells to various environmental free radicals, and toxicity is thereby increased. In order to see the material effects of GO and GE-rGO, cells were treated with a lower concentration (100 μg/mL) and ROS generation was quantified. The results suggest that both GO and GE-rGO induce ROS: GO increased ROS by 20% compared to control, whereas GE-rGO and H2O2 increased ROS by 40% and 60%, respectively, when compared to control (). The increased ROS induced by GO and GE-rGO on cancer cells decreased when the cells were treated with 5 mM of NAC.Citation8 Taken together, these results indicate that cell death is mediated by ROS production, which might alter the balance of cellular redox status in the cells.Citation8 Akhavan and GhaderiCitation6 suggested that the toxicity of bacteria death caused by nanowalls was due to sharpening of the edges of the nanowalls, and possibly by stronger contact interaction with the cell membrane and/or better charge transfer between the bacteria and the reduced nanowalls.Citation6,Citation8 These results provide evidence that GO and GE-rGO induce oxidative stress in cancer cells, which could be due to a strong interaction of cells with reduced rGO that eventually leads to loss of glutathione content in the cells. Sarkar et alCitation71 demonstrated that single walled carbon nano tube (SWCNT) induces ROS in a dose-dependent manner in lung epithelial cells and human keratinocytes. The same group reported that SWCNT-treated BJ Foreskin cells showed significant increase in ROS at concentrations of 6 μg/mL in a dose- and time-dependent manner.Citation71 Li et alCitation67 showed that pristine graphene exposure induced intracellular ROS generation in a time- and dose-dependent manner and also demonstrated that loss of viability depends on sizes (l-GO, m-GO, and s-GO), concentrations, and exposure times of cells with graphene materials.Citation42 The high surface areas of graphene-family nanomaterials (GFNs) induce ROS production, antioxidant deactivation, and ROS quenching.Citation72,Citation73 Biologically synthesized graphene induces dose-dependent ROS generation in human breast cancer cells.Citation33 Duch et alCitation74 observed that GO causes persistent lung injury due to increased rates of mitochondrial respiration, activation of inflammatory responses, the generation of ROS, and induction of apoptosis. Earlier studies have suggested generation of ROS one of the important mechanisms of cytotoxicity of graphene.Citation40,Citation42 Many studies suggest that the mechanisms of toxicity is by direct-contact interaction of extremely sharp edges of graphene nanowalls with wall membrane, Akhavan et alCitation6 proposed mechanisms of toxicity of graphene materials and the other mechanism involves the potential for graphene to block the delivery of nutrients to cancer cells by adhering to cell membranes through cell membrane surface receptors.Citation69,Citation75 Taking the literature and the present study into account, we suggest that ROS generation could be one of the important mechanisms of cell death, both in bacteria and eukaryotic cells.
Figure 12 Effects of GO and GE-rGO on generation of ROS in MDA-MB-231 human breast cancer cells.
Notes: The relative fluorescence of 2′,7′-dichlorofluorescein was measured using a spectrofluorometer with excitation at 485 nm and emission at 530 nm. The results represent the means of three separate experiments and the error bars represent the standard error of the mean. Treated groups (GO, GE-rGO, and H2O2) showed statistically significant differences from the control group, as determined by Student’s t-test (P<0.05).
Abbreviations: GE, Ganoderma extract; GO, graphene oxide; GE-rGO, GE-reduced GO; H2O2, hydrogen peroxide; NAC, N-acetylcystein; ROS, reactive oxygen species.
Conclusion
Due to the unique and interesting properties of graphene, its use has been explored in various biomedical and biotechnological applications, such as in biosensors, therapeutics, tissue engineering, and electronics. Herein, we described a simple, nontoxic, cost-effective, and eco-friendly biological approach for the reduction of GO using GE. This simple strategy achieves synthesis of homogeneous graphene using biological material as a reducing and stabilizing agent. The as-prepared graphene was characterized using various analytical techniques. The reduction of GO was confirmed by UV-vis spectroscopy. The crystalline nature, chemical analysis, structural and surface morphology, and thickness of graphene were determined using various analytical techniques. Furthermore, the cell viability, LDH leakage, and ROS assays suggested that GO and GE-rGO induce dose- and time-dependent cell death in MDA-MB-231 human breast cancer cells. Interestingly, GE-rGO showed a more significant effect than GO. The results suggest that this green approach could provide an easy method for the production of graphene in bulk quantities, and that GE-reduced GO sheets can be used as biocompatible and efficient agents in nanomedicine-based cancer therapies without the need to use toxic reagents such as hydrazine. To our knowledge, this is the first report describing the use of Ganoderma spp. extracts as a reducing agent for the preparation of graphene.
Acknowledgments
This paper was supported by the KU-Research Professor Program of Konkuk University. Dr Sangiliyandi Gurunathan was supported by Konkuk University KU-Full-time Professorship. This work was supported by the Woo Jang-Choon project (PJ007849) and the next generation of Biogreen 21 (PJ009107) from the Rural Development Administration (RDA), Republic of Korea.
Disclosure
The authors report no conflicts of interest in this work.
References
- NovoselovKSGeimAKMorozovSVElectric field effect in atomically thin carbon filmsScience2004306569666666915499015
- GeimAkNovoselovKSThe rise of grapheneNat Mater20076318319117330084
- AkhavanOGhaderiERahighiRToward single-DNA electrochemical biosensing by graphene nanowallsACS Nano2012642904291622385391
- MohantyNBerryVGraphene-based single-bacterium resolution biodevice and DNA transistor: interfacing graphene derivatives with nanoscale and microscale biocomponentsNano Lett20088124469447619367973
- HuWPengCLuoWGraphene-based antibacterial paperACS Nano2010474317432320593851
- AkhavanOGhaderiEToxicity of graphene and graphene oxide nanowalls against bacteriaACS Nano20104105731573620925398
- AkhavanOGhaderiEEscherichia coli bacteria reduce graphene oxide to bactericidal graphene in a self-limiting mannerCarbon201250518531860
- GurunathanSHanJWDayemAAEppakayalaVKimJHOxidative stress-mediated antibacterial activity of graphene oxide and reduced graphene oxide in Pseudomonas aeruginosaInt J Nanomedicine201275901591423226696
- AkhavanOChoobtashaniMGhaderiEProtein degradation and RNA efflux of viruses photocatalyzed by graphene–tungsten oxide composite under visible light irradiationJ Phys Chem C Nanomater Interfaces20121161796539659
- YangKZhangSZhangGSunXLeeSTLiuZGraphene in mice: ultrahigh in vivo tumor uptake and efficient photothermal therapyNano Lett20101093318332320684528
- LiuZRobinsonJTSunXDaiHPEGylated nanographene oxide for delivery of water-insoluble cancer drugsJ Am Chem Soc200813033108761087718661992
- KrishnaKVMénard-MoyonCVermaSBiancoAGraphene-based nanomaterials for nanobiotechnology and biomedical applicationsNanomedicine (Lond)201381669168824074389
- StankovichSDikinDAPinerRDSynthesis of graphene-based nanosheets via chemical reduction of exfoliated graphite oxideCarbon200745715581565
- CoteLJCruz-SilvaRHuangJFlash reduction and patterning of graphite oxide and its polymer compositeJ Am Chem Soc200913131110271103219601624
- ZhouMZhaiYDongSElectrochemical sensing and biosensing platform based on chemically reduced graphene oxideAnal Chem200981145603561319522529
- DreyerDRParkSBielawskiCWRuoffRSThe chemistry of graphene oxideChem Soc Rev20103922824020023850
- HassJde HeerWAConradEHThe growth and morphology of epitaxial multilayer grapheneJ Phys Condens Matter20082032323202
- AkhavanOGhaderiEJPhotocatalytic reduction of graphene oxide nanosheets on TiO2 thin film for photoinactivation of bacteria in solar light irradiationJ Phys Chem C Nanomater Interfaces2009113472021420220
- AkhavanOAbdolahadMEsfandiarAMohatashamifarMPhotodegradation of graphene oxide sheets by TiO2 nanoparticles after a photocatalytic reductionJ Phys Chem C Nanomater Interfaces2010114301295512959
- LiuNLiuQHuangYOrganic photovoltaic devices based on a novel acceptor material: grapheneAdv Mater2008202039243930
- SimpsonCDBrandJDBerresheimAJPrzybillaLRäderHJMüllenKSynthesis of a giant 222 carbon graphite sheetChemistry2002861424142911921226
- SubrahmanyamKSPanchakarlaLSGovindarajARaoCNRSimple method of preparing graphene flakes by an arc-discharge methodJ Phys Chem C Nanomater Interfaces20091131142574259
- WangZLiNShiZGuZLow-cost and large-scale synthesis of graphene nanosheets by arc discharge in airNanotechnology2010211717560220357411
- XuHSuslickKSSonochemical preparation of functionalized graphenesJ Am Chem Soc2011133249148915121604712
- SalasECSunZLüttgeATourJMReduction of graphene oxide via bacterial respirationACS Nano2010484852485620731460
- MinKHanTHKimJA facile route to fabricate stable reduced graphene oxide dispersions in various media and their transparent conductive thin filmsJ Colloid Interface Sci20123831364222795947
- FanXPengWLiYDeoxygenation of exfoliated graphite oxide under alkaline conditions: a green route to graphene preparationAdv Mater2008202344904493
- TangLALeeWCShiHHighly wrinkled cross-linked graphene oxide membranes for biological and charge-storage applicationsSmall20128342343122162356
- ZhangJYangHShenGChengPZhangJGuoSReduction of graphene oxide via L-ascorbic acidChem Commun (Camb)20104671112111420126730
- ZhuCGuoSFangYDongSReducing sugar: new functional molecules for the green synthesis of graphene nanosheetsACS Nano2010442429243720359169
- KhanraPKuilaTKimNHBaeSHYuDSLeeJHSimultaneous bio-functionalization and reduction of graphene oxide by baker’s yeastChem Eng J201218315526533
- GurunathanSHanJWEppakayalaVKimJHMicrobial reduction of graphene oxide by Escherichia coli: a green chemistry approachColloids Surf B Biointerfaces2013102177277723107955
- GurunathanSHanJWEppakayalaVJeyarajMKimJHAn environmentally friendly approach to the reduction of graphene oxide by Escherichia fergusoniJ Nanosci Nanotechnol20131332091209823755651
- GurunathanSHanJWEppakayalaVKimJHGreen synthesis of graphene and its cytotoxic effects in human breast cancer cellsInt J Nanomedicine2013811015102723687445
- GurunathanSHanJKimJHHumanin: a novel functional molecule for the green synthesis of grapheneColloids Surf B Biointerfaces2013111C37638323850746
- MaoXLiHChiral imaging in living cells with functionalized graphene oxideJ Mater Chem B Mater Biol Med2013142674272
- LiuLLiuJWangYYanXSunDDFacile synthesis of monodispersed silver nanoparticles on graphene oxide sheets with enhanced antibacterial activityNew J Chem201135714181423
- LiuSZengTHHofmannMAntibacterial activity of graphite, graphite oxide, graphene oxide, and reduced graphene oxide: membrane and oxidative stressACS Nano2011596971698021851105
- AkhavanOGhaderiERahimiKAdverse effects of graphene incorporated in TiO2 photocatalyst on minuscule animals under solar light irradiationJ Mater Chem2012222326023266
- ZhangYAliSFDervishiECytotoxicity effects of graphene and single-wall carbon nanotubes in neural phaeochromocytoma-derived PC12 cellsACS Nano2010463181318620481456
- WangKRuanJSongHBiocompatibility of graphene oxideNanoscale Res Lett201168
- ChangYYangSTLiuJHIn vitro toxicity evaluation of graphene oxide on A549 cellsToxicol Lett2011200320121021130147
- LiaoKHLinYSMacoskoCWHaynesCLCytotoxicity of graphene oxide and graphene in human erythrocytes and skin fibroblastsACS Appl Mater Interfaces2011372607261521650218
- FrankIWTanenbaumDMvan der ZandeAMMcEuenPLMechanical properties of suspended graphene sheetsJ Vaccum Science Technology B2007252558
- LeeCWeiXKysarJWHoneJMeasurement of the elastic properties and intrinsic strength of monolayer grapheneScience2008321588738538818635798
- LeeYBaeSJangHWafer-scale synthesis and transfer of graphene filmsNano Lett201010249049320044841
- SinghSKSinghMKKulkarniPPSonkarVKGrácioJJDashDAmine-modified graphene: thrombo-protective safer alternative to graphene oxide for biomedical applicationsACS Nano2012632731274022376049
- MukherjeePAhmadAMandalDFungus mediated synthesis of silver nanoparticles and their immobilization in the mycelial matrix: a novel biological approach to nanoparticle synthesisNano Lett2001110515519
- AhmadAMukherjeePSenapatiSExtracellular biosynthesis of silver nanoparticles using the fungus Fusarium oxysporumColloids Surf B Biointerfaces2003284313318
- BhainsaKCD’SouzaSFExtracellular biosynthesis of silver nanoparticles using the fungus Aspergillus fumigatesColloids Surf B Biointerfaces200647216016416420977
- KathiresanKManivannanSNabeelAMDhivyaBStudies on silver nanoparticles synthesized by a marine fungus, Penicillium fellutanum isolated from coastal mangrove sedimentColloids Surf B Biointerfaces200971113313719269142
- PhilipDBiosynthesis of Au, Ag and Au-Ag nanoparticles using edible mushroom extractSpectrochim Acta A Mol Biomol Spectrosc200973237438119324587
- GurunathanSRamanJAbd MalekSNJohnPAVikineswarySGreen synthesis of silver nanoparticles using Ganoderma neo-japonicum Imazeki: a potential cytotoxic agent against breast cancer cellsInt J Nanomedicine201384399441324265551
- ZhouXWSuKQZhangYMApplied modern biotechnology for cultivation of Ganoderma and development of their productsAppl Microbiol Biotechnol201293394196322170106
- LuQYJinYSZhangQGanoderma lucidum extracts inhibit growth and induce actin polymerization in bladder cancer cells in vitroCancer Lett2004216192015500944
- Fernández-MerinoMJGuardiaLParedesJIVitamin C is an ideal substitute for hydrazine in the reduction of graphene oxide suspensionsJ Phys Chem C Nanomater Interfaces20101141464266432
- LiDMüllerMBGiljeSKanerRBWallaceGGProcessable aqueous dispersions of graphene nanosheetsNat Nanotechnol20083210110518654470
- ThakurSKarakNGreen reduction of graphene oxide by aqueous phytoextractsCarbon2012501453315339
- DreyerDRParkSBielawskiCRuoffRSThe chemistry of graphene oxideChem Soc Rev20093922824020023850
- WangZNelsonJKHillborgHZhaoSSchadlerLSGraphene oxide filled nanocomposite with novel electrical and dielectric propertiesAdv Mater201224233134313722570307
- LianPZhuXLiangSLiZYangWWangHLarge reversible capacity of high quality graphene sheets as an anode material for lithium-ion batteriesElectrochim Acta2010551239093914
- WangGYangJParkJFacile synthesis and characterization of graphene nanosheetsJ Phys Chem C Nanomater Interfaces20081122281928195
- NiyogiSBekyarovaEItkisMESpectroscopy of covalently functionalized grapheneNano Lett201010104061406620738114
- FerrariACMeyerJCScardaciVRaman spectrum of graphene and graphene layersPhys Rev Lett2006971818740117155573
- McAllisterMJLiJLAdamsonDHSingle sheet functionalized graphene by oxidation and thermal expansion of graphiteChem Mater2007191843964404
- EsfandiarAAkhavanOIrajizadAMelatonin as a powerful bio-antioxidant for reduction of graphene oxideJ Mater Chem2011211090710914
- LiYLiuYFuYThe triggering of apoptosis in macrophages by pristine graphene through the MAPK and TGF-beta signaling pathwaysBiomaterials201233240241122019121
- AkhavanOGhaderiEAkhavanASize-dependent genotoxicity of graphene nanoplatelets in human stem cellsBiomaterials201233328017802522863381
- JaworskiSSawoszEGrodzikMIn vitro evaluation of the effects of graphene platelets on glioblastoma multiforme cellsInt J Nanomedicine2013841342023378763
- NelAXiaTMädlerLLiNToxic potential of materials at the nanolevelScience2006311576162262716456071
- SarkarSSharmaCYogRAnalysis of stress responsive genes induced by single-walled carbon nanotubes in BJ Foreskin cellsJ Nanosci Nanotechnol20077258459217450800
- FenoglioITomatisMLisonDReactivity of carbon nanotubes: free radical generation or scavenging activity?Free Radic Biol Med20064071227123316545691
- LiuXGurelVMorrisDBioavailability of nickel in single-wall carbon nanotubesAdv Mater2007191927902796
- DuchMCBudingerGRLiangYTMinimizing oxidation and stable nanoscale dispersion improves the biocompatibility of graphene in the lungNano Lett201111125201520722023654
- GuoLVon Dem BusscheABuechnerMYanAKaneABHurtRHAdsorption of essential micronutrients by carbon nanotubes and the implications for nanotoxicity testingSmall20084672172718504717