
 ?Mathematical formulae have been encoded as MathML and are displayed in this HTML version using MathJax in order to improve their display. Uncheck the box to turn MathJax off. This feature requires Javascript. Click on a formula to zoom.
Abstract
Background
Graphene oxide (GO) is a single layer carbon sheet with a thickness of less than 1 nm. GO has good dispersibility due to surface modifications with numerous functional groups. Reduced graphene oxide (RGO) is produced via the reduction of GO, and has lower dispersibility. We examined the bioactivity of GO and RGO films, and collagen scaffolds coated with GO and RGO.
Methods
GO and RGO films were fabricated on a culture dish. Some GO films were chemically reduced using either ascorbic acid or sodium hydrosulfite solution, resulting in preparation of RGO films. The biological properties of each film were evaluated by scanning electron microscopy (SEM), atomic force microscopy, calcium adsorption tests, and MC3T3-E1 cell seeding. Subsequently, GO- and RGO-coated collagen scaffolds were prepared and characterized by SEM and compression tests. Each scaffold was implanted into subcutaneous tissue on the backs of rats. Measurements of DNA content and cell ingrowth areas of implanted scaffolds were performed 10 days post-surgery.
Results
The results show that GO and RGO possess different biological properties. Calcium adsorption and alkaline phosphatase activity were strongly enhanced by RGO, suggesting that RGO is effective for osteogenic differentiation. SEM showed that RGO-modified collagen scaffolds have rough, irregular surfaces. The compressive strengths of GO- and RGO-coated scaffolds were approximately 1.7-fold and 2.7-fold greater, respectively, when compared with the non-coated scaffold. Tissue ingrowth rate was 39% in RGO-coated scaffolds, as compared to 20% in the GO-coated scaffold and 16% in the non-coated scaffold.
Conclusion
In summary, these results suggest that GO and RGO coatings provide different biological properties to collagen scaffolds, and that RGO-coated scaffolds are more bioactive than GO-coated scaffolds.
Introduction
Tissue engineering requires three major elements: cells, signaling molecules, and scaffolds. Natural and artificial scaffolds have been developed for the repair and regeneration of various tissues.Citation1,Citation2 Scaffolds provide the environment and space for repopulation and specialization of stem cells, blood vessels, and extracellular matrices.Citation3
The surface morphology of the scaffold often has a profound effect on the attachment of surrounding cells and tissues after implantation.Citation4 Many investigators have reported that surface modification of scaffolds with nano-sized materials stimulates bioactivity, including cell proliferation, tissue compatibility, and biodegradability,Citation4,Citation5 indicating that effective modification of the scaffold surface plays an important role in facilitating tissue engineering.
Recently, carbon-based nanomaterials such as carbon nanotubes,Citation6 carbon nanohorn,Citation7 fullerene,Citation8 and grapheneCitation9 have been extensively studied for biomedical applications. Graphene oxide (GO), a monolayer of carbon, holds particular promise as a tissue engineering substrate due to its unique physicochemical properties, including large surface area, high dispersibility, and hydrophilicity.Citation10,Citation11 The good dispersion of GO is attributed to its numerous oxygen-containing functional groups on the surface of a GO nanosheet.Citation11,Citation12 Several investigators have reported that GO can serve as a carrier for drugs and other biomolecules.Citation13,Citation14 In addition, GO up-regulates the degree of proliferation and differentiation of cultured cells, suggesting that GO is a biocompatible substrate.Citation15,Citation16 Therefore, surface modification of a scaffold using GO nanosheets as a coating should promote biological responses and tissue-reforming activity.
Reduced graphene oxide (RGO) is chemically fabricated by the reduction of GO with a reducing agent.Citation10 GO and RGO have different physical and chemical natures; RGO tends to coagulate in solution and show electrical conductivity,Citation10 in contrast to GO. RGO has been reported to affect cell behavior, protein loading capacity, and antibacterial activity in different ways.Citation17–Citation19 Therefore, we hypothesized that GO and RGO biomodification of a scaffold would provide novel properties to the scaffold and enhance the tissue-reforming process. However, the different effects of these scaffolds have not yet been investigated. Accordingly, the aim of this study was to assess the biological effects of GO and chemically synthesized RGO films, after which we modified a bio-safe collagen scaffold with GO and RGO in vitro. Bioactivity of each scaffold was evaluated in rats by in vivo comparative analyses to assess the biocompatibility and tissue ingrowth rate after implantation into connective tissue.
Methods
Fabrication of GO and RGO films
GO aqueous dispersing solution (1 wt%, nano GRAX®; Mitsubishi Gas Chemical Company, Inc., Tokyo, Japan) was prepared as described previously.Citation20 The GO monolayer in the solution was ~1 nm thick with an average width of about 20 μm.Citation20 The multi-layered GO film was fabricated on a culture dish (Techno Plastic Products AG, Trasadingen, Switzerland). One milliliter of dilute GO dispersing solution (0.1 wt%) was used for a 40-mm diameter dish. The solution was left to dry and the film was rinsed well with phosphate buffered saline (PBS; Wako Pure Chemical Industries, Ltd., Osaka, Japan). Some of the GO films were chemically reduced with either 10% ascorbic acid or 2% sodium hydrosulfite solution for 1 hour at 70°C, and were then well rinsed with PBS and dried. The morphology of GO and RGO films was observed using a scanning electron microscope (SEM) (S-4000; Hitachi Ltd., Tokyo, Japan) at an accelerating voltage of 10 kV after coating with a thin layer of Pt-Pd. Films were characterized and morphology-recorded with an atomic force microscope (AFM) (Agilent 5500; Toyo Corporation, Tokyo, Japan) in acoustic alternating current mode using a scanning probe (Nanosensor PPP-FMR-50; Nanoworld, Neuchâtel, Switzerland). The roughness parameters were obtained by calculation using software (Gwyddion; Czech Metrology Institute, Brno, Czech Republic). Each film was also characterized by X-ray diffraction (XRD) (RINT2000; Rigaku Corporation, Tokyo, Japan) using Cu Kα radiation at 40 kV and 40 mA. Diffractograms were obtained from 2θ =10° to 40° at increments of 0.02° at a scanning speed of 4°/minute. The hydrophilicity of the GO and RGO films was investigated by sessile drop method using a contact angle meter (DMs-200; Kyowa Electronic Instruments Co., Ltd., Tokyo, Japan). The electrical resistivity of the films was measured using a resistivity meter (MCP-HT450; Mitsubishi Chemical Analytic Co., Ltd., Chigasaki, Japan).
Adsorption test of calcium on films
GO and RGO films were prepared on a 24-well culture plate (tissue culture test plate 24; Techno Plastic Products) using methodology described in the “Fabrication of GO and RGO films” section. Ascorbic acid was used as the reducing agent. A culture plate without films was used as a control. Two milliliters of culture medium (minimum essential medium [MEM] alpha-GlutaMAX™-I; Thermo Fisher Scientific, Waltham, MA, USA) supplemented with 10% fetal bovine serum (FBS) (Qualified; Thermo Fisher Scientific) and 1% antibiotics (penicillin/streptomycin; Thermo Fisher Scientific) was infused into each well and coated with GO or RGO film. At 1, 3, and 7 days, specimens were rinsed using PBS, and acetic acid (0.5 M) was added. After 24 hours, the calcium content of the acetic acid supernatant was determined colorimetrically by the orthocresolphthalein complexone (OCPC) method.Citation21 Supernatant (25 μL) was added to 2.5 mL of 0.74 M aminoethanol-borate buffer solution containing 0.05 mg/mL OCPC and 0.1% 8-hydroxyquinoline as a coloring reagent. Optical density was measured on a microplate reader (ETY-300; Toyo Sokki Co., Ltd., Yokohama, Japan) at an absorbance of 575 nm.
Cytocompatibility of GO and RGO films
GO and RGO films were prepared on a culture dish. GO films were reduced with ascorbic acid. Each film was sterilized by ultraviolet irradiation. Mouse osteoblastic MC3T3-E1 cells (1×10⁴; RIKEN BioResource Center, Tsukuba, Japan) were seeded on GO and RGO films, and were cultured in humidified 5% CO2 at 37°C using medium supplemented with 10% FBS and 1% antibiotics. A culture plate without films was used as a control. Cell viability was assessed after 24- and 48-hour culture using a cell counting kit-8 (CCK-8; Dojindo Laboratories, Mashiki, Japan) in accordance with the manufacturer’s instructions. Optical density was measured using a microplate reader at an absorbance of 450 nm. After 24 hours of culture, some samples were fixed in 2.5% glutaraldehyde in 0.1 M sodium cacodylate buffer (pH 7.4) for 30 minutes, and were rinsed in cacodylate buffer solution. Films were then dehydrated in increasing concentrations of ethanol. Following critical point drying, samples were analyzed by SEM.
Measurement of DNA content and alkaline phosphatase activity on films
GO and RGO films were prepared on a 24-well culture plate. Ascorbic acid was used as a reducing agent. Each film was sterilized by ultraviolet and seeded with 2.2×10⁴ MC3T3-E1 cells, followed by culture for 7 or 14 days under humidified 5% CO2 at 37°C using medium supplemented with 10% FBS and 1% antibiotics. A culture plate without films was used as a control. Incubated specimens were rinsed twice using PBS, and cells were lysed using 0.5 mL PBS with subsequent sonication for 10 seconds. Cell suspension (50 μL) was added to 50 μL of 4 M NaCl in 0.1 M phosphate buffer (pH 7.4). After centrifugation, DNA content was measured using a DNA quantification kit (Primary Cell Co., Ltd., Sapporo, Japan) according to the manufacturer’s instructions. DNA was measured using a fluorescence spectrophotometer (F-3000; Hitachi Ltd.) equipped with a 356 nm excitation filter and a 458 nm emission filter. Alkaline phosphatase (ALP) activity was assayed after 7 or 14 days of cell culture by adding 50 μL of cell suspension to 50 μL of 0.4% IGEPAL® (Sigma-Aldrich Co., St Louis, MO, USA), 0.02 M Tris-HCl and 2 mM MgCl2 (pH 7.4). After getting centrifuged for 10 minutes at the speed of 10,000 rpm (MX-301; Tomy Seiko Co., Ltd., Tokyo, Japan), ALP activity was measured using a LabAssay ALP kit (Wako Pure Chemical Industries). Optical density was measured on a microplate reader using an absorbance of 405 nm. ALP activity was calculated based on the amount of DNA in the sample.
Preparation of collagen scaffolds coated with GO and RGO
GO was dispersed in water and a 1:9 solution of 1-methyl-2-pyrrolidinone at a concentration of 0.1 wt%. One hundred microliters of GO solution was injected into collagen scaffolds (6×6×3 mm, average porosity of 97.3%; Terudermis®; Olympus Terumo Biomaterials Corporation, Tokyo, Japan). Although collagen scaffolds were dissolved in ascorbic acid, samples were reduced by immersion in sodium hydrosulfite solution for 3 minutes. Scaffolds were then rinsed well with ethanol and air-dried. The porosity of the scaffolds was calculated according to the following equation:
where ρ1= bulk density, and ρ2= theoretical density of the scaffold. Subsequently, each scaffold was characterized by SEM and compression test. Compressive strength was measured using a universal testing machine (EZ-S; Shimadzu Corporation, Kyoto, Japan). Cross-head loading speed was set at 0.5 mm/minute.
Surgical procedure
The experimental protocol followed the institutional animal use and care regulations of Hokkaido University (Animal Research Committee of Hokkaido University, approval number 13–76). Seven 10-week-old male Wistar rats weighing 190 to 210 g were given general anesthesia by intraperitoneal injection of 0.6 mL/kg sodium pentobarbital (somnopenthyl; Kyoritsu Seiyaku Corporation, Tokyo, Japan), as well as a local injection of 2% lidocaine hydrochloride with 1:80,000 epinephrine (xylocaine cartridge for dental use; Dentsply-Sankin K.K., Tokyo, Japan).
After a skin incision was made, each scaffold was implanted into subcutaneous tissue of the back of each rat. Collagen scaffold without coating was applied as a control. Skin flaps were sutured (Softretch® 4-0; GC Corporation, Tokyo, Japan) and tetracycline hydrochloride ointment (achromycin ointment; Pola Pharma, Inc., Tokyo, Japan) was applied to the wound.
DNA content of implanted scaffolds
Rats were euthanized using an overdose of sodium pentobarbital (2.0 mL/kg) at 10 days post-surgery. Several specimens extracted from the wound were freeze-dried. Following pulverization, 0.5 mL of 2 M NaCl and 0.05 M phosphate buffer phosphate buffer (pH 7.4) was added to each scaffold. After centrifugation, the DNA content of each scaffold was examined using a DNA quantification kit and a fluorescence spectrophotometer at excitation and emission wavelengths of 356 nm and 458 nm, respectively.
Histological observation and measurement
Several specimens were collected from the rats for histological observation. Tissue blocks, including the surrounding soft tissue, were fixed in 10% buffered formalin, embedded in paraffin wax, and cut into 6 μm sections. Sections were stained with hematoxylin and eosin. Samples were examined by light microscopy. Three stained sections were taken: one from the center of the scaffold and one each from 1 mm to either side of the center. Histomorphometric measurements of the rate of tissue ingrowth and the number of giant cells were performed using a software package (ImageJ 1.41; National Institutes of Health, Bethesda, MD, USA).
Statistical analysis
Means and standard deviations of each parameter were calculated for each group. Statistical analysis was performed using the Scheffé test for each measurement. P-values of <0.05 were considered to be statistically significant. All statistical procedures were performed using a software package (IBM SPSS 11.0; IBM SPSS Japan, Tokyo, Japan).
Results
Characterization of GO and RGO films
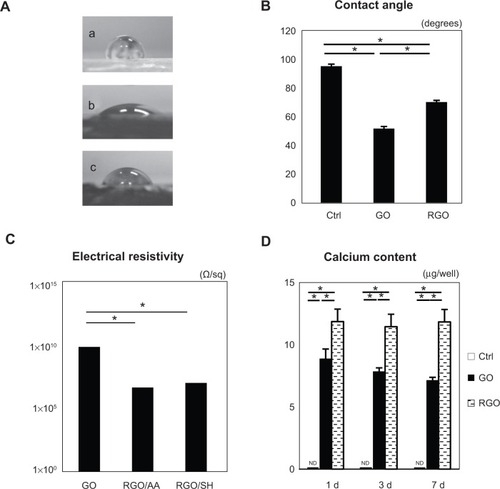
RGO film was obtained by a reaction with reducing agents, 10% ascorbic acid or 2% sodium hydrosulfite solution, resulting in a dark-colored film (). SEM showed that GO and RGO films on culture dishes were wrinkled and laminated, with a thickness of 1 μm (). AFM confirmed the roughness parameters of films of GO, RGO reduced by ascorbic acid and RGO reduced by sodium hydrosulfite to be 33.3, 35.9, and 105.2 nm, with maximum heights of 264.7, 377.8, and 676.6 nm, respectively (). Higher nanoscale roughness of RGO film was present when compared with GO film. XRD showed a strong peak at 8°–9° in the GO pattern, which was absent in the RGO pattern (). The interlayer spacing of the GO film was 0.9 nm, whereas chemical reduction led to shifts to 0.3 nm in RGO films, indicating that oxygen-containing functional groups were removed from the GO nanosheet. Contact angle measurements revealed the significantly higher hydrophilic natures of GO and RGO when compared with controls. In addition, the contact angle of the GO film was significantly lower than that of the RGO film (). RGO films exhibited higher electrical conductivity than GO films (). Electrical resistivity of RGO films treated with each reducing agent was equal.
Figure 1 Digital photographs (A–C), SEM micrographs (D–F), and AFM topography (G–I) of GO film: GO film (A, D, F, and G); GO film reduced by ascorbic acid (B, E, and H); GO film reduced by sodium hydrosulfite (C and I), with (F) showing the film’s cut surface (labeled GO) as it appears on the culture dish (labeled PS).
Note: Scale bars represent 10 μm (D and E), 5 μm (F), and 2 μm (G–I), respectively.
Abbreviations: SEM, scanning electron microscopy; AFM, atomic force microscopy; GO, graphene oxide; PS, polystyrene.
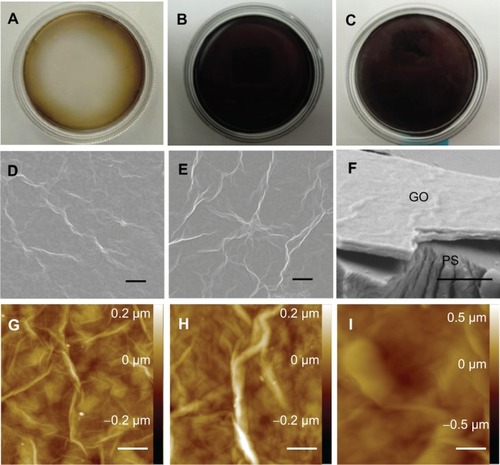
Figure 2 XRD patterns of GO film (A), GO film reduced by ascorbic acid (B), and GO film reduced by sodium hydrosulfite (C), corresponding to interlayer distances of 0.919, 0.326, and 0.324 nm, respectively.
Abbreviations: XRD, X-ray diffraction; GO, graphene oxide; deg, degrees.
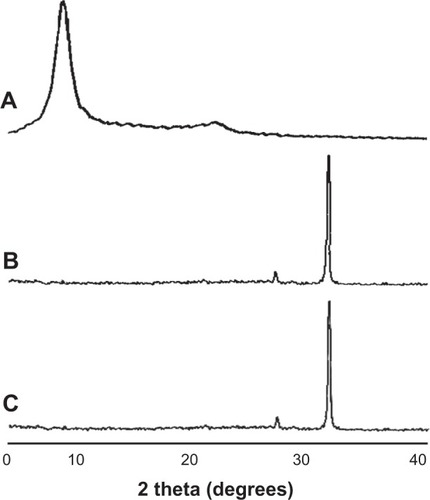
Figure 3 Contact angle images (A) of culture dish (a); GO film (b); and GO film reduced by ascorbic acid (c). Summary of the contact angles (B) (N=6, means ± SD). Electrical resistivity measurements (C) (N=5, means ± SD) of the GO film (labeled “GO”); GO film reduced by ascorbic acid (labeled “RGO/AA”); and the GO film reduced by sodium hydrosulfite (labeled “RGO/SH”). (D) Calcium content of each film.
Note: *P<0.05.
Abbreviations: GO, graphene oxide; N, number of samples; SD, standard deviation; RGO, reduced graphene oxide; AA, ascorbic acid; SH, sodium hydrosulfite; Ctrl, control; d, days; ND, not detected.
Adsorption test of calcium
The amount of calcium in the various samples is presented in . The RGO film significantly adsorbed calcium throughout the experimental period when compared with the GO film. No time-dependent increases in calcium were observed for either GO or RGO films. In contrast, calcium was not detected on the surface of control dishes.
Cytocompatibility
SEM showed spreading and elongation of osteoblastic MC3T3-E1 cells on the GO and RGO films (). However, early cell proliferation was significantly inhibited on GO and RGO films when compared with the control culture plate ().
Figure 4 SEM micrograph of cell morphology in a culture dish (A); GO film (B); and RGO film (C).
Note: Scale bars represent 100 μm in all three images.
Abbreviations: SEM, scanning electron microscopy; GO, graphene oxide; RGO, reduced graphene oxide.
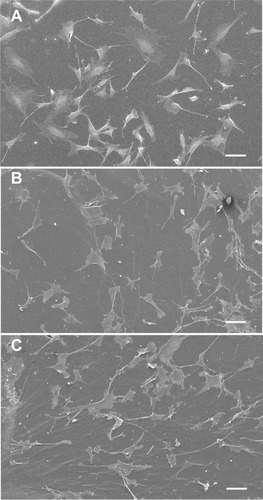
Figure 5 In vitro assessment of each film (N=6, means ± SD): CCK-8 assays (A); DNA content (B); and ALP activity (C).
Note: *P<0.05.
Abbreviations: N, number of samples; SD, standard deviation; CCK-8, cell counting kit-8; ALP, alkaline phosphatase; DNA, deoxyribonucleic acid; h, hours; d, days; Ctrl, control; GO, graphene oxide; RGO, reduced graphene oxide.
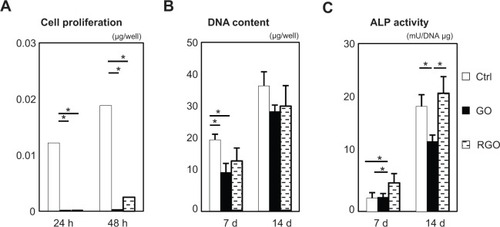
Measurement of DNA content and ALP activity
DNA content and ALP activity are presented in . DNA content of GO and RGO films was significantly lower when compared with controls at 7 days, and a similar pattern was observed at 14 days. ALP activity of cells attached to GO films was decreased when compared with controls at 14 days, whereas cells attached to RGO displayed the highest ALP activity, suggesting that reduction of GO modulates the differentiation of attached cells.
Characteristics of GO- and RGO-coated collagen scaffolds
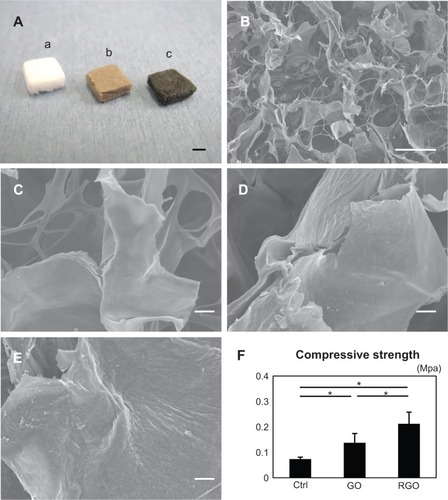
The scaffolds were discolored by GO and RGO coatings (). SEM showed that GO- and RGO-modified scaffolds contain interconnected spaces and have an average porosity of 97% (). Higher magnification showed that GO film coated the surface of the collagen fibers of the scaffold. After reducing treatment, the scaffold had rough irregular surfaces, suggesting aggregation of GO on the surface, caused by the reducing agent. The nature of this nano-biomodified surface was confirmed by cross sectioning (). The compressive strength of GO- and RGO-coated collagen scaffolds was approximately 2- and 3-fold greater, respectively, when compared with non-coated scaffold; these differences were statistically significant ().
Table 1 Structural parameters of each scaffold (means ± SD)
Figure 6 Digital photographs (A), SEM micrographs (B–E), and compressive strengths of scaffolds (F): the photograph (A) shows appearances of the collagen scaffold (a), GO-coated collagen scaffold (b), and RGO-coated collagen scaffold (c); SEM micrograph of the inner surface of the collagen scaffold (B); higher magnification of the collagen scaffold, showing the smooth surface (C); higher magnification of the GO-coated collagen scaffold, showing its irregular surface (D); higher magnification of the RGO-coated collagen scaffold, showing the rough surface frequently produced by chemical reduction (E); and compressive strength of each scaffold (F).
Notes: *P<0.05. Scale bars represent 2 mm (A), 100 μm (B), and 10 μm (C–E), respectively.
Abbreviations: SEM, scanning electron microscopy; GO, graphene oxide; RGO, reduced graphene oxide; Ctrl, control.
Histological observation and measurement
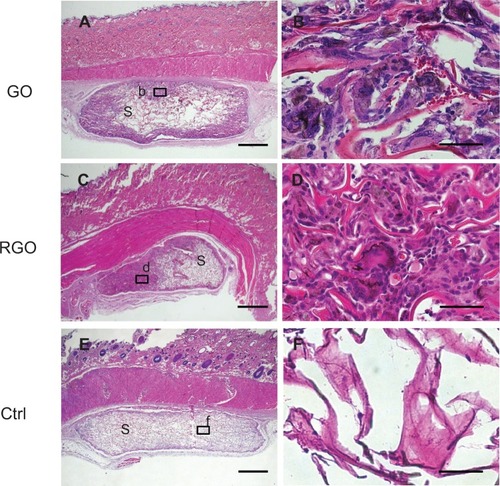
Evidence of tissue ingrowth was frequently observed in the nanocarbon-coated scaffolds (). Inflammatory response involving the accumulation of leukocytes and lymphocytes was rarely seen around the residual scaffold, indicating that the material was highly tissue-compatible. Macrophage-like giant cells associated with resorption of scaffold were often observed in the scaffolds (). Black discoloration of giant cells was observed. In contrast, in the control group receiving non-modified collagen scaffold, cell and tissue ingrowth were rarely demonstrated in the implanted material ().
Figure 7 Histological findings at 10 days for implanted GO-coated scaffolds (A and B), RGO-coated scaffolds (C and D), and controls (E and F) implanted into rats: specimen implanted with GO-coated scaffold (A), with inset (b) represented at higher magnification by (B), in which macrophage-like giant cells appear; specimen implanted with RGO-coated scaffold (C), with inset (d) represented at higher magnification by image (D); specimen implanted with collagen scaffold (E), with inset (f) represented at higher magnification by image (F).
Notes: Scale bars represent 1 mm (A, C, E), and 50 μm (B, D, F), respectively. Staining is with HE.
Abbreviations: GO, graphene oxide; RGO, reduced graphene oxide; Ctrl, control; S, scaffold; HE, hematoxylin eosin.
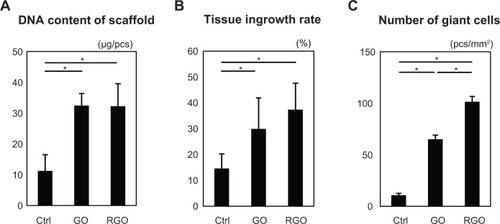
Significant differences were observed in DNA content and area of tissue ingrowth between nanocarbon-modified scaffolds and unmodified scaffolds (). RGO samples showed an overall higher tissue ingrowth compared to GO samples. In particular, giant cells were significantly more prevalent in the RGO-coated scaffolds (). These results indicate that GO and RGO are likely to exert various biological functions in the body.
Figure 8 Assessment of each scaffold (N=6, means ± SD). DNA content of scaffold (A); tissue ingrowth rate (B); and number of giant cells (C).
Note: *P<0.05.
Abbreviations: N, number of samples; SD, standard deviation; DNA, deoxyribonucleic acid; Ctrl, control; GO, graphene oxide; RGO, reduced graphene oxide; Ctrl, control; pcs, pieces.
Discussion
The examination of ALP activity revealed that RGO film enhances cell activity when compared to GO film. We speculate that these results are associated with the physicochemical properties of GO and RGO. Films of GO and RGO demonstrated high adsorption of calcium in culture medium with FBS. Previous reports showed the efficacy of GO for rapid removal of some materials from contaminated water.Citation22,Citation23 GO has an affinity for Ca2+ because the surface of GO is covered with epoxy, hydroxyl, and carboxyl groups, which are well-suited to interacting with cations and anions.Citation22 We also speculate that calcium adsorption on RGO films was enhanced by graphite intercalation (ie, insertion of calcium between graphite layers).Citation22,Citation24 In addition, Eigler et al used AFM to investigate the height of monolayers of GO, and GO reduced by ascorbic acid.Citation25 The results showed that the height of the RGO monolayer was greater when compared to the GO monolayer, suggesting that the reducing agent, ascorbic acid, was adsorbed onto the GO surface. The ascorbic acid subsequently interacted with divalent alkaline metal cations including Ca2+. Accordingly, GO films reduced by ascorbic acid may more readily capture calcium. Meanwhile, it has been reported that addition of Ca2+ stimulated ALP activity and matrix mineralization of mouse osteoblasts in three-dimensional culture.Citation26 In this study, high Ca2+ accumulation on the RGO film might provide an environment for osteogenic cell differentiation.
On SEM observation in our study, cell spreading was observed on GO and RGO films. On cell viability assessment, however, inhibition of cell proliferation was seen on GO and RGO films when compared with controls. As cells are able to attach to hydrophobic culture surfaces via the cell membrane,Citation27 the hydrophilic nature of GO and RGO films should trigger adverse biological effects. In fact, the antibacterial activity of GO-based materials has recently been described.Citation28 GO and RGO induce significant production of superoxide anion radicals and are effective bactericidal agents.Citation29 Oxidative stress also stimulated the inhibition of cell viability and provided cytotoxic effects.Citation30,Citation31 Chang et al demonstrated that cells cultured on GO showed similar cyto-structures as control (non-treated) cells, but reactive oxygen species produced by a high dose of GO induced a slight decrease in cell viability.Citation32 Therefore, the hydrophilic nature and reactive oxygen species production of GO and RGO films would suppress some MC3T3-E1 cell activity.
In our animal tests, scaffolds with GO and RGO distinctly stimulated tissue response, particularly tissue ingrowth into RGO-coated scaffolds. Ordinarily, the mechanical properties of the regenerative scaffold play a facilitative role in maintaining the space for ingrowth of cells and blood vessels from the surrounding tissue.Citation5 In the present examination, GO and RGO coatings significantly increased the compressive strength of the collagen scaffold, likely due to the GO nanosheet assembling on the strut surface of the collagen scaffold and adding to its elasticity. Furthermore, the compressive strength of the RGO-coated collagen scaffold was approximately two-fold greater than that of the GO scaffold. GO is aggregated by the reducing process, resulting in a tough coating on the scaffold. XRD analysis revealed that interlayer distance in RGO films was tighter than in GO films. The attractive interaction due to van der Waals forces was strong between RGO monolayers at nanoscale distances, resulting in a tough coating of RGO on the scaffold. Accordingly, GO- and RGO-coated scaffolds would maintain the regenerative space in the body during tissue engineering. In general, regenerative scaffolds are designed to provide a highly porous structure for tissue ingrowth; however, higher porosity generally causes lower mechanical strength.Citation33 Nonetheless, SEM images of RGO-coated materials have shown that collagen sponge foam-coated with nanocarbon retains its porous structure. In addition, AFM and SEM showed a rough surface on the RGO film, while the GO film had a relatively smooth surface. The interfacial morphology of cells strongly affects the induction of cell reactions.Citation34,Citation35 Many investigators have demonstrated that nano- and micro-scale structures in bio-based materials provide advantages for tissue engineering processes.Citation36,Citation37 Thus, nano-modification of RGO similarly provides advantages, such as porosity and surface structure, for tissue engineering of different cell types and of multi-cellular organisms.
Inflammatory cells such as neutrophils and lymphocytes were rarely seen around the nano-modified samples in this study. In addition, collagen scaffold consisting of atelocollagen is recognized as a biocompatible material,Citation38,Citation39 suggesting that GO- and RGO-coated scaffolds have good biocompatibility. Histological samples following exposure to RGO frequently showed numerous giant cells in the scaffold, suggesting that early tissue remodeling in our study occurred due to macrophage assembly, and subsequently stimulated cell ingrowth. Furthermore, GO and RGO appeared to agglomerate by phagocytosis of macrophage-like cells, as black discoloration of giant cells was observed. GO accumulation has been reported following phagocytosis, and remains as a residue in cell lysosomes.Citation40 In contrast, carbon nanotubes were gradually biodegraded in macrophage lysosomes over 2 years post-implantation.Citation41 Therefore, degradation of GO-based nanomaterials is an important point to be considered in the future.
Conclusion
The present study focused on the biological effects of GO and RGO coatings on biomaterials for the purpose of developing a tissue engineering scaffold. GO- and RGO-coated scaffolds possessed high tissue compatibility. In addition, GO and RGO coatings provided different biological properties to the collagen scaffold, including surface structure, compressive strength, and cell ingrowth. RGO-coated scaffolds showed good bioactivity when compared with GO-coated scaffolds.
Acknowledgments
We are grateful to our colleagues, Dr Yuta Kosen and Dr Takashi Yoshida, for their assistance. We would also like to thank Olympus Terumo Biomaterials Corporation for providing the collagen scaffold. This work was supported by the Japan Society for the Promotion of Science Grants-in-Aid for Scientific Research (JPSP KAKENHI) grant number 25463210.
Disclosure
The authors report no conflicts of interest related to this work.
References
- LangerRVacantiJPTissue engineeringScience199326029209418493529
- StockUAVacantiJPTissue engineering: current state and prospectsAnnu Rev Med20015244345111160788
- YangSLeongKFDuZChuaCKThe design of scaffolds for use in tissue engineering. Part II. Rapid prototyping techniquesTissue Eng20028111111886649
- StevensMMGeorgeJHExploring and engineering the cell surface interfaceScience200531057511135113816293749
- IbaraAMiyajiHFugetsuBOsteoconductivity and biodegradability of collagen scaffold coated with nano-β-TCP and fibroblast growth factor 2J Nanomater201346111
- ZhangXFZhangXBVan TendelooGAmelinckxSOp de BeeckMVan LanduytJCarbon nano-tubes; their formation process and observation by electron microscopyJ Cryst Growth19931303368382
- MurataKKanekoKKokaiFTakahashiKYudasakaMIijimaSPore structure of single-wall carbon nanohorn aggregatesChem Phys Lett200033111420
- KrotoHWHeathJRO’BrienSCCurlRFSmalleyREC60: BuckminsterfullereneNature1985318162163
- MeyerJCGeimAKKatsnelsonMINovoselovKSBoothTJRothSThe structure of suspended graphene sheetsNature20074467131606317330039
- DreyerDRParkSBielawskiCWRuoffRSThe chemistry of graphene oxideChem Soc Rev201039122824020023850
- SuCLohKPCarbocatalysts: graphene oxide and its derivativesAcc Chem Res201346102275228523270430
- KimJCoteLJKimFYuanWShullKRHuangJGraphene oxide sheets at interfacesJ Am Chem Soc2010132238180818620527938
- SunXLiuZWelsherKNano-graphene oxide for cellular imaging and drug deliveryNano Res20081320321220216934
- LiuJFuSYuanBLiYDengZToward a universal “adhesive nanosheet” for the assembly of multiple nanoparticles based on a protein-induced reduction/decoration of graphene oxideJ Am Chem Soc2010132217279728120462190
- RuizONFernandoKAWangBGraphene oxide: a nonspecific enhancer of cellular growthACS Nano20115108100810721932790
- AokiNAkasakaTWatariFYokoyamaACarbon nanotubes as scaffolds for cell culture and effect on cellular functionsDent Mater J200726217818517621932
- AgarwalSZhouXYeFInterfacing live cells with nanocarbon substratesLangmuir20102642244224720099791
- ShiXChangHChenSLaiCKhademhosseiniAWuHRegulating cellular behavior on few-layer reduced graphene oxide films with well-controlled reduction statesAdv Funct Mater2012224751759
- HuWPengCLuoWGraphene-based antibacterial paperACS Nano2010474317432320593851
- HirataMGotouTHoriuchiSFujiwaraMOhbaMThin-film particles of graphite oxide 1: high-yield synthesis and flexibility of the particlesCarbon2004421429292937
- ConnertyHVBriggsARDetermination of serum calcium by means of orthocresolphthalein complexoneAm J Clin Pathol19664532902965932858
- RomanchukAYSlesarevASKalmykovSNKosynkinDVTourJMGraphene oxide for effective radionuclide removalPhys Chem Chem Phys20131572321232723296256
- ZhangKDwivediVChiCWuJGraphene oxide/ferric hydroxide composites for efficient arsenate removal from drinking waterJ Hazard Mater20101821–316216820580161
- InabaMYoshidaHOgumiZAbeTMizutaniYAsanoMIn situ raman study on electrochemical li intercalation into graphiteJ Electrochem Soc199514212026
- EiglerSGrimmSEnzelberger-HeimMMüllerPHirschAGraphene oxide: efficiency of reducing agentsChem Commun (Camb)201349677391739323860424
- MaenoSNikiYMatsumotoHThe effect of calcium ion concentration on osteoblast viability, proliferation and differentiation in monolayer and 3D cultureBiomaterials200526234847485515763264
- ShimizuTYamatoMKikuchiAOkanoTCell sheet engineering for myocardial tissue reconstructionBiomaterials200324132309231612699668
- BaoQZhangDQiPSynthesis and characterization of silver nanoparticle and graphene oxide nanosheet composites as a bactericidal agent for water disinfectionJ Colloid Interface Sci2011360246347021628064
- GurunathanSHanJWDayemAAEppakayalaVKimJHOxidative stress-mediated antibacterial activity of graphene oxide and reduced graphene oxide in Pseudomonas aeruginosaInt J Nanomedicine201275901591423226696
- FatokunAAStoneTWSmithRAHydrogen peroxide-induced oxidative stress in MC3T3-E1 cells: the effects of glutamate and protection by purinesBone200639354255116616712
- KamataHHondaSMaedaSChangLHirataHKarinMReactive oxygen species promote TNFalpha-induced death and sustained JNK activation by inhibiting MAP kinase phosphatasesCell2005120564966115766528
- ChangYYangSTLiuJHIn vitro toxicity evaluation of graphene oxide on A549 cellsToxicol Lett2011200320121021130147
- KarageorgiouVKaplanDPorosity of 3D biomaterial scaffolds and osteogenesisBiomaterials200526275474549115860204
- CostaDOAlloBAKlassenRHutterJLDixonSJRizkallaASControl of surface topography in biomimetic calcium phosphate coatingsLangmuir20122883871388022242934
- StevensMMGeorgeJHExploring and engineering the cell surface interfaceScience200531057511135113816293749
- WeiGMaPXNanostructured biomaterials for regenerationAdv Funct Mater200818223566358219946357
- MuruganRRamakrishnaSNano-featured scaffolds for tissue engineering: a review of spinning methodologiesTissue Eng200612343544716579677
- ShimojiSMiyajiHSugayaTBone perforation and placement of collagen sponge facilitate bone augmentationJ Periodontol200980350551119254135
- KosenYMiyajiHKatoASugayaTKawanamiMApplication of collagen hydrogel/sponge scaffold facilitates periodontal wound healing in class II furcation defects in beagle dogsJ Periodontal Res201247562663422443229
- WangKRuanJSongHBiocompatibility of graphene oxideNanoscale Res Lett20116818
- SatoYYokoyamaANodasakaYLong-term biopersistence of tangled oxidized carbon nanotubes inside and outside macrophages in rat subcutaneous tissueSci Rep20133251623981952