
Abstract
Introduction
Nanosized particles may enable therapeutic modulation of immune responses by targeting dendritic cell (DC) networks in accessible organs such as the lung. To date, however, the effects of nanoparticles on DC function and downstream immune responses remain poorly understood.
Methods
Bone marrow–derived DCs (BMDCs) were exposed in vitro to 20 or 1,000 nm polystyrene (PS) particles. Particle uptake kinetics, cell surface marker expression, soluble protein antigen uptake and degradation, as well as in vitro CD4+ T-cell proliferation and cytokine production were analyzed by flow cytometry. In addition, co-localization of particles within the lysosomal compartment, lysosomal permeability, and endoplasmic reticulum stress were analyzed.
Results
The frequency of PS particle–positive CD11c+/CD11b+ BMDCs reached an early plateau after 20 minutes and was significantly higher for 20 nm than for 1,000 nm PS particles at all time-points analyzed. PS particles did not alter cell viability or modify expression of the surface markers CD11b, CD11c, MHC class II, CD40, and CD86. Although particle exposure did not modulate antigen uptake, 20 nm PS particles decreased the capacity of BMDCs to degrade soluble antigen, without affecting their ability to induce antigen-specific CD4+ T-cell proliferation. Co-localization studies between PS particles and lysosomes using laser scanning confocal microscopy detected a significantly higher frequency of co-localized 20 nm particles as compared with their 1,000 nm counterparts. Neither size of PS particle caused lysosomal leakage, expression of endoplasmic reticulum stress gene markers, or changes in cytokines profiles.
Conclusion
These data indicate that although supposedly inert PS nanoparticles did not induce DC activation or alteration in CD4+ T-cell stimulating capacity, 20 nm (but not 1,000 nm) PS particles may reduce antigen degradation through interference in the lysosomal compartment. These findings emphasize the importance of performing in-depth analysis of DC function when developing novel approaches for immune modulation with nanoparticles.
Introduction
In recent years, intense research has focused on novel clinical applications for nanomaterials in medicine, including the potential use of engineered nanoparticles (NPs) as carriers for therapeutic applications.Citation1 However, our knowledge regarding immune responses related to particulate exposure remains incomplete. Before nanocarriers may be considered for future medical applications, an in-depth understanding of NP–immune cell interactions is essential.Citation2 Due to their nanoscale size, large surface area, surface reactivity, and chemical composition, NPs interact differently with biological systems compared with larger-sized particles of the same material.Citation3 Moreover, interactions of nanomaterials with the immune system are affected by physicochemical properties, such as size, surface coating, charge, or shape.Citation4,Citation5 Hence, potential nanocarriers require meticulous characterization to rule out any adverse toxicological and immunological responses prior to utilization in humans.Citation6
Dendritic cells (DCs) are the most potent antigen-presenting cells (APCs) in the respiratory tract and are specialized for capture, processing, and presentation of antigens.Citation7,Citation8 As key elements in regulating immunity and tolerance, DCs are essential for bridging innate and adaptive immune responses. Consequently, they are often targets for immunotherapeutic approaches. Furthermore, the respiratory tract represents an attractive target organ, given its enormous interface where interaction between DCs and novel inhalable nanocarrier-based vaccines may occur.Citation9,Citation10 DCs are heterogeneous and exist as multiple distinct subsets.Citation11 Upon activation by antigen capture, cytokines, or lipopolysaccharides (LPS), immature DCs undergo a maturation process into so-called mature DCs.Citation12 During this process, co-stimulatory molecules and maturation markers are upregulated, and mature DCs migrate towards regional lymph nodes where they may induce expansion of antigen-specific CD4+ T-cells.Citation13,Citation14 Given the central importance of DCs in regulating immune responses, it is essential to gain knowledge about phenotypic and functional changes occurring following exposure to different particle sizes and at different stages of DC maturation.
We recently reported that among intra-nasally instilled 20, 50, 100, 200, and 1,000 nm polystyrene (PS) particles, particles with a diameter of 20 nm were most frequently captured by DCs compared with larger 1,000 nm particles, and only the smallest particles led to increased antigen-specific CD4+ T-cell proliferation in local draining lymph nodes.Citation15 For the present study, we utilized similar particles to further investigate basic mechanisms of particle–immune cell interactions and functional changes of DCs in vitro. We hypothesized that particle size is a key element in modulation of DC function (ie, antigen uptake, degradation, and presentation). We employed fluorescent, negatively charged (carboxylated) PS particles of 20 and 1,000 nm in diameter. These widely employed, supposedly inert model particles were chosen as they are readily detected, available in different sizes with a narrow size distribution and were tested to be free of endotoxin contamination.Citation15 We herein report our studies investigating the functional effects of 20 and 1,000 nm PS-particle exposure on mouse bone marrow–derived DCs (BMDCs), using in vitro differentiated immature and mature BMDCs to assess potential immune modulatory properties of PS particles.
Materials and methods
Mice
Female BALB/c and DO11.10 TCR transgenic (BALB/c background) mice were bred specific pathogen free at the Department of Clinical Research (University of Berne, Switzerland) according to the Swiss Federal Veterinary Office guidelines under animal experimentation permission and used at 8–12 weeks of age.
BMDC cultures, maturation, and exposure to PS particles
DCs were generated from bone marrow as described elsewhere.Citation16 This robust protocol provides a mixture of immature and mature DCs in the non-adherent cell fraction. For our experiments, we strictly employed non-adherent cells that are a mixture of DC precursors, immature DCs, and mature DCs. Briefly, BMDCs were generated by culturing in Iscove’s Modified Dulbecco’s Medium (IMDM) (Invitrogen, Lucerne, Switzerland) containing 10% fetal calf serum (FCS), 1% L-glutamine, 1% penicillin/streptomycin, and 5% granulocyte-macrophage colony-stimulating factor (GM-CSF) (collected from culture supernatant of a X63-GM-CSF myeloma cell line transfected with the murine GM-CSF gene) for 8 days at 37°C in a 5% CO2 humidified incubator. Five percent GM-CSF refers to 5% of the collected cell media, and titration of GM-CSF was initially performed before experiments with concentrations of 5%, 10%, and 15% GM-CSF. Five percent was then chosen, as it was the lowest concentration capable of inducing BMDC differentiation and activation following LPS incubation (data not shown).
Yellow-green-labeled carboxylated PS particles of 20 nm (Molecular Probes, Lucerne, Switzerland) or 1,000 nm (Polysciences, Inc., Warrington, PA, USA) were employed. For cell viability experiments, BMDCs were exposed for 16 hours to PS particles at a concentration ranging from 25 μg/mL up to 100 μg/mL. For further experiments, concentrations for both PS-particle sizes were adjusted to 25 μg/mL to rule out any cytotoxic effects. For NP-uptake experiments, BMDCs were first matured with 100 ng/mL LPS (Sigma-Aldrich, Buchs, Switzerland) for 16 hours (overnight), and PS particles were added the following day for different time-points (see below “Particle uptake studies using laser scanning microscopy”). For further experiments (antigen uptake, degradation and presentation experiments, co-localization with lysosomes, and endoplasmic reticulum [ER] stress), PS particles (25 μg/mL) and LPS (100 ng/mL) were added concomitantly for 16 hours. All experiments were conducted with a cell concentration of 1×10⁶ cells/mL.
PS-particle characterization
PS particles were thoroughly characterized prior to use. The hydrodynamic size was measured by dynamic light scattering (DLS) (3DLS Spectrometer; LS Instruments AG, Fribourg, Switzerland). Measurements were performed both in phosphate-buffered saline (PBS) and cell medium employed for experiments (IMDM +10% FCS). Zeta potential was determined in PBS using a Brookhaven-90 Plus Particle Size Analyzer (Brookhaven Instruments Corporation, Holtsville, NY, USA). Additionally, all particles were tested endotoxin free (according to the Limulus amebocyte lysate test; Lonza, Walkersville, MD, USA) as already described in a previous publication.Citation15
Flow cytometry
Unless indicated otherwise, all antibodies were purchased from eBioscience (Vienna, Austria). All stainings were performed strictly on ice as described.Citation17 BMDC phenotype and activation state were assessed by staining with CD11b-APC-Alexa Fluor 780, CD11c-APC, CD40-PE-Cy5, CD86-PE-Cy7, and MHCII-PE. T-cells were stained with CD4-APC or CD4-APC-Alexa Fluor 780, CD3-biotin (secondary antibody: streptavidin-PE-Cy5), CD69-PE-Cy7, DO11.10 TCR (KJ-126)-PE, or DO11.10 TCR (KJ-126)-biotin (secondary antibody: streptavidin-FITC). Relevant isotype control antibodies were employed as indicated. Propidium iodide (Invitrogen) and Annexin V-Alexa647 (BioLegend®, Lucerne, Switzerland) staining was performed to measure cell death and apoptosis, respectively. Samples were measured using a SORP LSRII (BD Biosciences, Franklin Lakes, NJ, USA), and the data obtained were analyzed using Flow Jo (Tree Star, Ashland, OR, USA) software.
Particle uptake studies using laser scanning microscopy (LSM)
BMDCs were matured for 16 hours with LPS, with LPS-untreated BMDCs as controls. All cultures were incubated the following day with 20 or 1,000 nm PS particles (25 μg/mL) for a time course of 10, 20, 40, 60, and 90 minutes, and 2, 4, 8, and 16 hours. After washing, BMDCs were spun down for 6 minutes at 900 rpm onto glass slides (Cytospin™ cytocentrifuge; Thermo Scientific, Zürich, Switzerland) and fixed in 70% alcohol for 5 minutes. Cells were permeabilized in 0.2% Triton X-100 (Sigma-Aldrich) and stained with phalloidin rhodamine (1:100; Molecular Probes) and with DAPI (4′,6-diamidino-2-phenylindole; 1 μg/mL; Invitrogen) for 1 hour at room temperature. Afterwards, the cells were washed and mounted in Aquatex mounting medium (Merck KGaA, Darmstadt, Germany). Optical sections were taken with a Zeiss LSM 710 (Carl Zeiss AG, Feldbach, Switzerland) with a 63× oil objective (Plan-Apochromat 63×/1.40 Oil DIC M27) and a digital zoom of 3×. Image processing was performed using Imaris® (Bitplane AG, Zurich, Switzerland) software.
Measurement of antigen uptake and antigen degradation
Prior to antigen uptake, degradation, and presentation studies, ovalbumin (OVA) and bovine serum albumin (BSA) antigens were thoroughly titrated in preliminary experiments using a concentration series of 2.5, 10, 20, and 40 μg/mL for uptake and degradation and 5, 10, 20, 50, and 100 μg/mL for antigen presentation assays. In each case, the smallest concentration of antigen that induced robust CD4+ T-cell proliferation was chosen (data not shown). Antigen uptake and degradation capacity of BMDCs were assessed as previously described.Citation17,Citation18 Briefly, cells were incubated with 2.5 μg/mL OVA-Alexa Fluor 647 (Molecular Probes) to assess uptake capacity or with 10 μg/mL BSA-DQ Red (Invitrogen) to determine degradation capacity. Cells were incubated for a time course of 0–60 minutes at 37°C or on ice (controls).
Stimulation of carboxyfluorescein succinimidyl ester (CFSE)-labeled OVA-specific T-cells
CD4+ T-cells from BALB/c DO11.10 mice were isolated using a CD4-positive isolation kit (Miltenyi Biotech, Bergisch Gladbach, Germany). Cells were labeled with CFSE (eBioscience) and co-cultured for 72 hours with BMDCs that were previously incubated for 16 hours with LPS and/or PS particles, to a ratio 10:1 (T-cells/DCs). In addition, BMDCs were pulsed for 1 hour with 20 μg/mL OVA protein (Molecular Probes), or H-2d restricted OVA peptide (20 μg/mL, sequence 323–339; GenScript, Aachen, Germany) then added to the co-culture for 72 hours. We employed the non-adherent BMDC cell population without further cell sorting or purification steps. After the incubation period, antigen-specific T-cell proliferation (CFSE dilution) was measured by flow cytometry.
Intracellular cytokine staining
DO11.10+/CD4+ T-cells and BMDCs were co-cultured as described in the section “Stimulation of carboxyfluorescein succinimidyl ester (CFSE)-labeled OVA-specific T-cells” with or without 20 μg/mL OVA peptide (sequence 323–339; GenScript) for 72 hours. On day 3, Brefeldin A (20 μg/mL; eBioscience) was added to the cultures for 2 hours. At the end of the culture period, cells were incubated with antibodies against CD4 and the DO11.10 T-cell receptor (KJ-126) for 20 minutes on ice prior to fixation in 1% formalin solution for 20 minutes. Cells were incubated in permeabilization buffer (PBS + 0.1% saponin +10% FCS) for 5 minutes at room temperature before the following anti-cytokine antibodies were added for 30 minutes: tumor necrosis factor (TNF)α-eF450, interferon (IFN)γ-eF450, interleukin (IL)10-PE, IL5-PE, IL17-PE-Cy7, and IL4-APC (all eBioscience).
Co-localization studies of PS particles with lysosomes
For co-localization studies between lysosomes and PS particles, BMDCs were incubated in 8-well chamber slides (1μ-Slide ibiTreat microscopy chamber; ibidi GmbH, Martinsried, Germany) with 20 or 1,000 nm PS particles with or without concomitant LPS for 16 hours. Following PS-particle exposure, BMDCs were washed with IMDM, and the plasma membrane stained with CellMask™ Orange (6 μg/mL, Molecular Probes) and lysosomes with LysoTracker® Deep Red (1 μM, Molecular Probes) during 1 hour at 37°C. The optimal amount of LysoTracker® Deep Red was titrated prior to co-localization studies and adjusted to 1 μM (data not shown). All micrographs were taken with a Zeiss LSM 710 (previously described). Micrographs used for three-dimensional reconstruction were taken with a 63× oil objective (previously described) and a digital zoom of 3×, and image processing was performed using Imaris® software. Micrographs used to analyze co-localization were taken with a 40× oil objective (EC Plan-Neofluar 40×/1.30 Oil DIC M27/a =0.21 mm) and image analysis was performed using ImageJ (NIH, Bethesda, Maryland, USA) software. The degree of co-localization was analyzed in single cells (cropped from LSM images) by assessing the Pearson coefficient. This is an intensity-based analysis where linear correlation between 2 channels (here lysosomes and PS particles) is measured, giving a value between +1 and −1, where 1 is total positive correlation, 0 is no correlation, and −1 is total negative correlation. Forty cells were analyzed for each condition.
Assessment of lysosome permeability
Lysosome permeability of BMDCs that were incubated for 16 hours with LPS and/or PS particles was measured by flow cytometry using the dye acridine orange (AO; Molecular Probes). BMDCs were stained at 37°C with 5 μg/mL AO for 15 minutes prior to flow cytometry analysis.
ER stress measurement
Total RNA was extracted from BMDCs treated with PS particles and/or LPS for 16 hours (NucleoSpin® RNA isolation kit; Macherey-Nagel, Oensingen, Switzerland). Complementary DNA was synthesized from 2 μg of RNA using the Omniscript™ RT kit (Qiagen, Hombrechtikon, Switzerland). Real-time polymerase chain reactions (PCR) were performed using specific primers for GRP78 (5′ AGCCCACCGTAACAATCAAG and 5′ TCCAGCCATTCGATCTTTTC), CHOP (5′ CTGCCTTTCACCTTGGAGAC and 5′ CGTTTCCTGGGGATGAGATA), spliced XBP1 (5′ GAGTCCGCAGCAGGTGCAG and 5′ ACTGTGAGCGTCCAGCAGGC), IL-6 (5′ GGTGGACAACCACGGCCTTCCC and 5′AAGCCTCCGACTTGTGAAGTGGT) and IL-1β (5′ AAAGCCTCGTGCTGTCGGACC and 5′ CAGGGTGGGTGTGCCGTCTT) (Microsynth, Balgach, Switzerland) and Fast SYBR Green Master Mix (Applied Biosystems®, Lucerne, Switzerland). Reactions were performed using a 7500 Real-Time PCR System (Applied Biosystems®). Gene expression was normalized to 18S RNA (5′ CGCCGCTAGAGGTGAAATTCT and 5′ CATTCTTGGCAAATGCTTTCG). Tunicamycin (2 μg/mL; Sigma-Aldrich) was used as positive control.Citation19
Statistical analysis
All data are presented as mean ± SEM (standard error of the mean). Data were analyzed with ANOVA (one-way analysis of variance) followed by Bonferroni post hoc test. Data were analyzed using GraphPad Prism® (La Jolla, CA, USA) software. Values were considered significantly different with P<0.05 (*), P<0.005 (**), or P<0.001 (***).
Results
PS-particle characterization
Size of PS particles was measured with DLS in both PBS and cell medium containing 10% FCS. We observed a larger size of 20 nm PS particles than the dimensions provided by the manufacturer (31.3 nm in PBS, 43.9 nm in cell medium). When 20 nm PS particles were incubated in medium containing FCS, there was a modest increase in size compared with PBS, though this was still in the nanoscale. For 1,000 nm PS particles, results from DLS measurements confirmed the manufacturer specifications, both in PBS and cell medium (). Most importantly, for both particle sizes, DLS measurements and visual inspection excluded aggregation. Furthermore, samples were under observation for more than 3 days, during which period, stability was preserved. As previously published, the zeta potential for 20 nm PS particles was −15.4±1.4 mV, and for 1,000 nm PS particles, −17.5±1.9 mV.Citation15
PS particles do not induce apoptosis or cell death in BMDCs
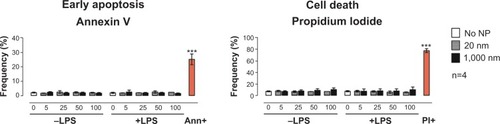
Prior to testing the immunomodulatory effects of PS particles on BMDC functional activity, we screened both PS-particle sizes for potential cytotoxic effects. BMDCs were exposed for 16 hours (overnight) to 20 or 1,000 nm PS particles at concentrations ranging from 5 to 100 μg/mL with or without concomitant LPS. Levels of apoptotic and dead cells were assessed by flow cytometry using Annexin V and propidium iodide stainings, respectively. We did not observe an increase in apoptosis or cell death in BMDCs treated with either size of PS particle compared with the untreated group (). Additionally, BMDC morphology was unaltered by 25 μg/mL PS-particle or LPS treatment as demonstrated with light microscope pictures (). For further experiments, a concentration of 25 μg/mL of PS particles was employed, as this concentration did not induce apparent cytotoxicity and has been shown in another study to be ideal in terms of fluorescence signal and cell viability.Citation20
Figure 1 Assessment of BMDC viability using flow cytometry.
Notes: Frequencies of BMDCs in early apoptosis phase (left) or dead (right) following 16-hour incubation with 20 nm (gray) or 1,000 nm (black) PS particles compared with non-treated cells (white), stained for Annexin V and PI, and measured by flow cytometry. Concentrations of PS particles ranged from 5 to 100 μg/mL. Ann+ (positive control for apoptosis) was obtained by fixation of BMDCs with 1% formalin for 40 minutes. PI+ (positive control for cell death) was obtained by placing BMDCs for 30 minutes at −80°C. Bar graphs show mean ± SEM; ***P<0.001 (positive control versus no NP); n=4.
Abbreviations: Ann, annexin; BMDC, bone marrow–derived dendritic cell; LPS, lipopolysaccharide; NP, nanoparticle; PI, propidium iodide; PS, polystyrene; SEM, standard error of the mean.
PS-particle size determines internalization by BMDCs
To determine the uptake of both sizes of PS particles by BMDCs at different stages of maturation, immature or LPS-matured BMDCs were treated with 25 μg/mL 20 or 1,000 nm PS particles during a time course of 10, 20, 40, 60, and 90 minutes, and 2, 4, 8, and 16 hours. Cells were subsequently washed and labeled with antibodies to CD11c and CD11b and analyzed by flow cytometry. According to the literature, myeloid or conventional DCs that are in vitro derived from bone-marrow cells in the presence of GM-CSF consistently show stable high expression of CD11c and CD11b.Citation16,Citation21 Frequencies of CD11c+/CD11b+ BMDCs containing PS particles were then determined (). Our results showed significantly higher uptake of 20 nm compared with 1,000 nm PS particles in non-LPS-exposed BMDCs at all time-points studied (, left). Uptake of 20 nm PS particles reached a plateau after 20 minutes incubation, with approximately 75% of BMDCs positive for PS particles. In contrast, LPS-exposed BMDCs showed similar uptake for both particle sizes at early time-points, but at later time-points a significantly higher uptake of 20 nm PS particles compared with 1,000 nm PS particles occurred (, right). We observed that uptake of 20 nm PS particles by BMDCs remained stable during all time-points studied, irrespective of LPS exposure, whereas uptake of 1,000 nm PS particles at early time-points (10–90 minutes) was significantly increased in LPS-exposed BMDCs compared with non-LPS-exposed BMDCs ().
Figure 2 Uptake of PS particles by BMDCs determined by flow cytometry and LSM.
Notes: (A) Flow cytometry analysis included gating on CD11b+/CD11c+ BMDCs based on their relevant isotype controls. (B) Frequencies of positive cells for 20 nm (white) or 1,000 nm (black) PS particles were subsequently determined. Left panel shows data for immature BMDCs (−LPS), while right panel shows data for mature BMDCs (+LPS). White bars, 20 nm; black bars, 1,000 nm. Bar graphs show mean ± SEM; *P<0.05, **P<0.005, ***P<0.001 (20 nm versus 1,000 nm PS particles); §P<0.05, §§P<0.005 (−LPS versus +LPS); n=4. (C) Confirmation of PS-particle uptake by BMDCs determined by LSM. Upper micrographs (a–e) show uptake by immature BMDCs (−LPS), while lower micrographs (f–j) show uptake by mature BMDCs (+LPS). xy-projections (top panels) and xz-projections (lower panels) were obtained from three-dimensional stacks of consecutive optical sections. Orange, actin; green, particles; blue, DAPI (nucleus). White bar: 10 μm. Magnification: 63× + 3× digital zoom. One representative experiment from four independent experiments is shown.
Abbreviations: BMDC, bone marrow–derived dendritic cell; DAPI, 4′,6-diamidino-2-phenylindole; LPS, lipopolysaccharide; LSM, laser scanning microscopy; NP, nanoparticle; PS, polystyrene; SEM, standard error of the mean.
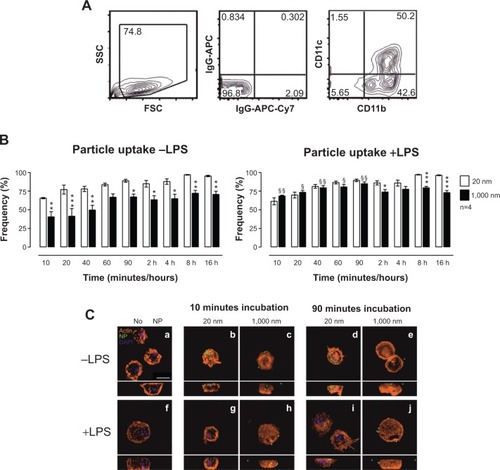
To specifically determine whether PS particles were localized intra- or extracellular, we performed an in-depth analysis of BMDCs by LSM (). As early as 10 minutes after PS-particle exposure, high numbers of 20 nm PS particles were detected inside BMDCs ( [B and G]), compared with low numbers of 1,000 nm PS particles ( [C and H]). In particular, lower magnification analyses provided evidence that although the majority of BMDCs contained 20 nm PS particles at early time-points, only a small number of BMDCs had taken up 1,000 nm PS particles (data not shown). Moreover, most 20 nm PS particles were localized intracellular, whereas a proportion of 1,000 nm PS particles were detected on the outer cell surface. Importantly, no PS particles were localized in cell nuclei at any time-point.
In summary, flow cytometry and LSM analyses demonstrated that both 20 and 1,000 nm PS particles were successfully taken up by BMDCs in a time-dependent manner, although 20 nm PS particles were internalized more rapidly and to a greater extent compared with 1,000 nm PS particles.
Stable BMDC phenotype following treatment with PS particles
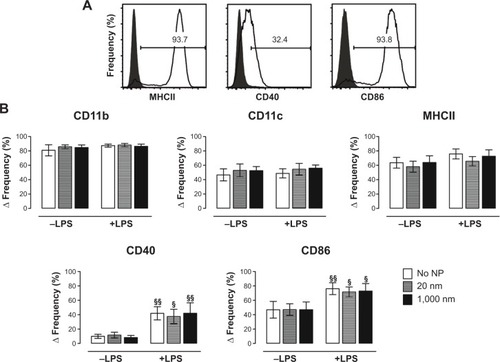
We next aimed to analyze possible changes in BMDC phenotype and expression of co-stimulatory molecules following PS-particle exposure with or without concomitant LPS treatment. Employing flow cytometry with relevant isotype controls, we gated CD11c+/CD11b+ BMDCs to determine MHC class II+ (MHCII+), CD40+, and CD86+ cell frequencies (). The frequencies of CD40+ and CD86+ cells significantly increased upon LPS exposure, but were unaffected by PS-particle treatment of both sizes. In contrast, frequencies of MHCII+ cells remained unchanged by both LPS and/or PS-particle treatment (). Taken together, these findings suggest that neither 20 nor 1,000 nm PS particles induced alterations in BMDC surface phenotype and activation in the absence or presence of LPS-dependent maturation.
Figure 3 Expression of phenotype and co-stimulatory markers utilizing flow cytometry.
Notes: (A) CD11b+/CD11c+ BMDCs were gated based on their relevant isotype controls. Frequencies of expression of MHCII, CD40, and CD86 (open histograms) were subsequently determined based on their adequate isotype control (solid histograms). (B) Frequencies of BMDCs positive for the phenotypic markers CD11b, CD11c, and MHCII (upper panels) and for the co-stimulatory molecules CD40 and CD86 (lower panels) were analyzed. Results are expressed as Δ frequency = measured sample frequency minus measured isotype control frequency. White bars, no particles; gray bars, 20 nm; black bars, 1,000 nm PS particles. Bar graphs show mean ± SEM; §P<0.05, §§P<0.005 (−LPS versus +LPS); n=4 (CD40 and CD86), n=8 (CD11b, CD11c, and MHCII).
Abbreviations: BMDC, bone marrow–derived dendritic cell; LPS, lipopolysaccharide; NP, nanoparticle; PS, polystyrene; SEM, standard error of the mean.
Size 20 nm PS particles modulate antigen degradation in BMDCs
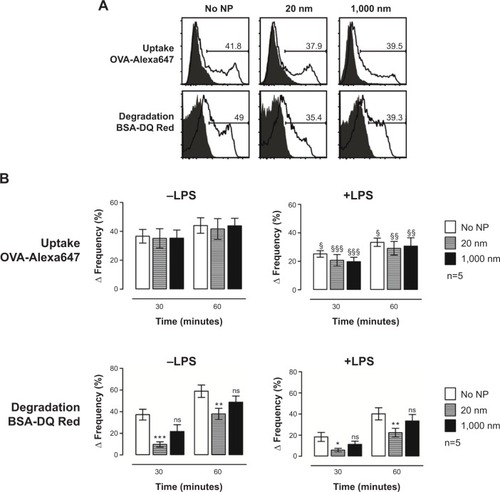
To investigate potential particle-mediated alterations of BMDC function, we investigated the capacity of BMDCs to take up and degrade antigen following PS-particle treatment. As previously reported, OVA coupled to Alexa647 and BSA coupled to DQ-Red were used to analyze antigen uptake and antigen degradation, respectively.Citation18,Citation22–Citation24 The flow cytometry gating strategy from one representative experiment for OVA uptake and BSA degradation by CD11c+/CD11b+ BMDCs is shown in . In the absence of concomitant LPS exposure, OVA uptake was similar in CD11c+/CD11b+ BMDC cultures without particles compared with those incubated with 20 or 1,000 nm PS particles. However, antigen uptake was reduced in LPS-treated BMDCs compared with non-LPS-treated BMDCs, independently of PS-particle exposure (, upper panels). Decreased antigen degradation occurred in BMDCs treated with 20 nm PS particles but not with 1,000 nm PS particles, when compared with the untreated group, both in the presence or absence of LPS (, lower panels). Therefore, although PS particles did not alter antigen uptake by BMDCs, we observed decreased antigen degradation following exposure to 20 nm PS particles, both in immature (−LPS) and mature (+LPS) BMDCs.
Figure 4 Antigen uptake and antigen degradation in the presence of particles and/or LPS, measured utilizing flow cytometry.
Notes: Cells were incubated with OVA-Alexa647 (antigen uptake) or BSA-DQ Red (antigen degradation) during a time course of 0–60 minutes at 37°C or on ice (controls). (A) Histogram plots of one representative experiment. Negative controls (solid histograms) were obtained with cells kept on ice. Open histograms represent antigen uptake (upper panel) or antigen degradation (lower panel) after 60 minutes. (B) Bar graphs show capacity of BMDCs to take up (upper panel) and degrade (lower panel) antigen after 16 hours incubation with 20 nm (gray bars) or 1,000 nm (black bars) PS particles compared with non-treated cells (white bars). Results are expressed as Δ frequency = measured sample frequency (at time-point 30 or 60 minutes) minus measured control frequency (at time-point 0 minutes). Bars show mean ± SEM; *P<0.05, **P<0.005, ***P<0.001 (no NP versus 20 nm); §P<0.05, §§P<0.005, §§§P<0.001 (−LPS versus +LPS), ns, non-significant; n=5.
Abbreviations: BMDC, bone marrow–derived dendritic cell; BSA, bovine serum albumin; LPS, lipopolysaccharide; NP, nanoparticle; OVA, ovalbumin; PS, polystyrene; SEM, standard error of the mean.
Antigen-specific T-cell stimulation by BMDCs remains stable following treatment with PS particles
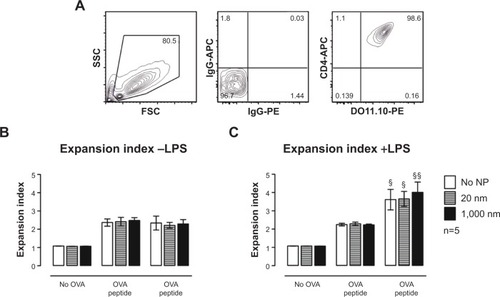
We employed an in vitro OVA-specific DO11.10+/CD4+ T-cell proliferation assay to clarify whether alterations in antigen degradation induced by PS-particle treatment affect downstream antigen presentation and activation of CD4+ T-cells by BMDCs. Following treatment with PS particles with or without LPS, BMDCs were co-cultured with CFSE-labeled transgenic CD4+ T-cells specific for an H-2d-restricted OVA peptide. DO11.10+ (KJ-126+) CD4+ T-cells were gated (), and responses to OVA peptide and whole OVA protein were assessed by analyzing T-cell proliferation (CFSE dilutional profiles) after 72 hours of culture. The expansion index (EI) was measured based on CFSE profiles with the Flow Jo software. The EI is the ratio of final cell count to starting cell count and therefore represents the fold expansion during culture.Citation25 Independently of LPS, the EI remained unchanged for cells treated with PS particles as compared with untreated cells both for OVA peptide and OVA protein pulsed BMDCs (). Significant increases in CD4+ T-cell proliferation occurred in LPS-exposed BMDCs as compared with non-LPS-exposed cultures (). These data therefore suggest that antigen-specific T-cell stimulation by antigen-pulsed BMDCs, using either OVA peptide (antigen-degradation independent) and whole OVA protein (antigen-degradation dependent), remained unaffected by PS-particle exposure of either size.
Figure 5 In vitro OVA-specific DO11.10+/CD4+ T-cell stimulatory capacity of immature and mature BMDCs incubated with 25 μg/mL of 20 or 1,000 nm PS particles in the presence or absence of OVA peptide or OVA protein.
Notes: (A) Gating strategy consists of an FSC/SSC gate (left panel) and an isotype-control gate for CD4+/DO11.10+ T-cells (middle and right panels). Proliferation of DO11.10+/CD4+ T-cells was assessed with the help of Flow Jo software by calculating the expansion index. Results show proliferation of T-cells following co-culture with non-LPS-exposed (B) and LPS-exposed (C) BMDCs in absence of OVA, with 20 μg/mL OVA peptide or with 20 μg/mL whole OVA protein. White bars, no particles; gray bars, 20 nm; black bars, 1,000 nm PS particles. Bars show mean ± SEM; §P<0.05, §§P<0.005 (−LPS versus +LPS); n=5.
Abbreviations: BMDC, bone marrow–derived dendritic cell; LPS, lipopolysaccharide; NP, nanoparticle; OVA, ovalbumin; PS, polystyrene; SEM, standard error of the mean.
PS particle–treated BMDCs do not alter antigen-specific CD4+ T-cell cytokine profiles
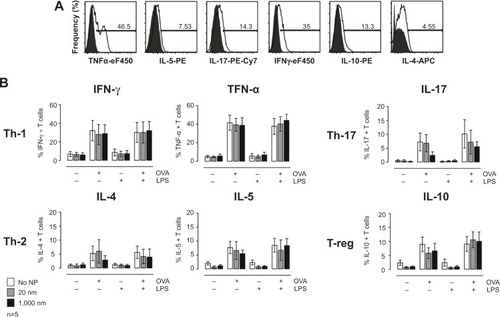
Although PS-particle exposure did not alter BMDC antigen presentation and CD4+ T-cell proliferation, we next determined whether immune responses may be affected by alteration of T-cell cytokine profiles. To test this, DO11.10+/CD4+ T-cells were co-cultured with PS particle–exposed BMDCs (±LPS) for 72 hours in the presence or absence of 20 μg/mL OVA peptide. Production of the cytokines IFN-γ and TNF-α (Th-1), IL-4 and IL-5 (Th-2), IL-17 (Th-17), IL-10 (regulatory T-cells)Citation26 by CD4+ T-cells was assessed by intracellular staining and flow cytometry (). OVA peptide ±LPS, but not LPS alone, induced cytokine production that was not affected by PS-particle treatment of BMDCs.
Figure 6 Cytokine production by DO11.10 transgenic CD4+ T-cells following 72 hours co-culture with BMDCs in absence or presence of LPS and OVA, analyzed by flow cytometry.
Notes: (A) Gating strategy consists in an isotype-control gate for CD4+/DO11.10+ T-cells. Frequencies of positive T-cells for different cytokines (open histograms) were determined based on respective isotype controls (solid histograms). (B) Frequencies of CD4+/DO11.10+ T-cells positive for Th-1 cytokines IFN-γ and TNF-α, Th-2 cytokines IL-4 and IL-5, Th-17 cytokine IL-17, and T-reg cytokine IL-10 are shown. Results are expressed as Δ frequency = measured sample frequency minus measured isotype control frequency. White bars, no particles; gray bars, 20 nm; black bars, 1,000 nm PS particles. Bars show mean ± SEM; n=5.
Abbreviations: BMDC, bone marrow–derived dendritic cell; IFN, interferon; IL, interleukin; LPS, lipopolysaccharide; NP, nanoparticle; OVA, ovalbumin; PS, polystyrene; SEM, standard error of the mean; Th, T helper; TNF, tumor necrosis factor; T-reg, regulatory T-cells.
Size 20 nm PS particles co-localize with lysosomes without increasing lysosome permeability
To understand why antigen degradation was decreased following treatment with 20 nm PS particles but not with larger 1,000 nm PS particles, we analyzed the extent to which PS particles co-localized with lysosomes, as these organelles are the site where antigen degradation takes place. Following 16 hours incubation with 25 μg/mL PS particles, lysosomes were stained using the lysosomal marker LysoTracker® Deep Red, which labels acidic organelles,Citation3,Citation27–Citation29 and examined by confocal microscopy. While almost all 20 nm PS particles co-localized with lysosomes, fewer 1,000 nm PS particles co-localized in lysosomes (, arrows). We next quantified co-localization using the Pearson coefficient. A significant increase in co-localization with lysosomes occurred following incubation with 20 nm compared with 1,000 nm PS particles in both untreated and LPS-treated BMDCs (). In addition, co-localization of 20 nm PS particles in LPS-treated BMDCs was higher than in non-treated BMDCs (). To exclude that PS-particle fluorescence changes occurred at acidic pH in lysosomes, potentially influencing particle detection, we investigated the emission fluorescence intensity of PS particles in buffer solutions at pH 5 and pH 7 at different time-points. No significant differences in fluorescence intensity occurred at pH 5 and pH 7 for both 20 and 1,000 nm PS particles at all time-points ().
Figure 7 Interaction of PS particles with lysosomes analyzed by LSM and flow cytometry.
Notes: (A) Upper micrographs show co-localization with 20 nm PS particles in immature BMDCs (−LPS), whereas lower micrographs show co-localization with 1,000 nm PS particles. Micrographs were obtained from three-dimensional stacks of consecutive optical sections and analyzed with Imaris® software. Gray, cell membrane; green, PS particles; violet, lysosomes; white, co-localization of lysosomes and PS particles. White bars: 10 μm. Magnification: 63× + 3× digital zoom. Arrows: PS particles not co-localized with lysosomes. One representative experiment from four independent experiments is shown. (B) Quantitative analysis of co-localization between PS particles and lysosomes using Image J software. Four independent experiments were performed, and for each condition, 40 cells in total were selected randomly and analyzed. White bars, −LPS; gray bars, +LPS. Bar graphs show mean ± SEM; **P<0.005, ***P<0.001. (C) Histogram plots for BMDCs stained with AO and analyzed by flow cytometry. AO-negative gating was used to assess the percentage of AOlow BMDCs showing lysosomal leakage. No NP, gray solid histogram; 20 nm, blue open histogram; 1,000 nm, red open histogram. (D) Frequencies of AOlow BMDCs following 16 hours incubation with 25 μg/mL 20 nm (gray) or 1,000 nm (black) PS particles. Bars show mean ± SEM; §P<0.05, §§P<0.005 (−LPS versus +LPS); n=5.
Abbreviations: AO, acridine orange; BMDC, bone marrow–derived dendritic cell; LPS, lipopolysaccharide; LSM, laser scanning microscopy; NP, nanoparticle; PS, polystyrene; SEM, standard error of the mean.
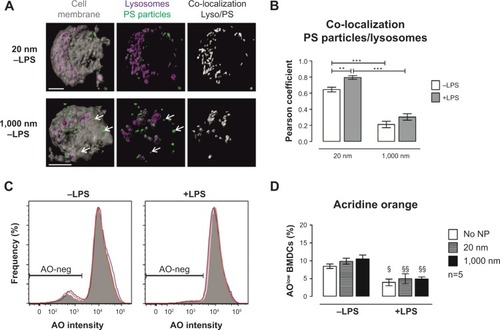
We further assessed whether PS particles could affect lysosomal membrane integrity and therefore induce leakage of lysosomal enzymes into the cytosol, by using the dye AO. AO accumulates in lysosomes and leads to red fluorescence, which decreases when the dye leaks out of the lysosomes into the cytosol due to increased permeability. AO-negative gating was used to assess the percentage of AOlow BMDCs, which represents cells with lower AO fluorescence intensity, thus permeable lysosomes (). We observed that incubation with 25 μg/mL of both 20 and 1,000 nm PS particles did not increase permeability of lysosomes (), providing evidence that lysosomes remain intact at the concentrations utilized.
PS particles do not induce ER stress in BMDCs
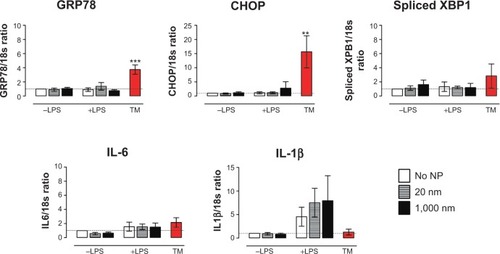
One stage in antigen degradation involves synthesis of MHC class II molecules in the ER. Following synthesis, MCHII molecules are transported to endosomal vesicles, where they are loaded with antigen-derived peptides.Citation30 To identify potential adverse effects of PS particles on this phase of antigen processing, we assessed ER stress in BMDCs which were previously incubated with 25 μg/mL PS particles. The ER stress response is triggered when an accumulation of misfolded or unfolded proteins is found in the lumen of the ER under stress conditions.Citation31,Citation32 Expression of different ER stress gene markers such as GRP78 chaperone and adaptive pathways CHOP and spliced XBP1 were measured by real-time-PCR. Expression of the pro-inflammatory cytokines IL-1β and IL-6 was also determined. Tunicamycin, a known ER stress inducer, was employed as positive control for ER stress. Treatment of BMDCs with PS particles did not trigger an increased expression of messenger RNA (mRNA) encoding GRP78, CHOP and spliced XBP1, or transcription of the genes encoding the cytokines IL-1β and IL-6 (). Treatment of cells with LPS induced, as expected, an expression of IL-1β mRNA; this was, however, unchanged in the presence of PS particles. These results indicate that PS particles did not induce an apparent ER stress response in BMDCs.
Figure 8 Messenger RNA expression level of different markers for endoplasmic reticulum stress measured by real-time-PCR in BMDCs following PS-particle exposure.
Notes: Expression of GRP78, CHOP, and XBP1, as well as pro-inflammatory cytokines IL1-β and IL-6 were assessed in cells left untreated (white) or incubated overnight with 25 μg/mL 20 nm (gray) or 1,000 nm (black) PS particles. Expression levels of genes of interest were normalized to 18S gene expression. All ratios were normalized to the ratio of No NP −LPS (BMDCs unexposed to PS particles and untreated with LPS). Red bars show expression level for TM, a positive control for endoplasmic reticulum stress. Bar graphs show mean ± SEM; **P<0.005, ***P<0.001 (TM versus no NP −LPS); n=4.
Abbreviations: BMDC, bone marrow–derived dendritic cell; LPS, lipopolysaccharide; NP, nanoparticle; PCR, polymerase chain reaction; PS, polystyrene; TM, tunicamycin; SEM, standard error of the mean; IL, interleukin.
Discussion
Despite recent intensive research in the field of nanomedicine, fundamental knowledge about nanomaterial–cell interactions is still insufficient, particularly in understanding effects on the immune system. It has been recognized to date that NP–cell interactions are affected by a number of diverse particle properties, such as size, shape, and surface charge. In this study, we aimed to analyze size-dependent effects on BMDCs during treatment with nanosized (20 nm) and microsized (1,000 nm) PS particles in an in vitro model. The scope of the present study was to focus on particle size in order to systematically and thoroughly analyze size-dependent effects, and therefore only PS particles were included in the present study. Further evaluations are in progress employing a recently established fluorescence-encoded gold-NP library with different surface modificationsCitation33 in order to understand surface-dependent effects. The underlying study is complementary to our recent work showing that in vivo lung DC subpopulations preferentially capture and traffic 20 nm PS particles compared with 1,000 nm PS particles, where smaller particles induce enhanced CD4+ T-cell proliferation in draining lymph nodes.Citation15 In the current study, we provided an exhaustive investigation into particle-dependent modulation of DC function and showed that treatment with particles did not affect cell viability, surface phenotype (CD11c and CD11b), or activation (CD40, CD86, and MHCII) markers. Although particle treatment did not modulate antigen uptake, 20 nm PS particles decreased the capacity of BMDCs to degrade antigen irrespective of LPS exposure, compared with larger 1,000 nm PS particles that did not modulate BMDC function. For both PS-particle sizes, BMDC-mediated antigen-specific stimulation of CD4+ T-cells and induction of cytokines remained similar to non-particle-exposed control cells. Furthermore, we observed that co-localization of 20 nm PS particles with lysosomes was significantly higher compared with 1,000 nm PS particles, without measurable perturbation of lysosomal function or ER stress.
We adopted a widely employed robust model utilizing submersed cultures of BMDCs to allow straightforward administration of PS particles and analyses by flow cytometry and confocal microscopy. Nevertheless, it is central to interpret the data in the context of the particle application method employed in this study (as described in the Methods section): for every particle size, a suspension containing 25 μg/mL of PS particles was administrated; hence, there is a 125,000-fold difference in particle numbers at the extremes between 20 and 1,000 nm PS particles. This difference in particle number could theoretically influence particle uptake by BMDCs measured by determining fluorescence intensities. This potential bias in particle numbers is countered by limitations in detection sensitivity by flow cytometry: While fluorescence emitted from a single 1,000 nm PS particle is highly above detection threshold and can therefore easily be detected by flow cytometry, this is not the case for single 20 nm PS particles (data not shown). Therefore, with our approach that heavily relied on detecting and tracing sufficiently fluorescent particles over a wide size range, utilizing equal particle mass was the most appropriate strategy to account for size-dependent variations in fluorescence intensities.Citation15 The resolution of microscopy is limited to approximately 200 nm in lateral and 500 nm in axial dimension.Citation34 Although single 20 nm PS particles cannot be distinguished, the number of pixels generating a signal event can be quantified. As previously reported, we employed this approach to analyze both 20 and 1,000 nm PS particlesCitation15 or fluorescent-magnetic hybrid NPs.Citation34
In line with our findings, a previous study by Frick et alCitation35 showed that human DCs incubated with negatively charged phosphonated and sulfonated PS particles of an average diameter of 245 and 227 nm, respectively, at concentrations of 25, 75, and 150 μg/mL for 24 hours does not cause significant apoptosis. Another study by Zupke et alCitation20 determined that only larger PS particles (100 and 500 nm) at a concentration of 50 μg/mL for 24, 48, and 72 hours induced significant cytotoxicity in NIH 3T3 fibroblast cells compared with smaller PS particles (50 nm). In fact, even though PS particles employed in our study are often considered to be chemically inert and safe, it is essential to realize that such particles may induce biological effects partly associated with surface charge.Citation36 It is indeed often reported that positively charged PS particles trigger cell death even at low concentrations when compared with neutral or negatively charged particles, indicating that the surface coating plays a major role in cell death induced by particles.Citation3,Citation37,Citation38 Since we employed negatively charged PS particles for our exposures, the low levels of cell death found following PS-particle treatment can be explained by the negative surface charge of our PS particles.
We also provided evidence for a differential uptake of 20 and 1,000 nm PS particles by immature (non-LPS-exposed) BMDCs. In immature BMDCs, uptake of 20 nm PS particles reached an early plateau after 20 minutes, whereas this only occurred after 60 minutes for 1,000 nm PS particles. The frequency of particle-positive BMDCs was always lower for 1,000 nm than for 20 nm PS particles. Employing cell lines, a human in vitro study with negatively charged PS particles ranging from 40 nm to 2 μm showed that uptake was also size-dependent for all cell lines tested.Citation39 As expected, it was also demonstrated that phagocytic cells have a much higher internalization capacity compared with other cell types, although all NPs tested still could enter all cell lines.Citation39 Moreover, when monitoring size-dependent uptake, Johnston et alCitation40 reported limited uptake of 200 nm compared with 20 nm PS particles in human hepatocytes. In line with our study, a study by Foged et alCitation41 also confirmed that optimal particle diameter for rapid uptake by human immature DCs is below 50 nm. Pathways by which NPs enter cells are to date still not fully understood and depend on cell type, size, surface charge, shape, and bulk material of NPs used.Citation39,Citation42,Citation43 Rejman et alCitation44 found that internalization of particles smaller than 200 nm involves clathrin-mediated endocytosis, while with increasing particle size caveolae-mediated internalization occurs. Another study showed that larger PS particles (200 nm) are found on the cell surface,Citation40 suggesting that larger particles could be bound to receptors on the plasma membrane prior to internalization. Moreover, in another study from our group, we employed the J774A.1 mouse macrophage cell line to compare uptake of 1,000 nm and 40 nm PS particles using different inhibitors of endocytotic pathways (Kuhn et al, unpublished data, 2014). We found that 40 nm PS particles undergo clathrin-mediated uptake and macropinocytosis or phagocytosis, while 1,000 nm PS particles are taken up only by macropinocytosis or phagocytosis.
A salient finding in the present study is that uptake of 20 nm PS particles by BMDCs was unchanged following LPS exposure, whereas uptake of 1,000 nm PS particles was increased in LPS-exposed BMDCs. These results are contrary to our general understanding that immature DCs are endowed with ability for antigen uptake but with a poor capacity to present antigen to naïve T-cells. In response to antigen encounter or danger signals such as LPS, DCs undergo maturation and are capable to prime naïve T-cells while shutting down their ability for antigen uptake.Citation12,Citation45 A potential explanation for increased uptake of larger particles may be that immature BMDCs, upon activation by LPS, increase the number of dendrites and therefore their surface area. Larger PS particles may therefore more readily adhere and be taken up by BMDCs. These findings should, however, be further investigated. It was noteworthy, however, that although PS-particle uptake was not affected by LPS stimulation, our data confirmed that LPS exposure and maturation of BMDCs decreased their capacity for uptake of soluble antigen (OVA).
DCs are key players in induction of immune responses, and their function is closely influenced by their level of so-called maturation. Maturation of DCs is known to be mediated by different danger signals such as microbial products and results in upregulated expression of co-stimulatory molecules.Citation46 To assess effects of PS-particle incubation on BMDCs, we analyzed BMDC maturation and phenotype after PS-particle treatment. Our data showed that PS-particle treatment did not induce or alter maturation of BMDCs, as frequencies of cells expressing MHC Class II, CD40, and CD86 remained unaffected. Findings reported in the literature regarding capacity of PS particles to induce maturation of immune cells also show that with similar conditions (concentration and incubation time), no significant difference in expression levels of activation markers occurs following incubation with PS particles.Citation20,Citation35
Another aspect of DC immune function is the capacity of antigen uptake and antigen degradation. While uptake of labeled OVA protein was not altered by the presence of PS particles, degradation of antigen was downregulated in BMDCs treated with 20 nm PS particles, but not with 1,000 nm PS-particle treatment. The model antigen OVA employed in antigen-uptake experiments was endotoxin-free and not modified by the addition of carbohydrate moieties; therefore, as myeloid C-type lectin receptors (CLR) on immune cells such as DCs recognize carbohydrate moieties on antigen,Citation47 it is unlikely that CLR-binding of OVA-Alexa647 accounts for the extent of antigen uptake observed. These new findings confirm that particle size may represent a relevant parameter determining DC function, as only BMDCs treated with nanosized particles were unable to fully degrade or process OVA antigen. Interestingly, the capacity of particle-treated BMDCs to stimulate CD4+ T-cells remained stable when compared with untreated BMDCs, indicating that decreased antigen degradation did not affect induction of T-cell proliferation. Indeed, although antigen degradation capacity was significantly decreased in the present study, it was not completely shut down. We suggest that the reduced level of antigen degradation was still sufficient to induce measurable antigen-specific CD4+ T-cell proliferation. Other in vitro studies using PS particles show divergent findings concerning their immune-modulatory potential.Citation20,Citation35 In a recent in vivo study, we showed that negatively charged 20 nm PS particles are able to enhance antigen presentation to CD4+ T-cells in lung-draining lymph nodes.Citation15 Also, another study in vivo demonstrated that glycine-coated PS particles of 50 nm markedly dampen the ability of CD11b+ DCs in lung-draining lymph nodes to stimulate OVA-specific T-cells.Citation48
In addition to antigen uptake, antigen degradation and T-cell stimulatory capacity, cytokine production in CD4+ T-cells co-cultured with particle-exposed BMDCs was assessed. Our study showed no influence of PS particles on expression of all cytokines tested, suggesting that particle-exposed BMDCs did not alter the T helper (Th) cell cytokine profiles. Results reported in the literature are discordant on particle-dependent effects on Th profiles. For instance, a Th-1 shift with increased IFN-γ production was measured in human immature DCs treated with 75 μg/mL positively charged PS particles,Citation35 while an in vivo study showed that PS particles do not induce an increase in BAL fluid IFN-γ or IL-17 but prevented Th-2 immunity.Citation48 Johrden et alCitation49 also demonstrated that production of IFN-γ by CD4+ and CD8+ T-cells is not increased following incubation with PS particles. These findings further reveal that comparability between studies is often limited. Indeed, many parameters may have been an influence when investigating NP potential to modulate immune cells: size, coating, and surface charge of the administered NPs, but also responder T-cell types utilized, concentration of particles, endotoxin contamination, or incubation time.
In search of an explanation for reduced antigen degradation in BMDCs following exposure to 20 nm PS particles, we detected increased co-localization with lysosomes compared with 1,000 nm PS particles, but without causing measurable changes in lysosomal permeability. Recent studies indicate that NP toxicity is associated with oxidative stress and inflammation, but underlying mechanisms are not known in detail.Citation50–Citation52 Among other potential mechanisms, lysosomal dysfunction and impairment of autophagy have been described to be a consequence of NP–cell interactions.Citation53 There are different possible ways by which NPs can induce these alterations. It was first shown by several studies that since NPs are sequestered in lysosomes they could accumulate in those compartments and induce lysosomal dysfunction by inducing membrane permeability or defects in lysosomal trafficking.Citation27,Citation29,Citation54 We could show that particles were mainly localized in vesicles, including lysosomes, but not in other cellular compartments such as mitochondria or the cell nucleus. By applying a quantitative analysis by stereology on transmission electron microscopy, which has a much higher resolution, we showed that the preferred particle localization is in vesicles.Citation55 Also, it was proposed by Monick et alCitation56 that lysosomal overload by particles induces blockade of autophagy flux in alveolar macrophages from smokers, resulting in mitochondrial dysfunction and cytotoxicity. Moreover, overloading lysosomes with indigestible nanomaterials such as gold, was shown to block autophagosome–lysosome fusion and lysosomal degradation.Citation28 This finding may therefore indicate that supposedly inert, yet biopersistent nanomaterials such as PS may not cause direct toxicity or cellular effects, but may be of greater concern, as they accumulate in lysosomes where they are not degraded properly and might block other key cellular functions in DC such as antigen degradation.
To further understand possible causes for impaired antigen degradation capacity, we thoroughly investigated potential size-dependent induction of ER stress and expression of pro-inflammatory cytokines by measuring respective mRNA levels of ER stress gene markers GRP78, CHOP, and spliced XBP1 and the pro-inflammatory markers IL-1β and IL-6. Neither particle size was found to induce ER stress or expression of pro-inflammatory cytokine mRNA. As a major indicator of ER stress, GRP78 (78 kDa glucose-regulated protein, also called BiP) is an ER chaperone protein holding stress-sensing proteins in an inactivate state in normal conditions.Citation57 Upon ER stress, IRE1, a transmembrane protein, mediates the removal and thus splicing of an intron from XBP1 (x-box binding protein 1) mRNA. This spliced form of XBP1 is then an effective transcription factor that translocates to the nucleus for transcription of various genes such as GRP78. As previously reported, in humans, XBP1 is also required for the transcription of MHCII genes.Citation58,Citation59 CHOP (C/EBP homologous protein, also called DNA damage-inducible transcript 3) is involved in ER stress–related apoptosis and is upregulated when there is unsuccessful cell recovery. It has been reported in different studies that the three markers for ER stress response we measured are reliable for the detection of ER stress and that these are upregulated following incubation with silver and poly(lactic-co-glycolic acid) NPs.Citation31,Citation60 We are not aware of any study investigating ER stress during PS-particle exposure. Therefore, we here report for the first time data suggesting that PS particles of either size did not induce ER stress response, inflammation, and apoptosis, contrary to other NP types.
To our knowledge, the underlying study provided initial evidence in the field that nanosized particles accumulate in lysosomes, affecting key lysosomal functions such as antigen degradation. Moreover, we also showed that these effects were size-dependent, as only NPs (20 nm) but not microparticles (1,000 nm) of the same material caused impaired antigen degradation. Therefore, particle size is a relevant parameter determining DC function and may critically influence downstream immune responses. Although other BMDC functions such as antigen uptake or antigen-specific CD4+ T-cell stimulation remained unaffected, these data highlight the complexity of cellular interactions with supposedly inert, yet biopersistent, nanomaterials causing functional alterations in key immune cells such as DCs through congestion of the lysosomal compartment. It is tempting to speculate that a larger amount of 20 nm PS particles with a relatively greater surface area might lead to increased absorption of proteolytic enzymes in lysosomes – further investigations will be necessary to understand the mechanisms involved. These findings have important implications for the future design of novel therapeutic nanocarriers that may require either an enhanced or dampened immune response to unfold their clinical effects.
Acknowledgments
We gratefully acknowledge the expert technical assistance provided by Patrizia Facklam, Dimitri Vanhecke, and Aline Schoegler, as well as Laura Morf for helpful discussions. Microscopy acquisition and analysis were performed with the support of the Microscopy Imaging Center at the University of Berne, Switzerland.
Supplementary materials
Figure S1 Assessment of BMDC viability using light microscopy.
Notes: Images show that BMDC morphology was not altered by 25 μg/mL PS-particle and LPS treatment. Black bar: 100 μm. Magnification: 20×.
Abbreviations: BMDC, bone marrow–derived dendritic cell; LPS, lipopolysaccharide; NP, nanoparticle; PS, polystyrene.
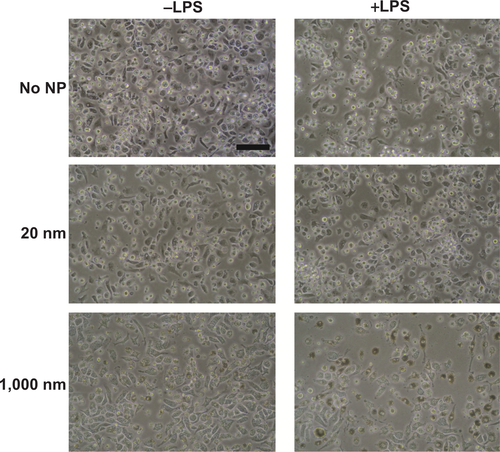
Figure S2 Assessment of emission fluorescence intensity of PS particles in buffer solutions at pH 5 and pH 7 after 10 minutes, 1 hour, 4 hours, and 16 hours incubation.
Notes: Measurements were performed to determine stability of PS-particle fluorescence under physiologic and acidic pH conditions. PS particles were diluted at a concentration of 25 μg/mL in 0.1 M acetate buffer solution at pH 5 and 0.1 M phosphate buffer at pH 7. Fluorescence intensities were determined at the respective excitation and emission wavelengths specific for each PS particle and given by the manufacturer (20 nm, 505/515 nm; 1000 nm, 441/486 nm). Results are expressed as Δ Intensity = measured sample fluorescence intensity minus measured blank (phosphate-buffered saline) fluorescence intensity. Measurements were performed on an Infinite M1000 PRO (Tecan, Männedorf, Switzerland). Three independent experiments were performed (n=3); for each experiment, five measurements with identical parameters were averaged.
Abbreviation: PS, polystyrene.
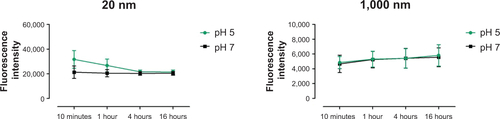
Table S1 Size measurement of 20 nm and 1,000 nm polystyrene particles employing DLS
Disclosure
This study was funded by the Swiss National Science Foundation grants 320030-122355 and NFP64 406440-131266. The authors have no other affiliations or financial involvement with any organization or entity with a financial interest. The authors have no other conflicts of interest in this work.
References
- FadeelBGarcia-BennettAEBetter safe than sorry: understanding the toxicological properties of inorganic nanoparticles manufactured for biomedical applicationsAdv Drug Deliv Rev201062336237419900497
- MahonESalvatiABaldelli BombelliFLynchIDawsonKADesigning the nanoparticle-biomolecule interface for “targeting and therapeutic delivery”J Control Release2012161216417422516097
- XiaTKovochichMLiongMZinkJINelAECationic polystyrene nanosphere toxicity depends on cell-specific endocytic and mitochondrial injury pathwaysACS Nano200821859619206551
- CliftMJDRothen-RutishauserBBrownDMThe impact of different nanoparticle surface chemistry and size on uptake and toxicity in a murine macrophage cell lineToxicol Appl Pharmacol2008232341842718708083
- ThieleLRothen-RutishauserBJilekSWunderli-AllenspachHMerkleHPWalterEEvaluation of particle uptake in human blood monocyte-derived cells in vitro. Does phagocytosis activity of dendritic cells measure up with macrophages?J Control Release2001761–2597111532313
- PetrosRADeSimoneJMStrategies in the design of nanoparticles for therapeutic applicationsNat Rev Drug Discov20109861562720616808
- Von GarnierCNicodLPImmunology taught by lung dendritic cellsSwiss Med Wkly200913913–1418619219137454
- VermaelenKPauwelsRPulmonary dendritic cellsAm J Respir Crit Care Med2005172553055115879415
- KundaNKSomavarapuSGordonSBHutcheonGASaleemIYNanocarriers targeting dendritic cells for pulmonary vaccine deliveryPharm Res201330232534123054093
- TonnisWFKerstenGFFrijlinkHWHinrichsWLJde BoerAHAmorijJ-PPulmonary vaccine delivery: a realistic approach?J Aerosol Med Pulm Drug Deliv201225524926022856876
- ShortmanKBurnet oration: dendritic cells: multiple subtypes, multiple origins, multiple functionsImmunol Cell Biol200078216116510762417
- BanchereauJBriereFCauxCImmunobiology of dendritic cellsAnnu Rev Immunol20001876781110837075
- SteinmanRMBanchereauJTaking dendritic cells into medicineNature2007449716141942617898760
- HancockDGGuyTVShklovskayaEExperimental models to investigate the function of dendritic cell subsets: challenges and implicationsClin Exp Immunol201317114715423286941
- BlankFStumblesPASeydouxESize-dependent Uptake of Particles by Pulmonary APC Populations and Trafficking to Regional Lymph NodesAm J Respir Cell Mol Biol201349677723492193
- LutzMBKukutschNOgilvieALAn advanced culture method for generating large quantities of highly pure dendritic cells from mouse bone marrowJ Immunol Methods19992231779210037236
- Von GarnierCWikstromMEZoskyGAllergic airways disease develops after an increase in allergen capture and processing in the airway mucosaJ Immunol200717995748575917947647
- BlankFGerberPRothen-RutishauserBBiomedical nanoparticles modulate specific CD4(+) T cell stimulation by inhibition of antigen processing in dendritic cellsNanotoxicology2011560662121231795
- SchönthalAHEndoplasmic reticulum stress: its role in disease and novel prospects for therapyScientifica (Cairo)2012201285751624278747
- ZupkeODistlerEBaumannDBiomaterials preservation of dendritic cell function upon labeling with amino functionalized polymeric nanoparticlesBiomaterials201031277086709520573395
- KarlsonTDLKongYYHardyCLXiangSDPlebanskiMThe signalling imprints of nanoparticle uptake by bone marrow derived dendritic cellsMethods201360327528323459257
- DaroEPulendranBBraselKPolyethylene glycol-modified GM-CSF expands CD11b high CD11b high but not CD11b low CD11c high murine dendritic cells in vivo: a comparative analysis with Flt3 ligandJ Immunol2000165495810861034
- AutenriethSEAutenriethIBVariable antigen uptake due to different expression of the macrophage mannose receptor by dendritic cells in various inbred mouse strainsImmunology2009127452352919175795
- TardifVRiquelmeSARemySCarbon monoxide decreases endosome-lysosome fusion and inhibits soluble antigen presentation by dendritic cells to T cellsEur J Immunol201343112832284423852701
- RoedererMInterpretation of cellular proliferation data: avoid the panglossianCytometry20117929510121265003
- KopfMBachmannMFMarslandBJAverting inflammation by targeting the cytokine environmentNat Rev Drug Discov20109970371820811382
- WuH-YChungM-CWangC-CHuangC-HLiangH-JJanT-RIron oxide nanoparticles suppress the production of IL-1beta via the secretory lysosomal pathway in murine microglial cellsPart Fibre Toxicol20131014624047432
- MaXWuYJinSGold nanoparticles induce autophagosome accumulation through size-dependent nanoparticle uptake and lysosome impairmentACS Nano20115118629863921974862
- FröhlichEMeindlCRobleggEEbnerBAbsengerMPieberTRAction of polystyrene nanoparticles of different sizes on lysosomal function and integrityPart Fibre Toxicol2012912622789069
- RochaNNeefjesJMHC class II molecules on the move for successful antigen presentationEMBO J20082711518046453
- ChristenVCapelleMFentKSilver nanoparticles induce endoplasmatic reticulum stress response in zebrafishToxicol Appl Pharmacol2013272251952823800688
- AdolphT-ENiederreiterLBlumbergRSKaserAEndoplasmic reticulum stress and inflammationDig Dis201230434134622796794
- Rodriguez-LorenzoLFytianosKBlankFvon GarnierCRothen-RutishauserBPetri-FinkAFluorescence-Encoded Gold Nanoparticles: Library Design and Modulation of Cellular Uptake into Dendritic CellsSmall2014110
- LehmannADParakWJZhangFFluorescent-magnetic hybrid nanoparticles induce a dose-dependent increase in proinflammatory response in lung cells in vitro correlated with intracellular localizationSmall20106675376220205203
- FrickSUBacherNBaierGMailänderVLandfesterKSteinbrinkKFunctionalized polystyrene nanoparticles trigger human dendritic cell maturation resulting in enhanced CD4+ T cell activationMacromol Biosci201212121637164723042770
- FröhlichEThe role of surface charge in cellular uptake and cytotoxicity of medical nanoparticlesInt J Nanomedicine201275577559123144561
- LiuYLiWLaoFIntracellular dynamics of cationic and anionic polystyrene nanoparticles without direct interaction with mitotic spindle and chromosomesBiomaterials201132328291830321810539
- NemmarAHoylaertsMFHoetPHVermylenJNemeryBSize effect of intratracheally instilled particles on pulmonary inflammation and vascular thrombosisToxicol Appl Pharmacol20031861384512583991
- Dos SantosTVarelaJLynchISalvatiADawsonKAQuantitative assessment of the comparative nanoparticle-uptake efficiency of a range of cell linesSmall20117233341334922009913
- JohnstonHJSemmler-BehnkeMBrownDMKreylingWTranLStoneVEvaluating the uptake and intracellular fate of polystyrene nanoparticles by primary and hepatocyte cell lines in vitroToxicol Appl Pharmacol20102421667819799923
- FogedCBrodinBFrokjaerSSundbladAParticle size and surface charge affect particle uptake by human dendritic cells in an in vitro modelInt J Pharm2005298231532215961266
- ThieleLMerkleHPWalterEPhagocytosis and phagosomal fate of surface-modified microparticles in dendritic cells and macrophagesPharm Res200320222122812636160
- HillaireauHCouvreurPNanocarriers’ entry into the cell: relevance to drug deliveryCell Mol life Sci200966172873289619499185
- RejmanJOberleVZuhornISHoekstraDSize-dependent internalization of particles via the pathways of clathrin- and caveolae-mediated endocytosisBiochem J2004377Pt 115916914505488
- UphamJStumblesPAWhy are dendritic cells important in allergic diseases of the respiratory tract?Pharmacol Ther20031001758714550506
- BlankFvon GarnierCObregonCRothen-RutishauserBGehrPNicodLRole of dendritic cells in the lung: in vitro models, animal models and human studiesExpert Rev Respir Med20082221523320477250
- MaglinaoMErikssonMSchlegelMKA platform to screen for C-type lectin receptor-binding carbohydrates and their potential for cell-specific targeting and immune modulationJ Control Release2014175364224368301
- HardyCLLeMasurierJSBelzGTInert 50-nm polystyrene nanoparticles that modify pulmonary dendritic cell function and inhibit allergic airway inflammationJ Immunol201218831431144122190179
- JohrdenLTenbuschMLietzRComparison of polystyrene nanoparticles and UV-inactivated antigen-displaying adenovirus for vaccine delivery in miceVirol J2013101523279912
- SternSTAdiseshaiahPPCristRMAutophagy and lysosomal dysfunction as emerging mechanisms of nanomaterial toxicityPart Fibre Toxicol2012912022697169
- PelazBCharronGPfeifferCInterfacing engineered nanoparticles with biological systems: anticipating adverse nano-bio interactionsSmall201399–101573158423112130
- LiNXiaTNelAEThe role of oxidative stress in ambient particulate matter-induced lung diseases and its implications in the toxicity of engineered nanoparticlesFree Radic Biol Med20084491689169918313407
- LevineBEating oneself and uninvited guests: autophagy-related pathways in cellular defenseCell2005120215916215680321
- LunovOSyrovetsTLoosCAmino-functionalized polystyrene nanoparticles activate the NLRP3 inflammasome in human macrophagesACS Nano20115129648965722111911
- BrandenbergerCMühlfeldCAliZQuantitative evaluation of cellular uptake and trafficking of plain and polyethylene glycol-coated gold nanoparticlesSmall20106151669167820602428
- MonickMMPowersLSWaltersKIdentification of an autophagy defect in smokers’ alveolar macrophagesJ Immunol201018595425543520921532
- ChenRHuoLShiXEndoplasmic reticulum stress induced by zinc oxide nanoparticles is an earlier biomarker for nanotoxicological evaluationACS Nano2014832562257424490819
- HeYSunSShaHEmerging roles for XBP1, a sUPeR transcription factorGene Expr2010151132521061914
- IwakoshiNNPypaertMGlimcherLHThe transcription factor XBP-1 is essential for the development and survival of dendritic cellsJ Exp Med2007204102267227517875675
- HouCCTsaiTLSuWPPronounced induction of endoplasmic reticulum stress and tumor suppression by surfactant-free poly(lactic-co-glycolic acid) nanoparticles via modulation of the PI3K signaling pathwayInt J Nanomedicine201382689270723940416