
Abstract
Purpose
Currently approved therapies for multiple sclerosis (MS) at best only slow down its progression. Therefore, it is necessary to utilize novel technologies in order to synthesize smart multifunctional structures. In the present study, for the first time we evaluated the therapeutic potential of MSc1 nanocomplex, which was designed based on novel nanochelating technology.
Materials and methods
MSc1 cell-protection capacity, with and without iron bond, was evaluated against hydrogen peroxide (H2O2)-induced oxidative stress in cultured rat pheochromocytoma-12 cells. The ability of MSc1 to maintain iron bond at pH ranges of 1–7 was evaluated. Nanocomplex toxicity was examined by estimating the intraperitoneal median lethal dose (LD50). Experimental autoimmune encephalomyelitic mice were injected with MSc1 14 days after disease induction, when the clinical symptoms appeared. The clinical score, body weight, and disease-induced mortality were monitored until day 54. In the end, after collecting blood samples for assessing hemoglobin and red blood cell count, the brains and livers of the mice were isolated for hematoxylin and eosin staining and analysis of iron content, respectively.
Results
The results showed that MSc1 prevented H2O2-induced cell death even after binding with iron, and it preserved its bond with iron constant at pH ranges 1–7. The nanocomplex intraperitoneal LD50 was 1,776.59 mg/kg. MSc1 prompted therapeutic behavior and improved the disabling features of experimental autoimmune encephalomyelitis, which was confirmed by decreased clinical scores versus increased body mass and 100% survival probability. It did not cause any adverse effects on hemoglobin or red blood cell count. Histopathological studies showed no neural loss or lymphocyte infiltration in MSc1-treated mice, while the hepatic iron content was also normal.
Conclusion
These results demonstrate that MSc1 could be a promising beneficial novel agent and has the capacity to be evaluated in further studies.
Introduction
Although employing IFNβ and glatiramer acetate has been a major advance in treating multiple sclerosis (MS), their effects are limited and marginal, and in many cases they fail to prevent MS progression.Citation1,Citation2 Moreover, some of the recently approved medications also prompt unexpected and undesired side effects, such as unusual central nervous system infections and opportunistic and uncommon neoplasms.Citation3–Citation5 While both the cause and cure for MS remain elusive, different genetic and environmental factors have been implicated in its pathogenesis.Citation6 Traditionally, MS has been classified and studied as an autoimmune disease in which the immune system reacts against self-antigens with loss of tolerance.Citation7,Citation8 Many of the older approved therapies for MS such as IFNβs have been developed based on this hypothesis. In fact, MS is a complex disease,Citation9 and abnormal immune-system activity is one of the variables involved in its pathogenesis. On the other hand, many studies have demonstrated that activity of the immune system leads to the expression of neurotrophic factors. Therefore, mere suppression of the immune system can interrupt regeneration and repair.Citation10,Citation11
Some studies have shown that impaired homeostasis of iron, mitochondrial dysfunction, oxidative stress (OS) in the central nervous system, increase in intracellular free calcium, and death of oligodendrocytes have an important role in MS pathogenesis.Citation12–Citation14 Therefore, it is necessary to design and construct multifunctional medications that can target multiple aspects of the disease pathogenesis and affect the pathological events in a smart and balanced manner. For example, iron plays a key role in hematopoiesis and many other biochemical processes essential for normal brain function.Citation15,Citation16 Therefore, despite the available evidence verifying the role of disturbance in iron metabolism in MS pathogenesis,Citation17–Citation19 mere indiscriminate chelation or removal of this element cannot prompt a critical event, such as remedy, in patients.Citation20 It is rather proper iron redistribution that is required in this complicated situation.Citation21
In recent years, the use of nanotechnology has been well established both in pharmaceutical research and clinical settings. The properties of matter differ immensely on the nanoscale, leading to a smarter reaction toward in vivo chemical and physical changes.Citation22,Citation23 In the current study, we evaluated the effects of MSc1 nanocomplex on experimental autoimmune encephalomyelitic (EAE) mice for the first time. This nanocomplex was designed based on modern nanochelating technology with a dominant affinity for iron.
Available reports imply that OS has an important role in the pathogenesis of MS and EAE.Citation24 Therefore, the possible factors for treating the disease must have the capacity to inhibit the deleterious mechanisms prompted by OS.Citation25 One of the common models for mimicking OS in vitro involves using H2O2 and the pheochromocytoma (PC)-12 cell line.Citation26 Therefore, we used this common cellular model for evaluating the effect of MSc1 on preventing OS-associated neuronal death. To investigate the effect of iron binding on the antioxidative behavior of the nanocomplex, a structure was designed in which iron was bound to MSc1. Henceforward, in this paper, the nanocomplex bound to iron will be expressed as MSc1-Fe.
Materials and methods
Materials and instrumentation
MSc1 was synthesized by Sodour Ahrar Shargh company (Tehran, Iran). Hydrogen peroxide (H2O2), sodium isothiocyanate, dimethyl sulfoxide, FeCl3, nitric acid, acetone, methanol, and formalin were purchased from Merck (Darmstadt, Germany). Dulbecco’s Modified Eagle’s Medium (DMEM), Roswell Park Memorial Institute (RPMI) medium, fetal bovine serum (FBS), penicillin G and streptomycin (pen/strep; 100 μg/mL), and 0.25% trypsin–ethylenediaminetetraacetic acid (EDTA) were purchased from Thermo Fisher Scientific (Waltham, MA, USA). Hematoxylin and eosin (H&E), Luxol fast blue (LFB), 3-(4,5-dimethylthiazol-2-yl)-2,5-diphenyltetrazolium bromide 99% (MTT), and Freund’s adjuvant were acquired from Sigma-Aldrich (St Louis, MO, USA). Bordetella pertussis toxin, encephalitogenic peptide MOG35-55, and Mycobacterium tuberculosis were purchased from Enzo Life Sciences (Farmingdale, NY, USA).
Equipment and instruments used were as follows: electrical conductance meter and pH meter (BEM802; Milwaukee Instruments, Rocky Mount, NC, USA), rheometer (Brookfield Engineering Laboratories, Middleboro, MA, USA), atomic absorption spectrometer (2100; PerkinElmer, Waltham, MA, USA), transmission electron microscope (CM-200 FEG; Philips, Amsterdam, the Netherlands), Spectrum Two™ infrared (IR) spectrometers (L160000A; PerkinElmer), absorbance microplate readers (ELx800™; BioTek, Winooski, VT, USA), automated blood analyzer (XS-800i; Sysmex Corporation, Kobe, Japan), and light microscope (Axio Scope.A1; Carl Zeiss Meditec, Jena, Germany).
Cell culture
Rat neuronal cells (PC12) were purchased from the National Cell Bank of the Pasteur Institute (Tehran, Iran). PC12 cells were cultured in DMEM supplemented with 10% FBS and pen/strep. Cells were cultured under a humidified atmosphere of 95% air with 5% CO2 at 37°C in 25 cm2 culture flasks. When cells reached 80% confluence, they were detached and replated using 0.25% trypsin–EDTA.
Animals
Six-week-old male C57/BL6 mice were obtained from the Pasteur Institute of Iran (Karaj, Iran). All the animal studies were conducted according to the relevant national and international guidelines of Tehran University of Medical Sciences. All the inbred male C57/BL6 mice were maintained in large group houses under 12-hour dark/light cycles with proper access to food and water.
Synthesis and characterization of MSc1 and MSc1-Fe
MSc1 was designed and synthesized by Sodour Ahrar Shargh company using nanochelating technology.Citation27,Citation28 Ten milligrams of a dry organic chelating agent was dissolved in distilled water at 70°C. The chelating agent solution was kept at 70°C for 5 hours or until the solution became clear. Two nitrogen source powders were mixed with the chelating agent solution at ratios of 1:2:10. This procedure was carried out without cosolvent, only in water solution, and with NH4OH as the final reagent. The reaction was continued for about 3 hours, and the temperature increased to 80°C for 10 hours or until the solution dried into the form of a powder. Finally, all samples were sintered at 800°C for 4 hours and then ground to powder.
For MSc1-Fe synthesis, 1 mg of MSc1 was dissolved in distilled water at 40°C for 10 minutes. Then, 7 mg of FeSO4 was added to the solution and mixed until a clear solution was obtained. This solution was dried at 80°C to produce MSc1-Fe powder.
Normal pH of MSc1
The normal pH of MSc1was assessed via a pH meter with glass electrodes, based on the potential difference of an electrochemical cell. For this purpose, MSc1 was dissolved in deionized water to a final concentration of 1 mg/mL, and then its pH was examined at 25°C.
Electrical conductance
MSc1 electrical conductance (EC) was evaluated by an EC meter at a constant temperature of 25°C in a 1 mg/100 mL MSc1 solution. Deionized water with electrical conductivity of less than 0.1 μS/cm was used as the criterion according to the standards (International Organization for Standardization 3696).
MSc1 density
MSc1 density was evaluated in the standard conditions by a pycnometer.
High-resolution transmission electron microscopy
MSc1 high-resolution transmission electron microscopy (HRTEM) images were captured by a transmission electron microscope in the University of Tehran Science and Technology Park.
Infrared spectroscopy
MSc1 functional groups were characterized by IR spectroscopy in the 400–4,000 cm−1 range at the Shahid Beheshti University.
Evaluation of MSc1 toxicity
Standard tests were carried out for assessing the median lethal dose (LD50) according to guideline 420 of the Organization for Economic Co-operation and Development in the School of Pharmacy at Tehran University of Medical Sciences.
Analyzing the chelating characteristics of MSc1
To verify the chelating quality of MSc1, complex metric titration was performed and sodium isothiocyanate was used as the indicator for color change and spectrometry. An adequate amount of FeCl3 was dissolved in distilled water to reach a final concentration of 1 mg/mL, and this was used to obtain the absorption spectrum at wavelengths of 400–600 nm. Afterwards, different concentrations of MSc1 were added to this solution, and the decrease in the absorption spectrum, which indicated iron chelation by MSc1, was evaluated.
Analyzing the ability of MSc1 to maintain an iron bond at different pH ranges
A solution that contained a given concentration of MSc1 and FeSO4 was prepared and mixed until no deposition could be observed. Subsequently, acid or alkaline was added to the sample to prepare acidic or alkaline pH ranges 1–7, and the absorbance of the solution was measured at wavelengths of 248.33 nm by atomic absorption spectroscopy.
Measuring cell-protection capacity against H2O2-induced oxidative injury
In the experimental studies, H2O2 was used for simulating OS-induced cell death.Citation29 Rat PC12 cells were plated at a density of 1×10⁴ cells/well in 96-well plates in 100 μL RPMI. The cells were treated with several concentrations of MSc1 (0.012 mM, 0.024 mM, 0.12 mM, 0.24 mM, 1.2 mM, and 2.4 mM) for 24 hours, and were then incubated with 300 μM of H2O2 for 24 hours as test groups. For the controls, PC12 cells were cultured without treatment with MSc1 or H2O2 (as negative control) or were treated simply with H2O2 for 24 hours (as positive control).
The effect of MSc1 on the viability of the cells was measured with conventional MTT reduction assay. The cells were incubated with a final concentration of 0.25 mg MTT/mL for 2 hours at 37°C, then dimethyl sulfoxide was added to stop the reaction. Finally, the formazan dye crystals were solubilized for 15 minutes, and the absorbance was measured using a microplate reader at a test wavelength of 570 nm and reference wavelength of 630 nm. For evaluating the effect of iron binding on MSc1 antioxidative behavior, these tests were repeated using MSc1-Fe.
EAE induction in C57/BL6 mice
C57/BL6 mice were inoculated subcutaneously in the flank with 0.1 mL of an emulsion containing 200 μg of the MOG35-55 and an equal volume of complete Freund’s adjuvant supplemented with 4 mg/mL Mycobacterium tuberculosis. Mice were injected intraperitoneally with 400 ng of pertussis toxin on the day of immunization and 2 days after.
Treatment of EAE mice with MSc1
On day 14, once the clinical manifestations of EAE appeared, the mice with EAE were randomly divided into four groups forming the control, low-dose (100 μg/kg), medium-dose (400 μg/kg), and high-dose groups (1,000 μg/kg), each consisting of six mice. In order to compare weight, hematological parameters, and hepatic iron levels properly, another group consisting of six healthy 6-week-old mice was monitored along with those four groups until the end of the study.
MSc1 was dissolved in distilled water and intraperitoneally injected once a day until day 54 after disease induction. The mice in the control group were injected daily with distilled water. Clinical scores of the mice were observed daily from day 14 to 54 after disease induction. The scoring scale is presented in . During this time, body mass was also measured frequently.
Table 1 Clinical scoring of mice
Hepatic iron levels
Hepatic iron levels were determined by atomic absorption spectrometry with a deuterium background correction using acetylene-air flame atomization. Measurements were performed with an analytical line of 248.3 nm in a spectral interval of 0.2 nm. Iron concentration was ascertained by the standard addition method. Sample digestion was accomplished in an MDS-2000 microwave sample-preparation system (CEM, Matthews, NC, USA) in Teflon cartridges using a mixture of nitric acid (5 mL) and H2O2 (2 mL) for 20 minutes at 120 psi pressure. The resulting product was analyzed directly in Teflon cartridges.
Assessment of hematologic parameters
On the 54th day after disease induction, blood specimens were collected from orbital sinuses of the mice. All of the procedures were performed according to the approved protocols for animals. Red blood cell (RBC) count and hemoglobin (Hb) levels were measured for each sample with the Sysmex automated blood analyzer.
White blood cell differential count
Cells were fixed on glass slides with acetone-free methanol. Then, alkali or acidic dyes like eosin were used to react with the basic cellular section, such as Hb, and acidic cellular elements, such as nucleic acids. Afterward, 100 cells were counted with an optical microscope in different fields, and the types of hematologic cells were reported.
Histological analysis
The mice were killed 54 days after induction of EAE, and their brains were removed and fixed in 10% formalin. Paraffin-embedded sections (4 μM) were stained. H&E- and LFB-stained sections were finally examined with the Zeiss microscope, and images were captured using Spot Insight (Diagnostic Instruments, Sterling Heights, MI, USA).
Statistical analysis
Maximum clinical scores were analyzed using the Mann–Whitney U-test, while other clinical parameters were analyzed using the Student’s t-test.
Results
Characterization of MSc1
The results showed that MSc1 PH, EC, and density were 8.7, 8.09 μS/cm and 0.4 g/cm3 respectively.
MSc1 size
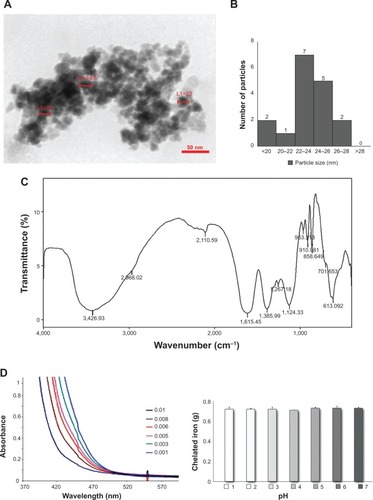
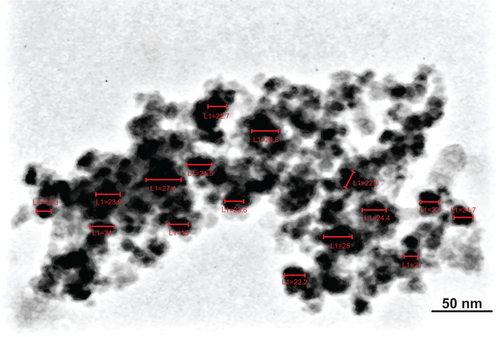
Imaging and analytical characterization of nanoparticles by HRTEM is commonly performed to determine their size. The images of MSc1 indicated that the size of the nanocomplex was about 23–25 nm ().
Figure 1 MSc1 HRTEM image (A); nanoparticle size–distribution histogram of MSc1 (B); IR spectrum (C) and complexometric titration (D); MSc1 iron preservation at pH 1–7 (E).
Abbreviations: HRTEM, high-resolution transmission electron microscopy; IR, infrared; L, length.
MSc1 hydrocarbonic structure
IR-spectrum analysis clearly demonstrated that the MSc1 nanocomplex was an organic hydrocarbonic structure that possesses C=O (representing chelating capacity), OH, and NH groups ().
MSc1 LD50
The MSc1 toxicity report indicated that the intraperitoneal LD50 of this nanocomplex for mice was 1,776.59 mg/kg. Therefore, this nanocomplex was classified as nontoxic ().
Table 2 MSc1-toxicity report
MSc1 chelating property
Our results showed that elevated concentrations of MSc1 co-occurred with a decrease in the iron-absorption spectrum, which was an indicator of iron chelation. The spectrum demonstrated that more iron was chelated at higher concentrations of MSc1 ().
Maintaining iron bond at pH ranges 1–7
The results indicated that at pH ranges 1–7, MSc1 constantly preserved its bond to iron ().
MSc1 and MSc1-Fe cell protection against H2O2-induced oxidative injury
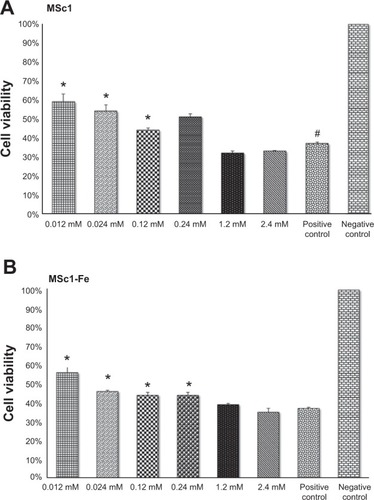
Cell viability was assessed in PC12 cells pretreated with MSc1 or MSc1-Fe that were exposed to H2O2 for 24 hours. The results demonstrated that cell viability increased, up to 20% at the optimum dose (0.012 mM), among all the cells treated with MSc1 in comparison to the positive control (; n=3). Likewise, when comparing the positive control with MSc1-Fe-treated cells, an increase in cell viability was observed in the 0.012 mM, 0.024 mM, 0.12 mM, and 0.24 mM MSc1-Fe-treated cells, among which the first was the optimum dose (). The results showed that except for the concentrations of 1.2 (MSc1-Fe was better than MSc1), 0.24, and 0.024 mM (MSc1 was better than MSc1-Fe), no significant difference was observed in the viability of the cells treated either with MSc1 or MSc1-Fe at other concentrations ().
Figure 2 PC12 cell protection from H2O2-induced oxidative toxicity by MSc1 (A) and MSc1-Fe (B).
Notes: *P<0.05; #significant difference was determined by comparison to this group.
Abbreviation: PC, pheochromocytoma.
Measuring clinical scores in the animals
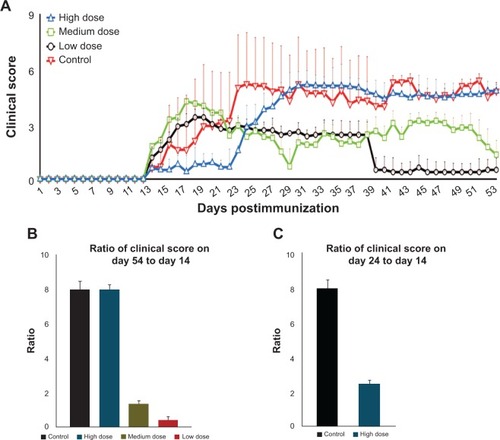
Clinical scores were evaluated in all four groups of the EAE mice. In the control group, clinical scores increased from day 14 after EAE induction and reached their maximum on day 24 (). The low and medium doses of MSc1 were effective in limiting disease progression (). On day 54, the mean clinical score had decreased to 0.5- and 1.35-fold in the low- and medium-dose groups, respectively (), while it had increased eightfold in the control group. In addition, a significant difference was noticed in the clinical scores of the MSc1-treated and control groups on most days. It is noteworthy that the clinical score had increased eightfold in the control group by 54 days after EAE induction, while it merely increased 2.5-fold in the high-dose group (). At the end of the experiment, the mean clinical scores were 4.8, 0.5, 1.33, and 4.8, respectively, for the control, low-, medium-, and high-dose groups (; n=6).
Figure 3 Clinical scores of mice during 54 days after EAE induction (A); ratio of clinical score increase on day 54 in relation to day 14 in the control and test groups (B); ratio of clinical score increase on day 24 in relation to day 14 in the control and high-dose groups (C).
Notes: The clinical score from each group at the end of the experiment (day 54) was divided over the clinical score from each group at the beginning of the treatment (day 14) to demonstrate the efficacy of the nanocomplex in controlling EAE progression by using mathematical logic (B); the clinical score on day 24 (when the clinical score was the highest in the control group) was divided over the clinical score on day 14 (the beginning of the treatment) to mathematically indicate the success of high-dose MSc1 in deferring disease progression (C).
Abbreviation: EAE, experimental autoimmune encephalomyelitis.
Survival probability of the EAE mice
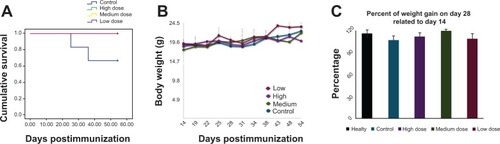
Among the control group, EAE caused the first death on day 25 and the second death on day 36. However, EAE did not induce any deaths among the MSc1-treated groups until the last day of the monitoring period. According to the cumulative survival graph, the survival probability in the control group was 66.7%, while it was 100% in the MSc1-treated groups ().
Figure 4 Effect of MSc1 on survival probability (A), the body weight of the mice (B) and percent of weight gain (C).
Notes: Mass changes are presented in this graph during days 14–54 (A); percentage of mass increase on days 28–14 postimmunization is shown (C). The medium dose had the best effect.
Effect of MSc1 on the body weight of the EAE mice
The body weights of the EAE mice were measured and compared from day 14 after immunization. Maintaining body mass could be a sign of health restoration in the treated EAE mice. It is worth mentioning that during the peak of the symptoms and clinical score, the body mass in the MSc1-treated groups was preserved or even increased. For instance, on day 28 post-EAE induction, the body weight in the control, healthy-, low-, medium-, and high-dose groups increased was 7%, 16%, 9%, 20%, and 12% compared to day 14, respectively, indicating the highest increase in body mass was observed among the mice treated with the medium dose of MSc1 ().
Hematologic parameters
With regard to the chelating nature of MSc1, a lack of iron-deficiency anemia among the MSc1-treated mice was critical. There was no significant difference in Hb level between the control, healthy-, medium-, and high-dose groups. However, it is notable that a significant rise of Hb was observed in the low-dose group compared against the control and healthy groups (n=6). The average values for RBC count with no significant difference in the healthy, control, low-, medium-, and high-dose groups were 10.13×10⁸ cells/μL, 10×108/μL, 10×108/μL, 10×108/μL and 9.77×10⁸/μL, respectively ().
Figure 5 Average RBC counts (A); average Hb concentrations (B); average hepatic iron levels (C).
Note: *P<0.05.
Abbreviations: RBC, red blood cell; Hb, hemoglobin; PBS, phosphate-buffered saline; M, million.
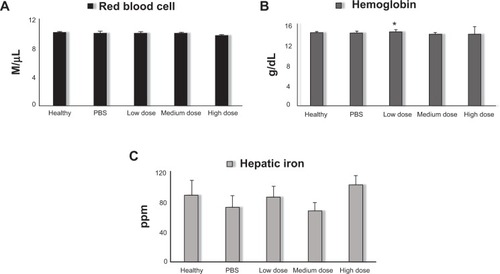
Hepatic iron levels
Average hepatic iron levels were measured in each group at the end of the experiment. In the high-dose group, the hepatic iron level was significantly higher than the control and healthy groups, which demonstrated iron accumulation in the liver. In the medium-dose group, hepatic iron levels were lower than in the healthy mice but not significantly different from the control group. In the low-dose group, hepatic iron levels were significantly greater than the control group and equal to those in healthy mice (; n=6).
White blood cell differential count
The results of white blood cell differential counts showed 88%, 38%, and 87% lymphocytes and 11%, 60%, and 2% segmented cells in each microscopic field, respectively, in the healthy, control, and medium-dose groups. Comparison of cell differential counts in the healthy and treated groups indicated that there was no significant difference between the percentage of lymphocytes and segmented cells in the treated groups and healthy mice ().
Table 3 White blood cell (WBC) differential count results
Histological report
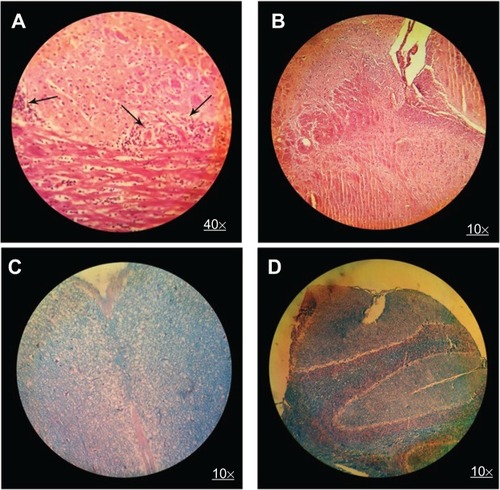
The brains of the mice were removed for histopathologic evaluation after 54 days of disease induction. In H&E staining, lymphocytic infiltration was clearly present among the control-group mice (), while it was not detectable in the MSc1-treated groups (). Moreover, leptomeningeal congestion and molecular and cytoplasmic shrinkage of neurons in the cerebellar and cerebral cortex (designating convulsion, ischemia, and oxygen deficiency in general) were observed in the control group. Periventricular edema in the white matter and a few scattering lymphocytes were also noticed. In addition, due to loss of myelin, some paleness and spongy tissue was perceived in the background (). In the high-dose group, a plaque area showing remnants of demyelinated tissue was observed in one sample, but the others showed no changes in white matter, nor did mice in the low- and medium-dose groups ().
Figure 6 H&E brain staining in control group (A) and MSc1-treated mice (B); LFB staining in control group (C) and MSc1-treated mice (D).
Notes: Infiltration of lymphocytes (A) and demyelination (C) in the control mice; no lymphocyte infiltration (B) or demyelination (D) in the MSc1-treated mice. Arrows show lymphocyte infiltration.
Abbreviation: H&E, hematoxylin and eosin; LFB, Luxol fast blue.
Discussion
Employing modern nanochelating technology, we synthesized MSc1 nanocomplex based on a self-assembly method. It is noteworthy that in this study, we did not use pretreatment or even cotreatment in the first evaluation of MSc1 in animals with EAE.Citation30,Citation31 Our purpose was to design a therapeutic study, beginning our therapy 14 days after disease induction, when paralysis symptoms were observed among the samples. The graph of clinical scores of the animal models showed that on the peak day of EAE, which is usually between 20 and 30 days after disease induction, MSc1 had efficiently slowed the progression of the disease in comparison to the control group and reduced the clinical score in favor of curing the diseased mice in a dose-dependent manner. Some of the studies on EAE models have used the therapeutic method. In recent years, numerous studies have demonstrated potent neuroprotective, antioxidative, and immunomodulatory properties of epigallocatechin gallate (EGCG), a certain fraction of green tea that is an iron chelator.Citation32–Citation34 Treatment of EAE mice with EGCG has had beneficial effects in suppression of the induced disease.Citation35 Despite the advantages of EGCG verified in various experiments, the structure of this flavonoid has deficiencies. Several studies have shown that EGCG could merely be active in a narrow range of pH and otherwise degraded.Citation36,Citation37 It is also remarkable that after binding with iron, EGCG acts as a pro-oxidant and would be deleterious.Citation38
The present study indicated that MSc1 maintained iron bond at pH ranges 1–7. Binding with iron had no negative effects on the nanocomplex cell-protection capacity against H2O2-induced cell toxicity. These two characteristics are truly important, because while pH decreases in the inflamed regions, the iron bond with proteins becomes loose.Citation39,Citation40 A weak bond would lead to release and entrance of iron into cascades of pathological reactions, producing more OS and more inflammation, forming a vicious cycle: more inflammation, more OS, weaker iron bonds.Citation39,Citation41,Citation42
Lactoferrin is a natural iron chelator with antioxidative properties, and its anti-EAE characteristics have also been verified.Citation43 Mazurier and Spik showed that lactoferrin could maintain iron bond at pH 3.Citation44 However, Shoji et al reported that lactoferrin capacity to protect against H2O2 cell toxicity decreases after binding with iron.Citation45
The MSc1 reactions to pH changes and oxidative conditions (after binding with iron), along with its nanoscale size (), supports MSc1 as an efficient agent for proper iron redistribution in the body and for properly breaking down the vicious cycle of inflammation and OS. MSc1 did not cause any loss of hepatic iron supplies. Moreover, in MSc1-treated groups, hematological indices, such as RBC count and Hb levels, were normal, and even a slight growth in Hb parameters were observed in the low-dose group compared to healthy mice. These results (normal Hb, RBC count, and liver iron content in nanocomplex-treated groups after 54 days of MSc1 injection), along with the chelating property of MSc1 and more importantly improvement of EAE mice in test groups, implies the iron-redistribution potency of MSc1. Moreover, its high LD50 showed this complex to be a nontoxic compound.
Body-weight loss is a typical symptom in EAE mice, especially during the acute phase.Citation46–Citation48 The significant point in the present study was the higher percentage of weight gain with the medium dose of MSc1 during the acute phase of disease compared to the control groups.
The white blood cell differential count showed the percentages of lymphocytes and segmented cells in the treated groups were similar to that of healthy mice. Wu et al demonstrated that neutrophils are one of the major inflammatory cells to initiate EAE and contribute to the pathogenesis of EAE.Citation49 In another study, Carlson et al reported that depletion of circulating polymorphonuclear leukocytes had therapeutic effects on EAE mice.Citation50 Therefore, a decrease in segmental cells along with the absence of demyelination or lymphocyte infiltration in MSc1-treated groups suggested the therapeutic effects of this nanocomplex.
Conclusion
A general overview of the obtained results is as follows:
Although treatment with MSc1 began after observing paralysis symptoms, the clinical score decreased in the test groups.
Demyelination was not seen in the brain sections of the MSc1-treated animals, while neurons in the same area were demyelinated or dead in the control groups.
White blood cell differential count results were similar between the MSc1-treated and healthy groups.
Anemia or reduction of hepatic iron levels was not noticed in the MSc1-treated mice.
MSc1 maintained its cell-protection properties against H2O2 toxicity, even when bound to iron.
MSc1 preserved iron bound at pH ranges 1–7.
MSc1 increased body mass compared to the control group.
In summary, these results indicate that MSc1 is a novel agent that needs to be further assessed for safety and efficacy in the context of clinical trials for MS.
Acknowledgments
All financial support was provided by the Department of Research and Development at the Sodour Ahrar Shargh Company. We are grateful to Etrat S Moghimi, Sara Mobini, Toeh Saleh and Fakhrosadat Nasiri for their help in this project.
Supplementary materials
Figure S1 Brightfield microscopy images from PC12 negative control (A), positive control (B), and MSc1-treated cells (C).
Notes: Negative control cells are PC12 with no treatment (A), positive control cells treated for 24 hours by 300 μM of H2O2 (B), cells pretreated for 24 hours by MSc1 then treated by 300 μM of H2O2 (C).
Abbreviation: PC, pheochromocytoma.
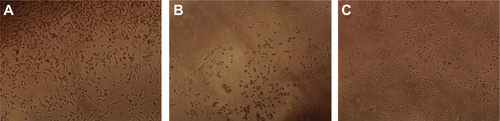
Figure S2 Determination of clinical score of EAE mice.
Notes: Healthy =0 (A); tail paralysis =2 (B); tail paralysis and paralysis of one hind-limb (C); tail paralysis and total hind-limb paralysis (D); tail, hind-limb, and forelimb paralysis (E). Arrows show the disabled limbs.
Abbreviation: EAE, experimental autoimmune encephalomyelitis.
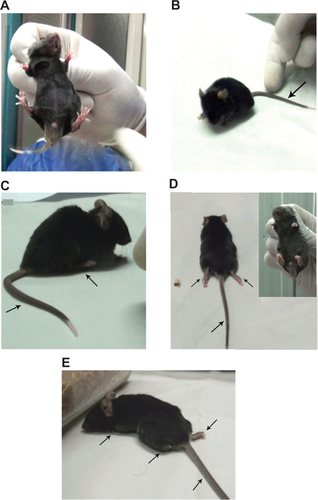
Figure S3 Scaling of transmission electron microscopy image of MSc1 for nanoparticle size–distribution histogram.
Abbreviation: L, length.
Disclosure
This paper was presented as a poster at the 29th European Committee for Treatment and Research in Multiple Sclerosis (ECTREMS), held October 2–5, 2013 in Copenhagen, Denmark. MH Nazaran is the owner of Nanochelating Technology and executive manager and chairman of the management board of Sodour Ahrar Shargh company, Tehran, Iran. The other authors report no conflicts of interest in this work.
References
- GrigoriadisNInterferon beta treatment in relapsing-remitting multiple sclerosis. A reviewClin Neurol Neurosurg2002104325125812127664
- McDonaghMDrug Class Review: Disease-Modifying Drugs for Multiple Sclerosis: Single Drug Addendum: FingolimodPortlandOregon Health & Science University2011
- HartungHPNew cases of progressive multifocal leukoencephalopathy after treatment with natalizumabLancet Neurol200981283119081511
- MullenJTVartanianTKAtkinsMBMelanoma complicating treatment with natalizumab for multiple sclerosisN Engl J Med2008358664764818256405
- LindseyJWHaden-PinneriKMemonNBBujaLMSudden unexpected death on fingolimodMult Scler201218101507150822300970
- BernardCCKerlero de RosboNMultiple sclerosis: an autoimmune disease of multifactorial etiologyCurr Opin Immunol1992467607651281641
- MurrayTJThe history of multiple sclerosis: the changing frame of the disease over the centuriesJ Neurol Sci2009277Suppl 1S3S819200863
- ZettlUKStuveOPatejdlRImmune-mediated CNS diseases: a review on nosological classification and clinical featuresAutoimmun Rev201211316717321619943
- Muñoz-CullaMIrizarHOtaeguiDThe genetics of multiple sclerosis: review of current and emerging candidatesAppl Clin Genet20136637324019748
- GraberJJDhib-JalbutSProtective autoimmunity in the nervous systemPharmacol Ther2009121214715919000712
- MartinoGFurlanRBrambillaECytokines and immunity in multiple sclerosis: the dual signal hypothesisJ Neuroimmunol200010913910969174
- HametnerSWimmerIHaiderLPfeifenbringSBrückWLassmannHIron and neurodegeneration in the multiple sclerosis brainAnn Neurol201374684886123868451
- SuKBourdetteDForteMMitochondrial dysfunction and neurodegeneration in multiple sclerosisFront Physiol2013416923898299
- ZundorfGReiserGCalcium dysregulation and homeostasis of neural calcium in the molecular mechanisms of neurodegenerative diseases provide multiple targets for neuroprotectionAntioxid Redox Signal20111471275128820615073
- CrichtonRRDexterDTWardRJBrain iron metabolism and its perturbation in neurological diseasesJ Neural Transm2011118330131420809066
- TodorichBPasquiniJMGarciaCIPaezPMConnorJROligodendrocytes and myelination: the role of ironGlia200957546747818837051
- ForgeJKPedchenkoTVLeVineSMIron deposits in the central nervous system of SJL mice with experimental allergic encephalomyelitisLife Sci19986325227122849870713
- AdamsCWPerivascular iron deposition and other vascular damage in multiple sclerosisJ Neurol Neurosurg Psychiatry19885122602653346691
- RussoCSmokerWRKubalWCortical and subcortical T2 shortening in multiple sclerosisAJNR Am J Neuroradiol19971811241269010530
- HegdeMLBharathiPSuramAChallenges associated with metal chelation therapy in Alzheimer’s diseaseJ Alzheimers Dis200917345746819363258
- WeinbergEDTherapeutic potential of iron chelators in diseases associated with iron mismanagementJ Pharm Pharmacol200658557558416640825
- YoshidaMLahannJSmart nanomaterialsACS Nano2008261101110719206325
- XiongYRenCZhangBAnalyzing the behavior of a porous nano-hydroxyapatite/polyamide 66 (n-HA/PA66) composite for healing of bone defectsInt J Nanomedicine2014948549424531621
- SajadMZarganJChawlaRUmarSSadaqatMKhanHAHippocampal neurodegeneration in experimental autoimmune encephalomyelitis (EAE): potential role of inflammation activated myeloperoxidaseMol Cell Biochem20093281–218318819301098
- MirshafieyAMohsenzadeganMAntioxidant therapy in multiple sclerosisImmunopharmacol Immunotoxicol2009311132918763202
- WuFJXueYLiuXFThe protective effect of eicosapentaenoic acid-enriched phospholipids from sea cucumber Cucumaria frondosa on oxidative stress in PC12 cells and SAMP8 miceNeurochem Int20146491724231470
- NazaranMHinventorChelate compounds United States patent US 8288587 B210162012
- NazaranMHinventorChelate compounds Patent EP2444096 A14252012
- SiCLShenTJiangYYAntioxidant properties and neuroprotective effects of isocampneoside II on hydrogen peroxide-induced oxidative injury in PC12 cellsFood Chem Toxicol20135914515223770344
- YuanBZhaoLFuFA novel nanoparticle containing MOG peptide with BTLA induces T cell tolerance and prevents multiple sclerosisMol Immunol2014572939924084097
- ZhuBTrikudanathanSZozulyaALImmune modulation by lacto-N-fucopentaose III in experimental autoimmune encephalomyelitisClin Immunol2012142335136122264636
- MandelSAmitTBar-AmOYoudimMBIron dysregulation in Alzheimer’s disease: multimodal brain permeable iron chelating drugs possessing neuroprotective-neurorescue and amyloid precursor protein-processing regulatory activities as therapeutic agentsProg Neurobiol200782634836017659826
- RennoWMAl-MaghrebiMAlshammariAGeorgeP(-)-Epigallocatechin-3-gallate (EGCG) attenuates peripheral nerve degeneration in rat sciatic nerve crush injuryNeurochem Int201362322123123313191
- SilvaKCRosalesMAHamassakiDEGreen tea is neuroprotective in diabetic retinopathyInvest Ophthalmol Vis Sci20135421325133623299475
- AktasOProzorovskiTSmorodchenkoAGreen tea epigallocatechin-3-gallate mediates T cellular NF-kappa B inhibition and exerts neuroprotection in autoimmune encephalomyelitisJ Immunol200417395794580015494532
- ProniukSLiedererBMBlanchardJPreformulation study of epigallocatechin gallate a promising antioxidant for topical skin cancer preventionJ Pharm Sci200291111111611782902
- HirunSRoachPDA study of stability of (-)-epigallocatechin gallate (EGCG) from green tea in a frozen productInt Food Res J201118412611264
- HagermanAEDeanRTDaviesMJRadical chemistry of epigallocatechin gallate and its relevance to protein damageArch Biochem Biophys2003414111512012745262
- LambDJLeakeDSIron released from transferrin at acidic pH can catalyse the oxidation of low density lipoproteinFEBS Lett1994352115187925932
- SteenKHSteenAEReehPWA dominant role of acid pH in inflammatory excitation and sensitization of nociceptors in rat skin in vitroJ Neurosci1995155 Pt 2398239897751959
- YamajiYNakazatoYOshimaNHayashiMSarutaTOxidative stress induced by iron released from transferrin in low pH peritoneal dialysis solutionNephrol Dial Transplant200419102592259715292463
- YuHCFengSFChaoPLLinAMAnti-inflammatory effects of pioglitazone on iron-induced oxidative injury in the nigrostriatal dopaminergic systemNeuropathol Appl Neurobiol201036761262220626630
- ZimeckiMKociebaMChodaczekGHouszkaMKruzelMLLactoferrin ameliorates symptoms of experimental encephalomyelitis in Lewis ratsJ Neuroimmunol20071821–216016617113653
- MazurierJSpikGComparative study of the iron-binding properties of human transferrins. I. Complete and sequential iron saturation and desaturation of the lactotransferrinBiochim Biophys Acta198062923994086770907
- ShojiHOguchiSShinoharaKShimizuTYamashiroYEffects of iron-unsaturated human lactoferrin on hydrogen peroxide-induced oxidative damage in intestinal epithelial cellsPediatr Res2007611899217211147
- TalerMGil-AdIKorobIWeizmanAThe immunomodulatory effect of the antidepressant sertraline in an experimental autoimmune encephalomyelitis mouse model of multiple sclerosisNeuroimmunomodulation201118211712221088435
- QuinnKGalbraithSESheahanBJAtkinsGJEffect of intranasal administration of Semliki Forest virus recombinant particles expressing interferon-β on the progression of experimental autoimmune encephalomyelitisMol Med Rep20081333534221479414
- SegerJZorzella-PezaventoSFPelizonACMartinsDRDominguesASartoriADecreased production of TNF-alpha by lymph node cells indicates experimental autoimmune encephalomyelitis remission in Lewis ratsMem Inst Oswaldo Cruz2010105326326820512238
- WuFCaoWYangYLiuAExtensive infiltration of neutrophils in the acute phase of experimental autoimmune encephalomyelitis in C57BL/6 miceHistochem Cell Biol2010133331332220063008
- CarlsonTKroenkeMRaoPLaneTESegalBThe Th17-ELR+ CXC chemokine pathway is essential for the development of central nervous system autoimmune diseaseJ Exp Med2008205481182318347102