
 ?Mathematical formulae have been encoded as MathML and are displayed in this HTML version using MathJax in order to improve their display. Uncheck the box to turn MathJax off. This feature requires Javascript. Click on a formula to zoom.
Abstract
The aims of this study were to investigate the most effective combination of physical forces from laser, electroporation, and reverse iontophoresis for noninvasive transdermal extraction of uric acid, and to develop a highly sensitive uric acid biosensor (UAB) for quantifying the uric acid extracted. It is believed that the combination of these physical forces has additional benefits for extraction of molecules other than uric acid from human skin. A diffusion cell with porcine skin was used to investigate the most effective combination of these physical forces. UABs coated with ZnO2 nanoparticles and constructed in an array configuration were developed in this study. The results showed that a combination of laser (0.7 W), electroporation (100 V/cm2), and reverse iontophoresis (0.5 mA/cm2) was the most effective and significantly enhanced transdermal extraction of uric acid. A custom-designed UAB coated with ZnO2 nanoparticles and constructed in a 1×3 array configuration (UAB-1×3-ZnO2) demonstrated enough sensitivity (9.4 μA/mM) for quantifying uric acid extracted by the combined physical forces of laser, electroporation, and RI. A good linear relationship (R2=0.894) was demonstrated to exist between the concentration of uric acid (0.2–0.8 mM) inside the diffusion cell and the current response of the UAB-1×3-ZnO2. In conclusion, a new approach to noninvasive transdermal extraction and quantification of uric acid has been established.
Introduction
Gout is a common form of arthritisCitation1 with many sufferers, comprising about 3 million people in the USACitation2 and 0.7 million in the UK.Citation3 Moreover, gout accounts for 4 million outpatient visits each year,Citation4 resulting in a considerable economic burden.Citation5 Recent research shows a link between gout or high blood uric acid levels and increased risk of cardiovascular morbidity and mortality.Citation6 Therefore, frequent monitoring of blood uric acid levels is of great importance.
Blood sampling is a routine clinical approach to determining blood uric acid levels. However, it suffers the drawback of being invasive, painful, and inconvenient. To offer patients a noninvasive alternative, physical forces such as laser,Citation7,Citation8 reverse iontophoresis (RI),Citation9–Citation14 and electroporationCitation13–Citation15 have been investigated both independently and in combination for their ability to extract metabolites noninvasively and transdermally.
Laser perforation is a technique whereby micropores are created in the skin by pulsed laser to promote transport of molecules.Citation7,Citation8 RI refers to the technique of passing a small current through a section of skin to promote transport of both charged and neutral molecules.Citation16 Electroporation refers to the process of creating transient micropores across cell membranes by injecting a brief high voltage pulse to permit movement of exogenous molecules.Citation17 Several papers have reported the use of combined physical forces to enhance transdermal extraction of metabolites.Citation13,Citation14,Citation18,Citation19 To the best of our knowledge, no research has been reported on the use of combined physical forces from laser, RI, and electroporation to extract uric acid noninvasively and transdermally. Therefore, laser, electroporation, and RI were used in this study to evaluate the effectiveness of these physical forces with regard to noninvasive transdermal extraction of uric acid.
Uric acid extracted transdermally can generally be quantified using analytical tools such as a colorimeter or biosensor. Amongst the analytical tools available, a biosensor is the best choice for convenient quantification of uric acid at home. Due to the usually low concentration of uric acid that can be extracted transdermally, biosensors for this purpose should ideally have high sensitivity. Many researchers have focused on the use of nanoparticles,Citation20,Citation21 carbon nanotubes,Citation22,Citation23 electron-transfer mediators,Citation24,Citation25 bimetallic materials,Citation26,Citation27 bienzymes,Citation22,Citation23 and array configurationsCitation28 to enhance the sensitivity of biosensors. To the best of our knowledge, there have been no reports of the use of a combination of the above approaches to enhance biosensor sensitivity. Hence, this study investigates the use of integrated nanoparticles and an array configuration for improving the sensitivity of biosensors.
The aims of this study were to: (1) identify the most effective combination of physical forces (from laser, electroporation, and RI) for noninvasive transdermal extraction of uric acid; (2) develop a highly sensitive uric acid biosensor (UAB) for quantifying the uric acid extracted by physical forces; and (3) integrate the extraction method in (1) with the highly sensitive UAB in (2) for development of a system to determine blood uric acid levels by transdermal and noninvasive means.
Materials and methods
Reagents and solutions
All reagents were commercially available and used without further purification in this study. Uricase, uric acid, bovine serum albumin, glutaraldehyde, phosphate-buffered saline, and ZnO2 nanoparticles were purchased from Sigma Chemical Co (St Louis, MO, USA). A K608-100 uric acid assay kit was sourced from BioVision (Mountain View, CA, USA). Deionized water (resistivity ≥18 mΩ cm) purified by a Millipore system (Milli-Q UFplus; Bedford, MA, USA) was used to prepare all solutions. A Screen-print sensor (three electrode configuration, ie, graphite working and counter electrodes, and a silver–silver chloride reference electrode from Zensor R&D Co Ltd, Taichung, Taiwan).
Equipment
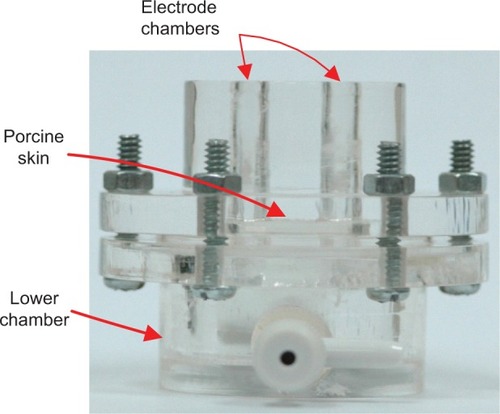
A previously described diffusion cell ()Citation13 was used for the in vitro uric acid extraction studies, with components including: programmable iontophoresisCitation29 and electroporation devicesCitation30 (developed by the authors to provide the necessary physical forces for electroporation and RI); a modified commercial laser generation device (1,550 nm laser modules, Tang Yue Ltd, Taiwan) to provide another essential physical force; a 680 microplate reader (Bio-Rad, Hemel Hempstead, UK) for all colorimetric analyses; and a CHI 627C electrochemical analyzer (CH Instruments, Austin, TX, USA) for all electrochemical evaluations.
Figure 1 Diffusion cell used for in vitro uric acid extraction studies.
In vitro uric acid extraction studies
All uric acid extraction experiments were conducted using diffusion cells, having two upper electrode chambers (300 μL each) and one lower chamber (25 mL), separated by 250 μm-thick porcine ear skin (obtained by dermatome) to simulate human skin. All chambers were filled with 0.1 M phosphate-buffered saline (pH 7.0), and the lower chamber contained additional 400 μM uric acid to simulate the normal interstitial fluid under human skin.
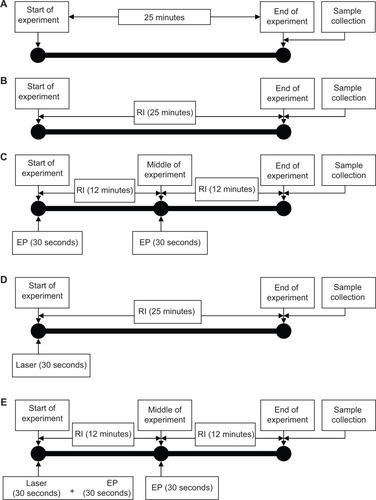
The experimental protocols are summarized in , in which three types of physical forces, ie, laser, electroporation, and RI, were investigated for their effect on transdermal extraction of uric acid. In the experiments requiring application of electroporation, a pair of platinum (Pt) electrodes was positioned in the electrode chambers and the required electroporation was delivered by the programmable electroporation device via the Pt electrodes. In the experiments requiring application of RI, a pair of silver–silver chloride (Ag/AgCl) electrodes was positioned in the electrode chambers and the required RI was delivered by the programmable iontophoresis device via the Ag/AgCl electrodes. Both the Pt and Ag/AgCl electrodes were positioned 1 mm above the porcine skin in their respective experiments. In experiments requiring application of laser, the porcine skin was treated by laser directly before the two electrode chambers were filled up with 0.1 M phosphate-buffered saline (pH 7.0).
Figure 2 The experimental protocols.
Notes: Each protocol allows 25 minutes of extraction time. For RI, symmetrical biphasic DC (phase duration 180 seconds; current density 0.5 mA/cm2) was used. For EP, high electric pulses (pulse width 1 msec; 20 pulses per second; polarity reversing every 5 seconds; application time 30 seconds; voltage 50 or 100 V/cm2) were used. For laser, a near-infrared laser (wavelength 1,500 nm; pulse width 10 msec; duty cycle 50%; application time 30 seconds; power 0.3 W or 0.7 W) was used. (A) control group (ie, no RI, EP, and laser used), (B) application of RI alone, (C) application of EP and RI, (D) application of laser and RI, and (E) application of laser, EP, and RI.
Abbreviations: EP, electroporation; RI, reverse iontophoresis; DC, direct current.
At the end of each extraction experiment, the entire contents of the electrode chambers were removed to determine the quantity of uric acid extracted by colorimetric assay, using the uric acid assay kit and Bio-Rad microplate reader.
Construction of UAB array incorporated with ZnO2 nanoparticles
A commercially available three-electrode sensor was used in this study. To immobilize the uricase enzyme on the sensor, a 4 μL mixture of glutaraldehyde 2.5% and ZnO2 nanoparticles (20% weight/weight [w/w]) was initially drop-coated onto the working electrode, and the sensor was then kept at 4°C in dark for one hour. Subsequently, 4 μL of uricase (0.5 U/mL) was drop-coated again onto the working electrode, immediately followed by drop-coating of 4 μL of bovine serum albumin (0.1 mM). Finally, the sensor was again kept at 4°C in the dark before use. The same procedure was used to construct UAB without ZnO2 nanoparticles but with 4 μL of glutaraldehyde 2.5% alone.
In this study, four configurations of UAB () were investigated in order to determine the sensitivity of biosensors with different configurations and nanoparticle coatings. The configurations were: single UAB (UAB-1×1, ), single UAB with ZnO2 nanoparticles (UAB-1×1-ZnO2, ), UAB with ZnO2 nanoparticles in a 1×2 array configuration (UAB-1×2-ZnO2) (), and UAB with ZnO2 nanoparticles in a 1×3 array configuration (UAB-1×3-ZnO2, ).
Figure 3 (A) A single UAB. UAB-1×1 denotes UAB without a ZnO2 nanoparticle coating, while UAB-1×1-ZnO2 denotes one with a ZnO2 nanoparticle coating. (B) A UAB in 1×2 array configuration. When the ZnO2 nanoparticle coating was deployed, it is abbreviated to UAB-1×2-ZnO2, and constructed by fixing two UAB-1×1-ZnO2 in parallel. (C) A UAB in 1×3 array configuration. With a ZnO2 nanoparticle coating on, it is abbreviated to UAB-1×3-ZnO2, and constructed by fixing three UAB-1×1-ZnO2 in parallel.
Note: Copyright © 2013, Elsevier B.V. Reproduced from Ching CTS, Chang KM, Hung YL, et al. An array configuration to increase the performance of a biosensor. Sens Actuators B Chem. 2013;178:465–472.Citation28
Abbreviation: UAB, uric acid biosensor.
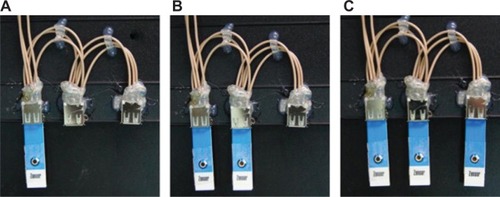
The procedures for UAB-1×1 and UAB-1×1-ZnO2 construction are the same. To construct UAB-1×2-ZnO2, two pieces of UAB-1×1-ZnO2 were positioned in parallel. Similarly, UAB-1×3-ZnO2 was constructed by positioning three pieces of UAB-1×1-ZnO2 in parallel.
Measurements of current responses of UAB to uric acid
Measurement of the rate of hydrogen peroxide (H2O2) generation during enzymatic oxidation of uric acid is the basis of the mechanism for UAB detection, where H2O2 is electroactive and UAB employs amperometric transduction.Citation31 The current signal of UAB corresponds to the increase in exposure to uric acid solution. The oxidation of uric acid (C5H4N4O3) to allantoin (C4H6N4O3) by uricase in the presence of oxygen (O2) is shown below:
The current response of the UAB to uric acid was evaluated by an electrochemical analyzer at 25°C. A voltage of +700 mV versus the Ag/AgCl electrode was provided to the working electrode of the UAB.
To measure the current response, phosphate-buffered saline was first pipetted onto the UAB and left for 3 minutes to allow stabilization of the background current, before uric acid solutions of various concentrations were pipetted onto the UAB and the current response recorded. The data were then used to plot a UAB current response-uric acid concentration curve, from which the sensitivity of UAB was determined as the slope of a linear regression line fitted to the data.
Statistical analysis
Independent-samples t-test was also used to determine whether there are significant differences between UAB in different configurations on its sensitivity. A linear regression test was used to determine the relationship between UAB current responses and the standard uric acid solution at different concentrations, as well as the uric acid concentration in diffusion cells. All statistical analyses were carried out using Statistical Package for the Social Sciences software (SPSS Inc., Chicago, IL, USA), with the level of statistical significance set at P<0.05.
Results
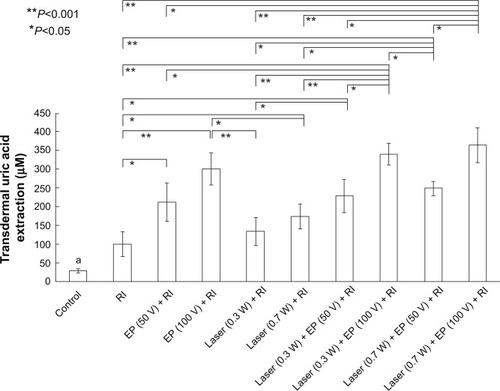
Significant enhancement of transdermal extraction of uric acid was found with the use of physical forces (P<0.05) as compared with diffusion alone (), a combination of physical forces was found to enhance (significant in most cases with P<0.05) a higher transdermal extraction of uric acid as compared to RI alone. When comparing electroporation combined with RI and laser combined with RI, a significant boost of transdermal extraction was also apparent for the former (P<0.05, in most cases), which is similar to the relationship between the use of three combined physical forces and two physical forces (P<0.05, in most cases).
Figure 4 In vitro studies of transdermal noninvasive extraction of uric acid by different physical forces. Statistically significant differences (*P<0.05 and **P<0.001) were found. Data are expressed as the mean and standard deviation (n=3).
Note: aUric acid extraction in the control group was found to be significantly (P<0.05) lower than in all other groups.
Abbreviations: EP, electroporation; RI, reverse iontophoresis.
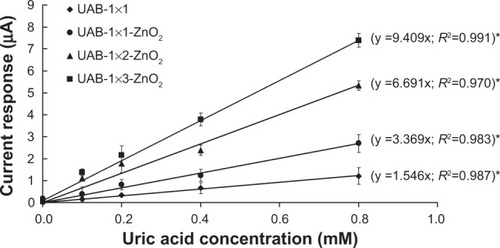
A highly linear relationship (R2≥0.970) was found to exist between the UAB current response and the uric acid concentration (). Addition of ZnO2 nanoparticles to UAB was found to significantly increase (P<0.05) its sensitivity, which was further significantly (P<0.05 in all cases) increased by constructing the UAB in array configurations.
Figure 5 Calibration curves for UAB to uric acid concentration (0–0.8 mM). The lines represent best fit found by linear regression. The sensitivity of UAB is indicated by the slope of the linear regression line.
Notes: *Statistically significant (P<0.05) differences were found for sensitivity when compared with the other UABs. Data are expressed as the mean and standard deviation (n=3).
Abbreviation: UAB, uric acid biosensor.
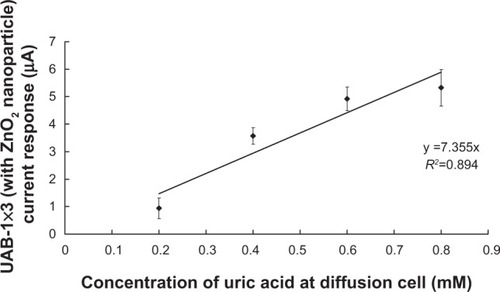
A close linear relationship (R2=0.894) was evident between the concentration of uric acid inside the diffusion cell and the current responses of UAB-1×3-ZnO2 ().
Figure 6 Evaluation of a new approach for noninvasive transdermal determination of uric acid levels.
Notes: A diffusion cell was used, with different concentrations of uric acid (0.2–0.8 mM) stored in its lower chamber. After application of the most effective combination of physical forces, ie, laser (0.7 W) + EP (100 V) + RI to the porcine skin of the diffusion cell, the concentrations of the extracted uric acid solutions at the upper electrode chambers of the diffusion cell were quantified by UAB-1×3-ZnO2. A good linear relationship (R2=0.894) between the current response of UAB-1×3-ZnO2 and uric acid concentration in the diffusion cell was found. Data are expressed as the mean and standard deviation (n=5).
Abbreviations: EP, electroporation; RI, reverse iontophoresis; UAB, uric acid biosensor.
Discussion
In vitro uric acid extraction studies
Noninvasive transdermal extraction of uric acid by different physical forces, ie, electroporation, RI, and laser alone or in combination are shown in . It was found that application of physical forces can significantly (P<0.05) facilitate transdermal extraction of uric acid as compared with diffusion alone (), ie, a control group without application of physical forces.
Combination of physical forces, such as electroporation combined with RI (), laser combined with RI (), and laser combined with electroporation and RI (), was shown to enhance (significantly in most cases, with P<0.05) transdermal extraction of uric acid as compared with RI alone (). This is thought to be due to electroporation and the ability of the laser to create nanochannels in the skin,Citation7,Citation8,Citation13–Citation15 which further facilitate extraction of uric acid as compared with RI alone. The higher the electroporation voltage (or laser power), the greater the extraction of uric acid. This could be a result of higher electroporation voltage (or laser power) injecting more energy for more formation of nanochannels.
When electroporation is combined with RI (), transdermal extraction of uric acid can be further enhanced (P<0.05 in most cases) compared with a combination of laser and RI (). This observation implicates electroporation as a more dominant factor for extraction of uric acid as compared with laser.
Transdermal extraction of uric acid was significantly higher in quantity (P<0.05 in most cases) when a combination of three physical forces (ie, laser combined with electroporation and RI, ) was used than when two physical forces were used, ie, electroporation combined with RI () or laser combined with RI ().
In general, the relationship between transdermal extraction of uric acid and physical forces from laser, electroporation, and RI can be seen as follows:
in order of degree of enhancement of transdermal extraction of uric acid, combination of three physical forces (laser + electroporation + RI) >> combination of two physical forces (electroporation + RI or laser + RI; in general, electroporation + RI > laser + RI) >> single physical force >> diffusion alone
the higher the electroporation voltage (or laser power), the higher the uric acid extraction.
Based on the above two general relationships and the findings shown in , the most effective configurations of laser, electroporation, and RI for uric acid extraction found in this study could be summarized as follows ():
laser – near-infrared laser; wavelength 1,500 nm; pulse width 10 msec; duty cycle 50%; application time 30 seconds; power 0.7 W
electroporation – high electric pulses; pulse width 1 msec; 20 pulses per second; polarity reversing every 5 seconds; application time 30 seconds; voltage 100 V/cm2
RI – symmetrical biphasic DC; phase duration 180 seconds; application time 12 minutes; current density 0.5 mA/cm2.
Uric acid biosensor
The current responses of the UAB to uric acid concentration (0–0.8 mM) are shown in and show direct proportionality to each other, with a correlation coefficient (R2) of ≥0.970. Moreover, addition of ZnO2 nanoparticles to the UAB can significantly increase (2.2-fold, P<0.05) its sensitivity from 1.546 μA/mM (UAB-1×1) to 3.369 μA/mM (UAB-1×1-ZnO2). The UAB measurement range used for uric acid in this study was comparable with that reported for other sensors,Citation28,Citation32,Citation33 but slightly lower than that reported by Zhang et al (0.2–1 mM).Citation34 The sensitivity of UAB-1×1-ZnO2 (3.369 μA/mM) in this study was lower than that reported by Luo et al (16.6 μA/mM),Citation32 but higher than those reported by Zhang et al (5.5 nA/mM)Citation34 and Ching et al (1.55 μA/mM).Citation28
The sensitivity of UAB can be significantly increased by the array configuration of UAB. Our results point to UAB-1×3-ZnO2 having a significantly higher (P<0.05) sensitivity when compared with UAB-1×1-ZnO2 (2.8-fold) and UAB-1×2-ZnO2 (1.4-fold). Further, UAB-1×2-ZnO2 has a significantly (P<0.05) higher sensitivity when compared with UAB-1×1-ZnO2 (2.0-fold). A possible explanation for these phenomena is that the improved sensitivity is due to the higher signal-to-noise ratio achieved with the larger reductive current signals observed at the UAB in a higher array configuration.
Based on the above, UAB-1×3-ZnO2 was determined to be the most sensitive biosensor for quantification of uric acid extracted transdermally in this study.
Noninvasive and transdermal determination of uric acid levels
Based on these findings, combining three physical forces was the most effective tool for noninvasive transdermal extraction of uric acid, and the uric acid extracted was best quantified by UAB-1×3-ZnO2, when diffusion cells as controls for evaluation of this new approach. In this study, uric acid concentrations of 0.2 mM, 0.4 mM, 0.6 mM, and 0.8 mM was separately placed into the lower chamber of the diffusion cell to simulate low, medium (ie, normal), medium-high, and high patient blood uric acid levels, respectively.
The magnitudes of the current response from UAB-1×3-ZnO2 plotted against uric acid concentration inside the diffusion cell is shown in , where a well-fitted linear relationship (R2=0.894) clearly exists between the concentration of uric acid (0.2–0.8 mM) inside the diffusion cell and the current responses from UAB-1×3-ZnO2. This finding demonstrates the accuracy of this new approach to determining uric acid levels noninvasively and transdermally.
Potential applications and limitations of this study
This study forms the basis of a new approach to noninvasive transdermal determination of blood uric acid levels, which may be relevant to measurements of other metabolites and use of biomarkers. We have validated the claim that biomarkers with a large molecular size, such as prostate-specific antigenCitation13 and osteopontin,Citation13 can be extracted noninvasively and transdermally by application of combined physical forces of electroporation and RI. However, very high electroporation is required to extract prostate-specific antigen and osteopontin transdermally, which renders this approach clinically impractical. In the present study, a new approach of replacing high electroporation with combined physical forces of low electroporation and low-power laser () makes transdermal extraction of large molecules possible and relatively more effective. As shown in , extraction of uric acid by the combined physical forces of low-power laser (0.3 W), low electroporation (50 V), and RI, although slightly smaller than that of high electroporation (100 V) and RI, is comparable. Further study is required to be able to extract large biomarkers successfully and transdermally, for this approach to be clinically practical, when combined physical forces from low-power laser, low electroporation, and RI can be achieved.
However, we have previously demonstrated the possibility of extracting homocysteine noninvasively and transdermally by RI alone,Citation9 although the quantity of homocysteine extracted was very low (about 10 μM). Therefore, a highly sensitive biosensor is necessary for detecting such low homocysteine concentrations. In this study, the sensitivity of such biosensors was improved by application of nanoparticles and setting of array configurations, making noninvasive transdermal determination of blood homocysteine levels clinically feasible.
One of the limitations of this study was the application of laser with a wavelength of 1,500 nm, which falls in the invisible spectrum, increasing the chances of eye injury due to accidents. On the other hand, users with cardiac pacemaker may not be able to enjoy the benefit as electroporation may interfere with the function of pacemakers.
Conclusion
In the present study, a new approach to extracting and quantifying blood uric acid levels noninvasively and transdermally was developed, whereby combinations of physical forces from laser, electroporation, and RI were investigated for noninvasive and transdermal extraction of uric acid, and a highly sensitive UAB-1×-ZnO2 has been developed being capable of accurately quantifying the extracted uric acid.
Acknowledgments
This work was supported in part by grants from the Ministry of Science and Technology, Taiwan, Republic of China (102-2221-E-260-004- and 101-2221-E-260-001-), the Taichung Veterans General Hospital and National Chi Nan University, Taiwan, Republic of China (TCVGH-NCNU1027901), and the National Chi Nan University and Puli Christian Hospital, Taichung, Taiwan, Republic of China (102A038).
Disclosure
The authors report no conflicts of interest in this work.
References
- ChoiHKMountDBReginatoAMPathogenesis of goutAnn Intern Med200514349951616204163
- LawrenceRCFelsonDTHelmickCGEstimates of the prevalence of arthritis and other rheumatic conditions in the United StatesArthritis Rheum200858263518163497
- MikulsTRFarrarJTBilkerWBFernandesSSchumacherHRSaagKGGout epidemiology: results from the UK General Practice Research Database, 1990–1999Ann Rheum Dis20056426727215647434
- KrishnamELieneschDKwohCKGout in ambulatory care setting in the United StatesJ Rheumatol20083549850118260174
- WuEQPatelPAYuAPDisease-related and all-cause health care costs of elderly patients with goutJ Manag Care Pharm20081416417518331118
- EdwardsNLThe role of hyperuricemia and gout in kidney and cardiovascular diseaseCleve Clin J Med200875Suppl 5S13S1618822470
- ServiceFJO’BrienPCWiseSDNessSLeBlancSMDermal interstitial glucose as an indicator of ambient glycemiaDiabetes Care199720142614299283791
- GebhartSFaupelMFowlerRGlucose sensing in transdermal body fluid collected under continuous vacuum pressure via micropores in the stratum corneumDiabetes Technol Ther2003515916612871605
- ChingCTSChouTRSunTPHuangSYShiehHLSimultaneous, noninvasive, and transdermal extraction of urea and homocysteine by reverse iontophoresisInt J Nanomedicine2011641742321499431
- ChingCTSBuissonYConnollyPThe effect of pulsed bipolar DC current waveform on the simultaneous extraction of glucose and lactate by reverse iontophoresisSens Actuators B Chem2008129504509
- ChingCTSConnollyPReverse iontophoresis: a non-invasive technique for measuring blood lactate levelSens Actuators B Chem2008129352358
- ChingTSConnollyPSimultaneous transdermal extraction of glucose and lactate from human subjects by reverse iontophoresisInt J Nanomedicine2008321122318686780
- ChingCTSFuLSSunTPHsuTHChangKMUse of electroporation and reverse iontophoresis for extraction of transdermal multibiomarkersInt J Nanomedicine2012788589422393288
- LeeCKChingCTSSunTPNon-invasive and transdermal measurement of blood uric acid level in human by electroporation and reverse iontophoresisInt J Nanomedicine2010599199721187918
- MurthySSKiranVSMathurSKMurthySNNoninvasive transcutaneous sampling of glucose by electroporationJ Diabetes Sci Technol2008225025418437246
- MerinoVKaliaYNGuyRHTransdermal therapy and diagnosis by iontophoresisTrends Biotechnol1997152882909263476
- NeumannESchaefer-RidderMWangYHofschneiderPHGene transfer into mouse lyoma cells by electroporation in high electric fieldEMBO J198278418456329708
- JadoulABouwstraJPreatVEffect of iontophoresis and electroporation on the stratum corneumAdv Drug Deliv Rev1999358910510837691
- TokumotoSHigoNSugibayashiKEffect of electroporation and pH on the iontophoresis transdermal delivery of human insulinInt J Pharm2006326131916920293
- LohKSLeeYHMusaASalmahAAZamriIUse of Fe3O4 nanoparticles for enhancement of biosensor response to the herbicide 2,4-dichlorophenoxyacetic acidSensors2008857755791
- ZhangYYuanRChaiYWangJZhongHAmperometric biosensor for nitrite and hydrogen peroxide based on hemoglobin immobilized on gold nanoparticles/polythionine/platinum nanoparticles modified glassy carbon electrodeJ Chem Technol Biotechnol201287570574
- YaoYLShiuKKA mediator-free bienzyme amperometric biosensor based on horseradish peroxidase and glucose oxidase immobilized on carbon nanotube modified electrodeElectroanalysis20082020902095
- ChenBMaMSuXAn amperometric penicillin biosensor with enhanced sensitivity based on co-immobilization of carbon nanotubes, hematein, and beta-lactamase on glassy carbon electrodeAnal Chim Acta2010674899520638504
- ZhengLLiJXuJImprovement of amperometric glucose biosensor by the immobilization of FcCD inclusive complex and carbon nanotubeAnalyst20101351339134420498884
- LiuJSunSLiuCWeiSAn amperometric glucose biosensor based on a screen-printed electrode and Os-complex mediator for flow injection analysisMeasurement20114418781883
- ChenKJChandrasekara PillaiKRickJBimetallic PtM (M = Pd, Ir) nanoparticle decorated multi-walled carbon nanotube enzyme-free, mediator-less amperometric sensor for H2O2Biosens Bioelectron20123312012722236778
- DaiYQShiuKKHighly sensitive amperometric glucose biosensor based on glassy carbon electrode with copper/palladium coatingElectroanalysis20041618061813
- ChingCTSChangKMHungYLAn array configuration to increase the performance of a biosensorSens Actuators B Chem2013178465472
- ChingCTSCamilleriIConnollyPA low-cost, programmable device for versatile current delivery in iontophoresis applicationsSens Actuators B Chem2005106534540
- ChingCTSChihWYDesign and evaluation of an affordable and programmable mobile device, capable of delivering constant current and high voltage electric pulses of different waveforms for biomedical and clinical applicationsSens Actuators B Chem2014194361370
- ZhaoCWanLWangQLiuSJiaoKHighly sensitive and selective uric acid biosensor based on direct electron transfer of hemoglobin-encapsulated chitosan-modified glassy carbon electrodeAnal Sci2009251013101719667479
- LuoYCDoJSLiuCCAn amperometric uric acid biosensor based on modified Ir–C electrodeBiosens Bioelectron20062248248816908130
- ChauhanNPundirCSAn amperometric uric acid biosensor based on multiwalled carbon nanotube-gold nanoparticle compositeAnal Biochem20114139710321315682
- ZhangYQShenWDGuRAZhuJXueRYAmperometric biosensor for uric acid based on uricase-immobilized silk fibroin membraneAnal Chim Acta1998369123128