
 ?Mathematical formulae have been encoded as MathML and are displayed in this HTML version using MathJax in order to improve their display. Uncheck the box to turn MathJax off. This feature requires Javascript. Click on a formula to zoom.
Abstract
Background
Graphene oxide (GO) is a promising nanomaterial for potential application in the versatile field of biomedicine. Graphene-based nanomaterials have been reported to modulate the functionality of immune cells in culture and to induce pulmonary inflammation in mice. Evidence pertaining to the interaction between graphene-based nanomaterials and the immune system in vivo remains scarce. The present study investigated the effect of polyethylene glycol-coated GO (PEG-GO) on antigen-specific immunity in vivo.
Methods
BALB/c mice were intravenously administered with a single dose of PEG-GO (0.5 or 1 mg/kg) 1 hour before ovalbumin (OVA) sensitization, and antigen-specific antibody production and splenocyte reactivity were measured 7 days later.
Results
Exposure to PEG-GO significantly attenuated the serum level of OVA-specific immunoglobulin E. The production of interferon-γ and interleukin-4 by splenocytes restimulated with OVA in culture was enhanced by treatment with PEG-GO. In addition, PEG-GO augmented the metabolic activity of splenocytes restimulated with OVA but not with the T-cell mitogen concanavalin A.
Conclusion
Collectively, these results demonstrate that systemic exposure to PEG-GO modulates several aspects of antigen-specific immune responses, including the serum production of immunoglobulin E and T-cell functionality.
Introduction
With the rapid development of nanotechnology, the new emerging carbon-based nanomaterial graphene and its derivatives have attracted substantial scientific interest due to their fascinating physical and chemical properties. Graphene is the thinnest and strongest material ever discovered and possesses exceptionally high electric, thermal, and optical conductivity, which endows its promising application in a wide spectrum of fields, including electronics and biomedicine.Citation1–Citation4 In particular, functionalized graphene oxide (GO) has been studied for biosensing, imaging, cancer therapy, and drug delivery.Citation5–Citation8 Upon systemic administration, polyethylene glycol (PEG)-coated graphene and GO have been found mainly accumulated in the reticuloendothelial system, including the liver and spleen.Citation9–Citation11 In addition, immune organs have been shown to be one of the major sites for the biodistribution of other nanoparticles following systemic exposure.Citation12,Citation13 Hence, interactions between nanomaterials and the immune system are concerned, and the consequences of such interactions are relevant issues in addressing potential biomedical applications and health impacts of GO and other nanoparticles.
Studies using cell culture models have shown that graphene attenuated the phagocytic activity and increased the production of proinflammatory cytokines in macrophage-like RAW264.7 cells and primary murine macrophages.Citation14,Citation15 GO and polyvinylpyrrolidone-coated GO enhanced the mitochondria metabolic activity in human macrophages.Citation16 In addition, graphene and GO induced cell death in immortalized and primary macrophages.Citation17–Citation20 Animal studies further revealed that pharyngeal instillation of graphene in mice induced a marked pulmonary infiltration of inflammatory cells and elevated levels of proinflammatory cytokines in the bronchoalveolar lavage fluid.Citation21 These results clearly demonstrated that the functionality of macrophages was modulated by graphene-based nanomaterial in vitro and in vivo. In addition to macrophages, recent studies have shown that dendritic cells (DCs) and T-cells are other targets in the immune system sensitive to graphene-based nanomaterials. For instance, GO induced the production of proinflammatory cytokines and the maturation of human DCs.Citation16 GO also suppressed antigen-presenting activity of DCs by inhibiting the enzymatic activity of immunoproteasomes.Citation22 Furthermore, exposure to GO and polyvinylpyrrolidone-coated GO induced apoptosis in human peripheral T-lymphocytes.Citation16 Mice intravenously injected with graphene nanosheets induced a T-helper 2 (Th2) type of inflammation in the lungs.Citation23 Taken together, accumulating evidence indicates that exposure to graphene-based nanomaterials affected the reactivity of macrophages, DCs, and T-cells and caused inflammation in the respiratory system. However, it remains mostly unknown whether systemic exposure to graphene-based nanomaterials affected antigen-specific immunity.
The objective of the present study is to investigate the effect of functionalized GO on antigen-specific immune responses using a murine model sensitized with ovalbumin (OVA), a T-cell-dependent antigen. We demonstrated here that systemic exposure to a single dose of PEG-GO attenuated the production of antigen-specific immunoglobulin E (IgE) and enhanced antigen-specific T-cell reactivity.
Materials and methods
Reagents and chemicals
Graphite platelets (model xGnP; width 100 μm, thickness 5–15 nm) were obtained from XG Sciences Inc. (East Lansing, MI, USA). Acrylic acid, potassium persulfate, sulfuric acid (H2SO4, 98%), sodium sulfate (Na2SO4), potassium permanganate (KMnO4), hydrogen peroxide solution (H2O2), and ammonia were purchased from Showa Chemical Co. (Tokyo, Japan). 1-ethyl-3-(3-dimethylaminepropyl) carbodiimide hydrochloride (EDC•HCl), 2-(N-morpholino)ethanesulfonic acid hydrate (MES), sulfanilamide, N-hydroxysulfosuccinimide sodium salt, and methoxypolyethylene glycol amine (PEG-NH2; MW: 3,000) were purchased from Sigma-Aldrich (St Louis, MO, USA). Fetal bovine serum and cell culture reagents were purchased from Gibco BRL (Gaithersburg, MD, USA). Enzyme-linked immunosorbent assay (ELISA) sets for cytokine and serum antibody measurement were purchased from BD Biosciences (San Diego, CA, USA).
Preparation of carboxyl graphene oxide
GO was prepared using a modified Hummers method.Citation24 Briefly, graphite platelet (250 mg), NaNO3 (0.125 g), and H2SO4 (98%; 12 mL) were magnetically mixed in a flask in an ice bath, followed by slow addition of KMnO4 (0.75 g), with the temperature kept below 5°C. The flask was then heated to 100°C, followed by slowly adding deionized water (12 mL). The temperature of the solution was kept at 98°C for 0.5 hours. Ten percent of H2O2 (50 mL) was then added to the solution until the cessation of gas evolution. The solution was centrifuged and washed several times with deionized water to remove impurities to obtain large-scale GO. The precipitate was subjected to ultrasonication for 8 hours at 800 W using an Ultrasonic Liquid Processor (Misonix Inc., Farmingdale, NY, USA) and then centrifuged. The supernatant was filtered three times with syringe filters (0.45 μm membrane) to obtain GO, which was subjected to further modification. NaOH (12 mg/mL; 10 mL) was then added to the aqueous suspension of GO (2 mg/mL; 10 mL) and sonicated at 800 W for 2 hours to produce carboxyl graphene oxide (GO-COOH). X-ray photoelectron spectroscopy (XPS) was used to elucidate the structure, COOH conversion, and functional groups of GO.
Preparation of PEG-GO
EDC•HCl (24 mg) and N-hydroxysulfosuccinimide sodium salt (27 mg) were dissolved in 0.5 M MES buffer (2 mL; pH =6.3) in the dark. A 0.2 mL aliquot of this solution was mixed with GO-COOH (5 mg/mL; 0.2 mL) and reacted at 25°C for 60 minutes in the dark to allow the formation of amide bonds between activated carboxyl groups. Activated GO-COOH was separated, washed with MES buffer (0.1 M), resuspended in MES buffer (0.2 mL), and then mixed with PEG-NH2 (3 mg/mL; 0.2 mL) by vortexing at 25°C for 2 hours. The PEG-GO was then separated from the solution, washed with deionized water, and centrifuged to remove both MES buffer and unbound PEG-NH2, and finally was dispersed in deionized water.
Characterizations of GO-COOH and PEG-GO
An atomic force microscope (Dimension Icon, Bruker, Madison, WI, USA) was used to analyze the surface topography, size, and thickness of GO-COOH and PEG-GO. Furthermore, the size distribution of PEG-GO appropriately diluted with 0.22 μm filtered saline was measured by dynamic light scattering using a particle size analyzer (Zetasizer Nano S, Malvern Instruments Ltd., Malvern, UK). The PEG content of PEG-GO was determined by thermogravimetric analysis (STA 449 PC, Netzsch, Selb, Germany). High-resolution XPS (ESCA PHI 1600, Physical Electronics Inc., Chanhassen, MN, USA) was used to detect the details of surface elements.
Protocol of animal experiments
Male BALB/c mice (5 weeks old) were purchased from BioLasco (Ilan, Taiwan). On arrival, mice were randomly transferred to cages and quarantined for at least 1 week. The mice were housed in a temperature (25°C±2°C), humidity (50%±20%), and light (12-hour light/dark cycle)-controlled environment with free access to standard laboratory food and water. All animal experiments were approved by the Institutional Animal Care and Use Committee of the National Taiwan University. The employed sensitization protocol has been previously described.Citation25 In brief, mice (five mice/group) were either left untreated (NS) or administered via the tail vein with a single dose of PEG-GO (0.5 or 1 mg/kg; 0.2 mL/mouse) and/or vehicle (VH; saline; 0.2 mL/mouse). Except for the NS group, the mice were sensitized with OVA 1 hour after drug administration by intraperitoneal injection of 100 μg OVA and 1 mg alum (as adjuvant) per mouse. The mice were sacrificed 7 days after OVA sensitization. Serum and spleens were obtained for further experiments.
Spleen index
The spleen of each mouse was aseptically isolated and weighed immediately after sacrifice. The spleen index was defined as the ratio of spleen weight (mg) to body weight (g).
Measurement of OVA-specific antibodies by ELISA
ELISA plates were coated overnight at 4°C with 0.05% OVA in coating buffer (0.1 M NaHCO3 and 0.034 M Na2CO3; pH 9.5) and blocked with 1% bovine serum albumin in phosphate-buffered saline (PBS). After washing with PBS containing 0.05% Tween 20, serum samples were added into wells (50 μL/well) and incubated for 1 hour. After another washing, appropriately diluted horseradish peroxidase-conjugated antimouse IgM, IgG1, IgG2a, or IgE was added (50 μL/well) and incubated for 1 hour. The plates were washed again and the bound peroxidase conjugate was detected by addition of the tetramethylbenzidine substrate solution (50 μL/well). The reaction was terminated by adding 150 μL/well of 3N H2SO4 solution. The optical density was measured at 450 nm using a microplate reader (Dynatech Laboratories, Chantilly, VA, USA).
Cell cultures for OVA-induced cytokines
Splenocytes were prepared as described previously.Citation26 The splenocytes (5×10⁶ cells/mL) were cultured in triplicate in 48-well plates (0.25 mL/well) and restimulated with OVA (50 μg/mL) for 72 hours. The supernatants were collected and quantified for interleukin (IL)-4 and interferon (IFN)-γ by standard sandwich ELISA.
Cell metabolic activity measured by 3-(4,5-dimethylthiazol-2-yl)-2,5-diphenyltetrazolium bromide assay
The metabolic activity of splenocytes was measured by 3-(4,5-dimethylthiazol-2-yl)-2,5-diphenyltetrazolium bromide (MTT) assay as previously described.Citation27 In brief, the splenocytes (5×10⁶ cells/mL) were cultured in triplicate in 96-well plates and restimulated with OVA for 72 hours. Four hours before the end of incubation, an MTT stock solution (5 mg/mL in PBS, pH 7.4) was added to each well (10 μL/well). The formed fromazan was dissolved by the addition of lysis buffer (10% sodium dodecyl sulfate in N,N-dimethylformamine; 100 μL/well) and incubated overnight. The optical density was measured at 570 nm and at 630 nm as background reference using a microplate reader (Dynatech Laboratories).
Statistical analysis
The mean ± standard error was determined for each group in the individual experiments. Homogeneous data were evaluated by a parametric analysis of variance, and Dunnett’s two-tailed t-test was used to compare treatment groups with the control group. P-value <0.05 was defined as statistical significance.
Results
Synthesis and characterizations of PEG-GO
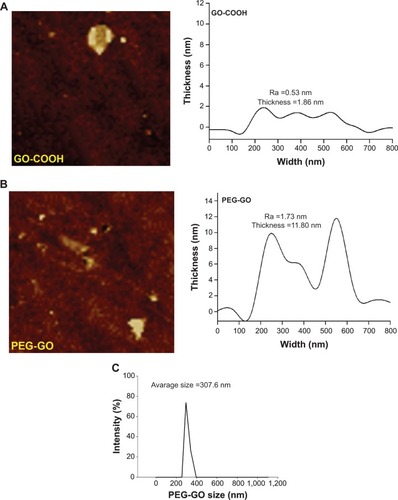
GO was synthesized by a modified Hummers method and then by NaOH treatment to obtain GO-COOH. PEG-GO was synthesized by carbodiimide-catalyzed amide formation of an aqueous solution of GO-COOH with PEG-NH2 solution.Citation28,Citation29 The sheet sizes of GO-COOH and PEG-GO were determined to be between 300 nm and 500 nm by atomic force microscopy imaging (). Atomic force microscopy imaging also showed that the thicknesses of GO-COOH and PEG-GO were 1.86 nm and 11.80 nm, respectively. The average roughness (Ra) of PEG-GO was 1.73 nm, which was higher than that of GO-COOH (0.53 nm), likely owing to the covalent conjugation of PEG on the rougher surface of GO-COOH sheets (). The particle size distribution of PEG-GO was measured by dynamic light scattering. The mean particle size of PEG-GO was 307.6 nm in saline ().
Figure 1 AFM imaging and the size distribution of PEG-GO. AFM images of GO-COOH (A) and PEG-GO (B) deposited on mica substrate and thickness were analyzed using AFM micrographs. (C) The particle size distribution of PEG-GO was measured by dynamic laser scattering.
Abbreviations: AFM, atomic force microscopy; GO-COOH, carboxyl graphene oxide; PEG-GO, polyethylene glycol-coated graphene oxide.
Thermogravimetric analysis was used to investigate the thermal stability of GO-based materials and the presence of PEG on the GO-COOH surface, and also to determine the quantity of grafted organic substances, based on thermal stripping of the covalent bonds that link the graphene sheet and its substituents in the 200°C–500°C temperature range.Citation30 Typical thermogravimetric analysis thermograms indicated weight loss, demonstrating thermal stability of surface-functionalized GO-COOH materials (). The results also indicated that the ratio of PEG grafted on the GO-COOH was about 35% (). Unlike GO-COOH, the thermal degradation of PEG-GO occurred in a single stage between 300°C and 500°C, which we attributed to the thermal degradation of PEG at the GO-COOH surface. The results showed that amine-functionalized PEG was successfully covalently conjugated on the surface of GO-COOH to form PEG-GO.
Figure 2 Successful formation of PEG-GO. (A) TGA curves of GO-COOH and PEG-GO with a heating rate of 10°C/min in N2. The C1s peaks in the XPS spectra of (B) GO-COOH and (C) PEG-GO.
Abbreviations: GO-COOH, carboxyl graphene oxide; PEG-GO, polyethylene glycol-coated graphene oxide; TGA, thermogravimetric analysis; XPS, X-ray photoelectron spectroscopy.
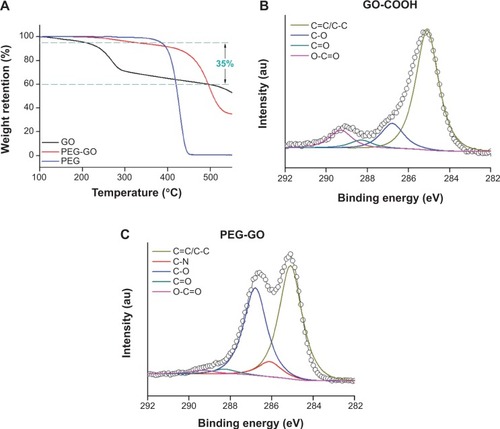
GO-COOH and PEG-GO were also analyzed by XPS to confirm the structure (). The GO-COOH C1s XPS spectrum revealed a significant degree of oxidation indicated by numerous oxygen-containing groups; peaks at 285.1, 286.1, 286.8, 288.3, and 289.3 eV were assigned to carbon atoms in C=C/C-C, C-N, C-O, C=O, and O-C=O, respectively (). After modification, the C1s XPS spectrum of the resulting PEG-GO showed significantly decreased carboxyl acid groups (289.3 eV) from 10.29% to 1.53% (). Additional peaks at 286.1 eV for PEG-GO originated from C-N bonds.Citation31 We concluded that PEG had been successfully grafted on to GO-COOH.
Table 1 The C1s X-ray photoelectron spectroscopy spectrum parameter of carboxyl graphene oxide (GO-COOH) and polyethylene glycol-coated graphene oxide (PEG-GO)
PEG-GO did not affect the body weight and spleen index of OVA-sensitized mice
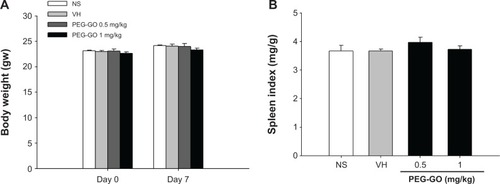
Mice were intravenously administered with a single dose of PEG-GO (0.5 and 1 mg/kg of body weight) and then sensitized with OVA. Seven days after the OVA sensitization, mice were sacrificed and their serum samples and spleens were harvested. We firstly investigated whether PEG-GO treatment affected the body weight and the spleen index. The results showed that both parameters were not affected by PEG-GO administration ().
Figure 3 No effects of polyethylene glycol-coated graphene oxide (PEG-GO) on the body weight and spleen index of OVA-sensitized mice.
Notes: Mice were treated with PEG-GO and sensitized with OVA as described in the materials and methods section. (A) The body weight of mice prior to PEG-GO administration (day 0) and prior to sacrifice (day 7) was measured. (B) Spleens were isolated and weighted aseptically after sacrifice. The spleen index was defined as the ratio of spleen weight (mg) to body weight (g). Data are expressed as the mean ± standard error of four to five mice. Results are representative of three independent experiments.
Abbreviations: NS, untreated and not sensitized; OVA, ovalbumin; PEG-GO, PEG-GO-treated and OVA-sensitized; VH, saline-treated and OVA-sensitized.
PEG-GO attenuated antigen-specific IgE production
To investigate the effect of PEG-GO on humoral immunity in OVA-sensitized mice, the serum production of OVA-specific antibodies were examined. A marked increase in the serum levels of all OVA-specific antibodies examined was observed in OVA-sensitized mice, as compared with nonsensitized mice (VH vs NS), indicating a successful induction of humoral responses (). The level of OVA-specific IgM, IgG1, and IgG2a was not affected by PEG-GO treatment. In contrast, the production of OVA-specific IgE in mice treated with PEG-GO was significantly attenuated. The magnitude of effect between the two doses of PEG-GO was comparable ().
Table 2 The effect of polyethylene glycol-coated graphene oxide (PEG-GO) on the serum production of ovalbumin (OVA)-specific antibodiesTable Footnotea
PEG-GO enhanced antigen-induced T-cell reactivity
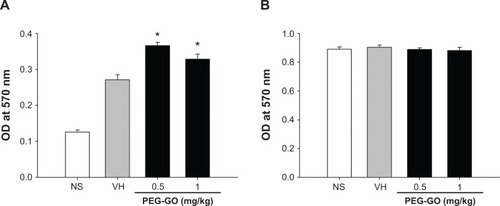
As T-cells play a key role in humoral immunity, we next examined the effect of PEG-GO on T-cell functions. Splenocytes isolated from each group were restimulated with OVA (50 μg/mL) in culture for 72 hours to induce antigen-specific cytokine production. OVA restimulation markedly increased the production of IFN-γ and IL-4 by splenocytes of OVA-sensitized mice, as compared with that of nonsensitized mice (; VH vs NS). Notably, the production of both IFN-γ and IL-4 was significantly increased in PEG-GO-treated groups (). As the production of antigen-induced IFN-γ and IL-4 was augmented by PEG-GO treatment, the metabolic activity of splenocytes was further examined. As shown in , the metabolic activity of the OVA-stimulated splenocytes was enhanced in PEG-GO-treated groups. To further investigate the potential influence of PEG-GO on T-cell reactivity, splenocytes were stimulated with the T-cell mitogen concanavalin A (ConA; 5 μg/mL) for 48 hours, and their metabolic activity was measured. Notably, the metabolic activity of ConA-stimulated splenocytes was not altered by PEG-GO treatment ().
Figure 4 The effect of PEG-GO on the production of OVA-specific cytokines by splenocytes.
Notes: Mice were treated with PEG-GO and sensitized with OVA as described in the materials and methods section. The splenocytes (5×10⁶ cells/mL) isolated from each group of mice were restimulated with OVA (50 μg/mL) in culture for 72 hours to induce cytokine production. The levels of (A) IFN-γ and (B) IL-4 in the supernatants were measured by ELISA. Data are expressed as the mean ± standard error of triplicate cultures. *P<0.05 compared with the VH control. Results are a representative of three independent experiments.
Abbreviations: ELISA, enzyme-linked immunosorbent assay; IFN, interferon; IL, interleukin; OVA, ovalbumin; PEG-GO, polyethylene glycol-coated graphene oxide; VH, vehicle (saline)-treated and OVA-sensitized; NS, nonsensitized; ND, the level of IL-4 is below the limit of quantification.
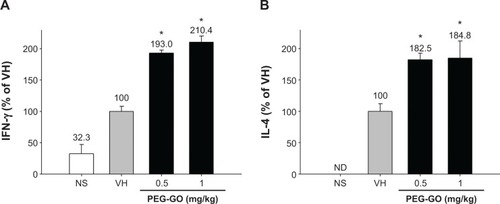
Figure 5 The effect of PEG-GO on the metabolic activity of splenocytes.
Notes: Mice were treated with PEG-GO and sensitized with OVA as described in the materials and methods section. The splenocytes (5×10⁶ cells/mL) isolated from each group of mice were cultured in the presence of (A) OVA (50 μg/mL) for 72 hours or (B) concanavalin A (5 μg/mL) for 48 hours, and their metabolic activity was determined by an MTT assay. Data are expressed as the mean ± standard error of triplicate cultures. *P<0.05 compared with the VH group. Results are a representative of three independent experiments.
Abbreviations: MTT, 3-(4,5-dimethylthiazol-2-yl)-2,5-diphenyltetrazolium bromide; OVA, ovalbumin; PEG-GO, polyethylene glycol-coated graphene oxide; VH, vehicle (saline)-treated and OVA-sensitized; OD, optical density; NS, nonsensitized.
Discussion
Nanotechnology has been increasingly applied in various fields, such as biomedicine. Functionalized GO has been suggested as a promising carbon-based nanomaterial for biosensing, imaging, drug delivery, and tumor therapy.Citation5–Citation8 Previous studies reported that systemically administered PEG-GO was mainly taken up by the reticuloendothelial system, resulting in the potential exposure of immune cells to high concentrations of PEG-GO.Citation9–Citation11 Although a few studies demonstrated that GO modulated the functionality of macrophages, DCs, and T-cells,Citation14–Citation16,Citation22 evidence pertaining to the effect of GO on antigen-specific immunity is limited. In the present study, we investigated the effect of systemic exposure to PEG-GO on antigen-specific antibody production and T-cell responses in mice sensitized with OVA. Our data demonstrated that systemic exposure to a single dose of PEG-GO markedly attenuated the production of OVA-specific IgE (). In addition, exposure to PEG-GO significantly increased the cytokine production and metabolic activity of splenocytes restimulated with the antigen OVA ( and ). These results indicated that systemic exposure to PEG-GO modulated humoral immunity and antigen-specific T-cell responses. By comparison, PEG-GO did not affect the metabolic activity of splenocytes stimulated with ConA (), illustrating that general mitogenic activation of T-cells was not influenced by PEG-GO.
PEG-GO has been shown to possess high biocompatibility in vivo, in which long-term systemic exposure of mice to PEG-GO up to 20 mg/kg did not induce apparent toxicity, as evidenced by body weight measurement and serum biochemistry analysis.Citation11 In the present study, the employed dose range of PEG-GO (0.5 and 1 mg/kg), which was chosen according to our pilot studies and previous results,Citation9 was far less than that used in the aforementioned toxicological studies and another report addressing the influence of GO on photothermal therapy of tumor (16–20 mg/kg).Citation11,Citation32 As expected, the employed low doses of PEG-GO did not alter the body weight and spleen index in OVA-sensitized mice (). The spleen index (spleen weight/body weight) is a useful parameter to preliminarily evaluate the effects of PEG-GO on immunotoxicity and the composition of the spleen. These results are in line with previous murine studies showing that PEG-GO exhibited high biocompatibility.Citation11
To investigate the effect of PEG-GO on antigen-specific immunity, antibody production and T-cell reactivity in OVA-sensitized mice were examined. Intravenous administration of mice with PEG-GO markedly attenuated the serum production of OVA-specific IgE, whereas OVA-specific IgM, IgG1, and IgG2a were not altered (). It has been well documented that Th cell-derived cytokines play a critical role in the regulation of antibody isotype switching. In mice, the Th1 signature cytokine IFN-γ induces IgG2a production, while the Th2 cytokine IL-4 induced IgG1 and IgE production.Citation33 Hence, we examined the effect of PEG-GO on OVA-induced production of IFN-γ and IL-4 by splenocytes. Exposure to PEG-GO significantly enhanced the production of both cytokines. The metabolic activity of splenocytes restimulated with OVA was also increased in the PEG-GO-treated group. In contrast, the metabolic activity of splenocytes stimulated with ConA was not affected by PEG-GO treatment. These results indicated that only antigen-specific T-cell responses were influenced by PEG-GO, and the elevated metabolic activity of OVA-restimulated splenocytes in the PEG-GO group might be one potential underlying mechanism for the enhanced production of OVA-specific IFN-γ and IL-4. Interestingly, PEG-GO-induced elevation of IFN-γ and IL-4 production did not result in increased production of corresponding antibody isotypes, namely IgG2a and IgG1. However, OVA-specific IgE was attenuated in mice treated with PEG-GO. The underlying mechanisms for these results are currently unclear. We speculated that immune cells other than T-cells involved in antibody production may contribute to the observed results. For example, it has been reported that surface-linked liposomal OVA affected OVA-IgE production via T-cell-independent mechanisms.Citation34 In addition, different B-cell activators have been shown to differentially affect the induction of IgE production.Citation35 Thus, in addition to T-cells, other targets and/or mediators may be affected by PEG-GO and contribute to the impaired OVA-IgE production observed in the present study. Further studies investigating the effect of PEG-GO on the functionality of B-cells are warranted.
T-cells play a critical role in the induction of protective immunity by vaccination. Chitosan nanoparticles have been suggested as a promising vaccine adjuvant, as evidenced by the promotion of both Th1 and Th2 immune responses in OVA-sensitized mice.Citation36 Previous studies also showed that GO-absorbed anti-IL10R antibodies significantly increased OVA-specific CD8+ T-cell responses in mice.Citation37 In line with these reports, the present study showed that systemic exposure to PEG-GO enhanced the expression of both Th1 and Th2 cytokines and the metabolic activity of splenocytes stimulated by the primed antigen OVA. These findings suggest that PEG-GO may be utilized as potential immunomodulators to enhance antigen-induced T-cell activities. Whether PEG-GO modulates immune responses elicited by antigens other than OVA is an intriguing issue to be addressed.
IgE is a key mediator involved in type I hypersensitivity, including asthma and food allergy.Citation38 Therefore, finding a way to control IgE production is one of the major goals in allergic research. Here, we showed that PEG-GO attenuated antigen-specific IgE production in OVA-sensitized mice, suggesting that PEG-GO may be a potential chemical to modulate type I hypersensitivity. Further studies using appropriate murine models of type I hypersensitivity are required to more comprehensively investigate the immunomodulatory effect of PEG-GO on allergy.
Conclusion
The present study demonstrates that a single intravenous administration of PEG-GO markedly attenuated antigen-specific IgE production and enhanced the metabolic activity and the expression of both Th1 and Th2 cytokines by splenocytes. These results suggest that PEG-GO may possess potential as an immune modulator for antigen-specific immune responses.
Acknowledgments
This work was supported in part by grants NSC102-2321-B002-040 and NSC102-2622-B-002-008-CC2 from the National Science Council, Executive Yuan, Taiwan.
Disclosure
The authors report no conflicts of interest in this work.
References
- NovoselovKSGeimAKMorozovSVElectric field effect in atomically thin carbon filmsScience2004306569666666915499015
- FengLLiuZGraphene in biomedicine: opportunities and challengesNanomedicine (Lond)20116231732421385134
- EdaGChhowallaMChemically derived graphene oxide: towards large-area thin-film electronics and optoelectronicsAdv Mater201022222392241520432408
- AllenMJTungVCKanerRBHoneycomb carbon: a review of grapheneChem Rev2010110113214519610631
- LiMZhouXDingWGuoSWuNFluorescent aptamer-functionalized graphene oxide biosensor for label-free detection of mercury(II)Biosens Bioelectron20134188989323098856
- SunXLiuZWelsherKNano-graphene oxide for cellular imaging and drug deliveryNano Res20081320321220216934
- ZhangLXiaJZhaoQLiuLZhangZFunctional graphene oxide as a nanocarrier for controlled loading and targeted delivery of mixed anticancer drugsSmall20106453754420033930
- ZhangWGuoZHuangDLiuZGuoXZhongHSynergistic effect of chemo-photothermal therapy using PEGylated graphene oxideBiomaterials201132338555856121839507
- YangKGongHShiXWanJZhangYLiuZIn vivo biodistribution and toxicology of functionalized nano-graphene oxide in mice after oral and intraperitoneal administrationBiomaterials201334112787279523340196
- LiuJHYangSTWangHChangYCaoALiuYEffect of size and dose on the biodistribution of graphene oxide in miceNanomedicine (Lond)20127121801181222830500
- YangKWanJZhangSZhangYLeeSTLiuZIn vivo pharmacokinetics, long-term biodistribution, and toxicology of PEGylated graphene in miceACS Nano20115151652221162527
- WangJChenYChenBPharmacokinetic parameters and tissue distribution of magnetic Fe(3)O(4) nanoparticles in miceInt J Nanomedicine2010586186621042548
- SchipperMLChengZLeeSWmicroPET-based biodistribution of quantum dots in living miceJ Nucl Med20074891511151817704240
- SasidharanAPanchakarlaLSSadanandanARHemocompatibility and macrophage response of pristine and functionalized grapheneSmall2012881251126322334378
- ZhouHZhaoKLiWThe interactions between pristine graphene and macrophages and the production of cytokines/chemokines via TLR- and NF-kappaB-related signaling pathwaysBiomaterials201233296933694222796167
- ZhiXFangHBaoCThe immunotoxicity of graphene oxides and the effect of PVP-coatingBiomaterials201334215254526123566800
- ChenGYYangHJLuCHSimultaneous induction of autophagy and toll-like receptor signaling pathways by graphene oxideBiomaterials201233276559656922704844
- LiYLiuYFuYThe triggering of apoptosis in macrophages by pristine graphene through the MAPK and TGF-beta signaling pathwaysBiomaterials201233240241122019121
- QuGLiuSZhangSGraphene oxide induces toll-like receptor 4 (TLR4)-dependent necrosis in macrophagesACS Nano2013775732574523734789
- WanBWangZXLvQYSingle-walled carbon nanotubes and graphene oxides induce autophagosome accumulation and lysosome impairment in primarily cultured murine peritoneal macrophagesToxicol Lett2013221211812723769962
- SchinwaldAMurphyFAJonesAMacNeeWDonaldsonKGraphene-based nanoplatelets: a new risk to the respiratory system as a consequence of their unusual aerodynamic propertiesACS Nano20126173674622195731
- TkachAVYanamalaNStanleySGraphene oxide, but not fullerenes, targets immunoproteasomes and suppresses antigen presentation by dendritic cellsSmall201399–101686169022887961
- WangXPodilaRShannahanJHRaoAMBrownJMIntravenously delivered graphene nanosheets and multiwalled carbon nanotubes induce site-specific Th2 inflammatory responses via the IL–33/ST2 axisInt J Nanomedicine201381733174823662055
- HummersWSOffemanREPreparation of graphitic oxideJ Am Chem Soc195880613391339
- ShenCCWangCCLiaoMHJanTRA single exposure to iron oxide nanoparticles attenuates antigen-specific antibody production and T-cell reactivity in ovalbumin-sensitized BALB/c miceInt J Nanomedicine201161229123521753874
- KaminskiNEKohWSYangKHLeeMKesslerFKSuppression of the humoral immune response by cannabinoids is partially mediated through inhibition of adenylate cyclase by a pertussis toxin-sensitive G-protein coupled mechanismBiochem Pharmacol19944810189919087986201
- MosmannTRapid colorimetric assay for cellular growth and survival: application to proliferation and cytotoxicity assaysJ Immunol Methods1983651–255636606682
- YangHWLuYJLinKJEGRF conjugated PEGylated nano-graphene oxide for targeted chemotherapy and photothermal therapyBiomaterials201334297204721423800742
- YangHWHuaMYHwangTLNon-invasive synergistic treatment of brain tumors by targeted chemotherapeutic delivery and amplified focused ultrasound-hyperthermia using magnetic nanographene oxideAdv Mater201325263605361123712913
- DykeCATourJMUnbundled and highly functionalized carbon nanotubes from aqueous reactionsNano Lett20033912151218
- WangJYYangSYHuangYLTienHWChinWKMaCCMPreparation and properties of graphene oxide/polyimide composite films with low dielectric constant and ultrahigh strength via in situpolymerizationJ Mater Chem201121351356913575
- YangKWanJZhangSTianBZhangYLiuZThe influence of surface chemistry and size of nanoscale graphene oxide on photothermal therapy of cancer using ultra-low laser powerBiomaterials20123372206221422169821
- MosmannTRSadSThe expanding universe of T-cell subsets: Th1, Th2 and moreImmunol Today19961731381468820272
- TaneichiMNaitoSKatoHT cell-independent regulation of IgE antibody production induced by surface-linked liposomal antigenJ Immunol200216984246425212370355
- SnapperCMPecanhaLMLevineADMondJJIgE class switching is critically dependent upon the nature of the B cell activator, in addition to the presence of IL-4J Immunol19911474116311701714474
- WenZSXuYLZouXTXuZRChitosan nanoparticles act as an adjuvant to promote both Th1 and Th2 immune responses induced by ovalbumin in miceMar Drugs2011961038105521747747
- NiGWangYWuXWangXChenSLiuXGraphene oxide absorbed anti-IL10R antibodies enhance LPS induced immune responses in vitro and in vivoImmunol Lett2012148212613223064239
- GouldHJSuttonBJBeavilAJThe biology of IGE and the basis of allergic diseaseAnnu Rev Immunol20032157962812500981