
Abstract
Using the intrinsic toxicity of nanomaterials for anticancer therapy is an emerging concept. In this work, we discovered that CdTe/CdS quantum dots, when coated with lipids (QD-LC) instead of popular liposomes, polymers, or dendrimers, demonstrated extraordinarily high specificity for cancer cells, which was due to the difference in the macropinocytosis uptake pathways of QD-LC between the cancer cells and the normal cells. QD-LC-induced HepG2 cell apoptosis was concomitant with the activation of the JNK/caspase-3 signaling pathway. Moreover, QD-LC treatment resulted in a delay in the latent period for microtumor formation of mouse hepatocarcinoma H22 cells and inhibited tumor growth, with a reduction of 53.2% in tumor volume without toxicity in major organs after intratumoral administrations to tumor-bearing mice. Our results demonstrate that QD-LC could be a very promising theranostic agent against liver cancer.
Introduction
Recent advances in nanomedicine have brought new strategies for cancer diagnosis and treatment. Inorganic nanoparticles, such as gold, quantum dots (QDs), iron oxide, silica, and rare earth particles, are regarded as possible theranostic agents due to their unique material- and size-dependent physicochemical properties, such as an enhanced permeability and retention effect, photothermal effect, and optical tracking.Citation1–Citation3 However, the application of these materials, especially for biomedical purposes, is still limited by the potential toxicity of nanomaterials.Citation4,Citation5 Although the field of nanotoxicology is still developing, several common mechanisms have been found, and, in general, reasonable control over the extent of nanotoxicity is possible.Citation6–Citation8 Therefore, nanomaterial-based therapy utilizing the intrinsic toxicity of nanomaterials has been explored, and it was found that the uptake of some nanomaterials can be controlled to induce cellular autophagy and/or cell death in cancer cells.Citation9,Citation10 Several recent studies indicated great potential for degrading ZnO or silver nanoparticles as novel tools in cancer therapy.Citation11–Citation14 Sasidharan et al showed that ZnO nanoparticles degraded much faster in the low local pH microenvironment typically associated with tumors, thereby selectively destroying cancer cells.Citation15 To date, the intrinsic toxicity of a wide variety of inorganic materials and the selectivity thereof toward cancer cells make this a facile and universal methodology for cancer therapy.
QDs, especially cadmium-based QDs like CdTe, CdTe/CdS, and CdSe/ZnS QDs, have been studied extensively in the past 2 decades. These compounds display unique optical properties, including a broad absorption with narrow photoluminescence spectra, high quantum yields (QYs), low photo bleaching, and size-dependent emission-wavelength tunability.Citation16,Citation17 These properties made QDs an appealing candidate for tumor-labeling probes, with significant advantages over conventional fluorescent dyes.Citation18–Citation20 However, safety concerns about the systematic toxicity of cadmium-based QDs has limited their application in biological research as well as their effectiveness as an imaging agent for cancer diagnosis; attempts have been made to derive effective means by which to attenuate their cellular toxicity.Citation21–Citation23 Functionalized QDs with polymers or dendrimers have been used successfully to improve biocompatibility and reduce cytotoxicity in normal tissues.Citation24–Citation26 Alternatively, for QDs modified with various materials, such as an antibody, aptamer, arginine-glycineaspartic acid, or folic acid, to increase their targeting ability and biological compatibility, these modifications also offer the possibility of QD-based cancer imaging.Citation27–Citation30
The determinative factor of QD toxicity is the dose that refers to the intracellular levels of QD rather than its concentration in the extracellular fluids.Citation31 Finding an appropriate method that facilitates QD uptake only in cancer cells, but not in normal cells, might selectively kill tumor cells without causing damage to normal tissues. Therefore, the aims of this study were to coat lipids on the CdTe/CdS QDs to form a complex labeled as QD-LC and to achieve the selective treatment of liver cancer in vivo and in vitro. This complex demonstrated striking susceptibility to cancer. We have executed in vitro and in vivo studies on the mechanism underlying the phenomenon. In animal experiments, QD-LC treatment resulted in a delay in the latent period for microtumor formation in mouse hepatocarcinoma H22 and inhibited tumor growth without toxicity in major organs. Our findings may enrich the nanocomplex spectrum of which nanotoxicity can be used for cancer therapy.
Materials and methods
Reagents
1-Ethyl-3-(3-dimethylaminopropyl)carbodiimide hydrochloride (99%), sulfo-N-hydroxysulfosuccinimide (98.5%), (3-[4,5-dimethylthiazol-2-yl]-2,5-diphenyltetrazolium bromide) (MTT), NaN3, amiloride, simvastatin, mycostatin, sucrose, and chlorpromazine were purchased from Sigma-Aldrich Co. (St Louis, MO, USA). Diagnostic kits for aspartate aminotransferase (AST), alanine aminotransferase (ALT), blood urea nitrogen (BUN), and creatinine (CRE) were purchased from the Nanjing Jiancheng Bioengineering Institute (Nanjing, People’s Republic of China). RPMI 1640 medium, fetal bovine serum, penicillin, streptomycin, and bovine serum albumin (BSA) protein assay kit were purchased from the Beyotime Institute of Biotechnology (Haimen, Jiangsu, People’s Republic of China). FuGENE® HD transfection reagents were purchased from Hoffman-La Roche Applied Science (Basel, Switzerland). The primary antibodies for JNK, p-JNK, Bax, cytochrome c, caspase-9, caspase-3, and GAPDH were obtained from Santa Cruz Biotechnology Inc. (Dallas, TX, USA). All the reagents were used without further purification.
Synthesis and characterization of water-soluble core/shell CdTe/CdS QDs and CdTe/CdS QD-LC
CdTe/CdS core/shell QDs were prepared according to our previous publications.Citation20,Citation32 The tailor-designed CdTe QDs (QY =27%) were capped with three monolayers of CdS shell to obtain the yellow emitting CdTe/CdS core/shell QDs with a QY of 69%. For the preparation of the QD-LC, 500 μL of QDs (10 μM) was mixed with 1 μL of FuGENE® HD transfection reagents in phosphate-buffered saline (PBS). The mixture was sonicated for 10 minutes in a bath sonicator at 37°C and then centrifuged in Microcon Centrifugal Filter Devices (50,000 nominal molecular weight limit; EMD Millipore, Billerica, MA, USA), and the resulting samples were then sterilized using a 0.22 μm filter. Finally, the concentration of QDs was determined via a UV-2550 spectrophotometer (Shimadzu, Kyoto, Japan). Transmission electron microscopy (TEM) images and energy-dispersive X-ray spectroscopy of QDs and QD-LC were performed using a Hitachi model H-7650 TEM (Hitachi Ltd., Tokyo, Japan) operated at 80 kV. Particle size distribution and zeta potential were measured with a Nano ZS90 Zetasizer (Malvern Instruments, Malvern, UK) according to the manufacturer’s instructions. Ultraviolet-visible absorption and fluorescent emission spectra were measured at room temperature using a UV-3101 spectrophotometer and a Hitachi F-4500 fluorescence spectrofluorometer, respectively.
Cell viability determination by MTT assay
Human hepatocarcinoma cell lines, including HepG2, Bel-7404, SMMC-7721, Huh-7, and Bel-7402, and normal cell lines, including hepatic embryo cells HL-7702, rat hepatic satellite cells CFSC-2G, myocardium cell line H9C2, neonatal rat myocardium cells, and human umbilical vein endothelial cells, were maintained in RPMI 1640 supplemented with 10% fetal bovine serum, 100 units/mL penicillin, and 100 μg/mL streptomycin in an atmosphere of 95% air and 5% CO2 at 37°C. The MTT assay was performed in 96-well plates in sextuplicate. Cells were seeded at a density of 5×10³ cells/well overnight and treated with the QD-LC at final concentrations of 0, 0.05, 0.25, 0.5, 1.0, 2.0, and 4.0 μM for 24 hours and also for different time intervals, including 6, 12, 24, and 48 hours, at 2.0 μM QD-LC. Twenty microliters of MTT (5 mg/mL) was added to each well for the last 3 hours of the incubation with the QD-LC. Afterward, the cell supernatants were discarded, the MTT crystals were dissolved in dimethyl sulfoxide, and the optical density was measured at the 490 nm wavelength. The ratio of cell proliferation to control group was calculated from the data obtained by the MTT assay.
Intracellular QD-LC quantification by flow cytometry
To quantitate the uptake dynamics of the QD-LC by fluorescence-activated cell sorting, HepG2 cells were seeded in 24-well plates and then incubated with 0.2 and 2 μM QD or QD-LC for 24 hours. The supernatant solution was removed, and the cells were washed twice with chilled PBS to remove any extracellular QD-LC. Then, the cells were trypsinized and resuspended in chilled PBS to yield a concentration of 106 cells/mL. The excitation wavelength was set at 360 nm, and the red fluorescence content was measured at 550–590 nm, the emission wavelength.
Identification of the cellular uptake pathways of QD-LC
To study the effect of different inhibitors on the cellular uptake of the QD-LC, HepG2 and HL-7702 cells were preincubated with different inhibitors for 30 minutes at 37°C. The cellular uptake mechanisms of the QD-LC were identified by blocking the uptake pathway with different treatments.Citation33,Citation34 HepG2 and HL-7702 cells were preincubated with different inhibitors for 60 minutes at 37°C. For adenosine triphosphate (ATP) depletion, the cells were preincubated with NaN3 (3.0 mg/mL). For hindering the clathrin-mediated pathway, the cells were preincubated with chlorpromazine (20 μg/mL) and sucrose (500 mM). To block the caveolae/lipid rafts pathway, the cells were pretreated with simvastatin (10 μg/mL). To block the caveolae-mediated pathway, the cells were pretreated with mycostatin (5 μg/mL). To hinder the macropinocytosis pathway, the cells were pretreated with amiloride (10 μg/mL). To block energy-dependent endocytosis, the cells were incubated at both 37°C and 4°C, then the inhibitor-containing culture medium was discarded, and QD-LC-containing culture medium was co-cultured with the cells for a 6-hour treatment. The cells were treated as described in “Intracellular QD-LC quantification by flow cytometry” and the fluorescence intensity was determined by fluorescence-activated cell sorting.
Detection of apoptosis by flow cytometry
Cell death and apoptosis was detected using an annexin V–fluorescein isothiocyanate apoptosis detection kit by flow cytometry. In brief, after HepG2 cells were treated with 2.0 μM QD-LC for 6 or 24 hours, the cells were harvested and washed with cold PBS twice, and the cell pellets were resuspended in binding buffer to cell suspension at a density of 1×l06 cells/mL. Five microliters of fluorescein isothiocyanate-conjugated annexin V was added to the suspension, which was incubated for 15 minutes at 4°C in the dark, then 5 μL of propidium iodide was added and the solution was mixed for 5 minutes at 4°C in the dark. The samples were subsequently analyzed by flow cytometry.
Western blot for the apoptosis signaling pathway
HepG2 cells were treated with the QD-LC for 24 hours and lysed with RIPA cell lysis buffer (Cell Signaling Technology, Inc., Danvers, MA, USA) containing a phosphatase inhibitor and the protease inhibitor cocktail (Sigma-Aldrich Co.) by incubating on ice for 30 minutes. The lysates were collected by centrifugation, and the protein concentrations were determined by the BCA method. The samples were separated on 12% sodium dodecyl sulfate polyacrylamide gel electrophoresis (SDS-PAGE) gels and transferred onto polyvinylidene fluoride membranes. After blocking in Tris-buffered saline buffer (150 mmol/L NaCl, 10 mmol/L Tris, pH 7.4) containing 5% nonfat milk, the blots were incubated with a primary antibody (rabbit anti-JNK, p-JNK, Bax, Bcl-2, cytochrome c, caspase-9 or caspase-3) at 4°C overnight and with a corresponding horseradish peroxidase-conjugated secondary antibody (1:2,000 dilution) for 1 hour at room temperature. The blots were visualized by super-enhanced chemiluminescence and quantified by Quantity ONE software (Bio-Rad Laboratories Inc., Hercules, CA, USA). GAPDH was used as the internal control.
Tumor formation in vivo
The use of mice for this study was approved by the Animal Care and Use Committee of Jilin University (Changchun, People’s Republic of China). Six- to eight-week-old, 18–22 g male Institute of Cancer Research (ICR) mice were purchased from the Experimental Animal Center of the Norman Bethune College of Medicine, Jilin University. First, H22 cells were incubated with 0.25 μM QD-LC for 6 hours (cell viability was not decreased compared with the control group. Supplementary material; Figure S1). The complex was injected subcutaneously into the right side of the dorsal flank of the mice, with a total cell number of 2×10⁶ for five mice in each group. Tumor volumes were measured each day and calculated according to the formula length × widthCitation2 × 0.52. The mice bearing more than 60 mm3 tumor volume were considered to be undergoing microtumor formation. The mice were sacrificed on the tenth day after the tumor formation, and all tumors were removed and weighed.
The inhibitory tumor growth effect of QD-LC in vivo
Six- to eight-week-old, 18–22 g male ICR mice were used in this study. The H22 cell suspension was injected subcutaneously into the right side of the dorsal flank of the mice, with a total cell number of 2×10⁶. When the tumor volume reached 100 mm3, 12 mice were divided into two groups; 10 μL of the QD-LC PBS solution was injected into the center of the tumor in the QD-LC group, while 10 μL PBS was injected into the tumors in the control group. The administrations were conducted once every 3 days, and the mice were sacrificed on the 19th day.
Toxicity assay in vivo
To assess the toxicity of QD-LC, the safety profiling included an assessment of blood chemistry and a histological examination of the major organs. Following the animal experiments described above, the mice were sacrificed on the 19th day, and all tumors were removed and weighed. Serum was collected by centrifuging the whole blood at 3,000 rpm for 15 minutes. The biochemical parameters, including ALT, AST, CRE, and BUN, were assayed using diagnostic kits provided by the Nanjing Jiancheng Bioengineering Institute. Then, appropriate-size sections of the tumor(s), liver, kidney, spleen, lung, and heart were fixed in 10% formalin and then embedded into paraffin. Tissue sections of 4 μm thickness were mounted on glass slides. The sections were stained with hematoxylin and eosin and examined by light microscopy. The slides were read by an experienced veterinary pathologist.
Statistical analysis
Data were expressed as the mean ± standard deviation. The statistical significance of the data between two groups was compared by Student’s t-test. An analysis of variance was used to analyze the differences among the different groups. The results were considered significant at P<0.05.
Results
Characterization of QD-LC
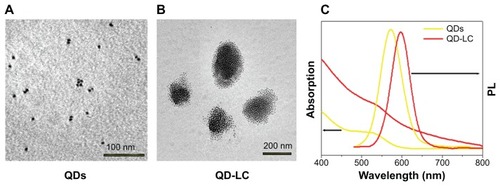
TEM micrographs of QDs and QD-LC are shown in . The QDs appeared as monodisperse dark dots approximately 10 nm in size, and the QD-LCs were spherical or ellipsoidal particles with an average size of 150 nm due to a number of QDs incorporating into the lipids, resulting in a rough particle surface. The dynamic light scattering data (Figure S2A and B) indicated that QDs and QD-LC had average diameters of approximately 7 nm and 162 nm, respectively. The zeta potential of the QD-LCs was evaluated to identify the formation of the QDs and lipids (Figure S2C–E). Furthermore, the formation of the QD-LCs was identified by the energy dispersive X-ray spectroscopy spectra (Figure S3). In addition, the optical characterization of free QDs and QD-LCs is shown in . Upon encapsulation within the lipids, there was some degree of aggregation, resulting in the emission peak shifting from 570 nm to 600 nm. No fluorescence quenching was observed when QD-LC was stored at 4°C for 3 months (data not shown).
Figure 1 Characterization of QD-LC formulation.
Notes: TEM images showing QDs (A) before and (B) after lipid encapsulation. (C) Ultraviolet-visible absorbance and photoluminescence emission spectra of QDs (yellow line) and QD-LC (red line).
Abbreviations: PL, photoluminescence; QD, quantum dot; QD-LC, CdTe/CdS core/shell quantum dot–lipids complex; TEM, transmission electron microscopy.
QD-LC selectively killed cancer cells in a dose- and time-dependent manner
The MTT assay was used to evaluate the cell viability of human hepatocarcinoma HepG2 cells and human hepatic embryo HL-7702 cells after incubation with various concentrations of QD and QD-LC for 24 hours. As shown in , QD-LC significantly decreased cell viability of HepG2 cells when the concentration was more than 0.5 μM, and the killing effect of QD-LC was stronger than that of QDs. Interestingly, QD-LC, even at a concentration of 2 μM, had little influence on cell viability of HL-7702 cells, and an inhibitory rate of only 32.4% was observed at 4 μM. Moreover, we carried out a time-dependent study on 2 μM QDs or QD-LC. As depicted in , the cell viability of HepG2 significantly decreased with time. The reduction was 57% in 24 hours and 60% in 48 hours, whereas the cell viability of HL-7702 cells was affected less, with a reduction of 19% in 24 hours and 35% in 48 hours. In addition, transfection reagents had no intrinsic toxicity in either cell line. The difference in susceptibility to QD-LC in HepG2 and HL-7702 has attracted our attention.
Figure 2 Cell viability of QD-LC on hepatoma cell lines and normal cell lines.
Notes: MTT assay showing the viability of (A) human liver cancer HepG2 cells and (B) human normal liver HL-7702 cells after incubation with QDs or QD-LC in different concentrations (0.05–4 μM) for 24 hours. MTT assay showing the viability of (C) HepG2 cells and (D) HL-7702 cells after incubation with 2 μM QDs or QD-LC for different time intervals (6, 12, 24, or 48 hours). The data represent three separate experiments and are presented as mean values ± SD. *P<0.01 versus control group; #P<0.01 for QD versus QD-LC group. (E) MTT assay conducted in human hepatocarcinoma cell lines and normal cell lines treated with 2 μM QD-LC for 24 hours. The results are means ± SD from three independent experiments.
Abbreviations: HUVEC, human umbilical vein endothelial cell; L, lipids; MTT, 3-(4,5-dimethylthiazol-2-yl)-2,5-diphenyltetrazolium bromide; NRM, neonatal rat myocardium; QD, quantum dot; QD-LC, CdTe/CdS core/shell quantum dot–lipids complex; SD, standard deviation.
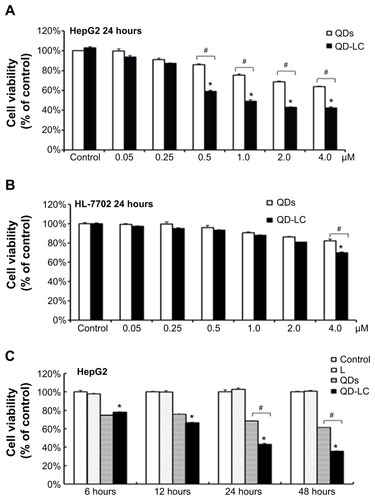
To further confirm the selectivity of QD-LC toward cancer cells, several human hepatocarcinoma cell lines, including Hep3B, Bel-7404, SMMC-7721, Huh-7, and Bel-7402, as well as mouse hepatocarcinoma H22 cells, were incubated with 2 μM QD-LC for 24 hours. Cell lines derived from normal cells, including the hepatic satellite cell line CFSC-2G, human cardiomyocyte line H9C2, primary cultured myocardiocytes (neonatal rat myocardium cells), and human umbilical vein endothelial cells, were used as normal cell controls, and all these tests were conducted under identical conditions. As depicted in , all tumor cell lines were more susceptible to QD-LC than the normal cell lines, according to the reduced ratios of cell viability. Thus, it is confirmed that QD-LC selectively killed the cancer cells, while the damage to normal cells was negligible.
Selective endocytosis in cancer cells
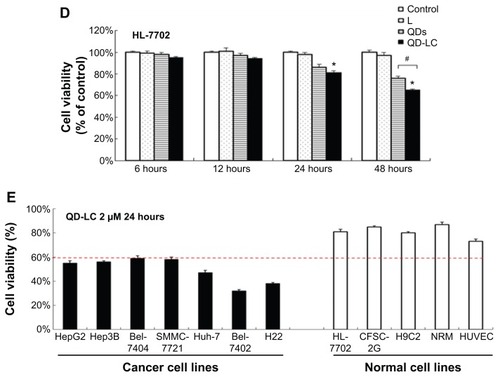
To elucidate the mechanisms for the selective toxicity in cancer cells, we chose HL-7702 cells as representative of the normal cell lines, and intracellular distribution and quantification of QD-LC in HepG2 and HL-7702 cells were analyzed. Cellular imaging via laser confocal microscopy was conducted after incubation with 2 μM QD-LC or QDs for 6 and 24 hours. As depicted in Figures S4 and S5, QD-LC and QDs emitted red in the cytoplasm or perinucleus under excitation at 405 nm. For HepG2 cells, the red fluorescence of QD-LC increased with time, and the internalization of QD-LC was much more than that of QDs after either 6 or 24 hours, whereas no significant difference was observed in HL-7702 cells. The fluorescence quantification was carried out by flow cytometry for the 24-hour treatment. As shown in , the average fluorescence intensity of HepG2 cells treated with QD-LC was significantly higher than that of HepG2 cells treated with QDs, suggesting that modifying QDs by adding a lipid coating would enhance their uptake by tumor cells. However, the average fluorescence intensity of HL-7702 cells treated with QD-LC was much lower than that of HepG2 cells, which is consistent with the distribution of cell imaging. Therefore, the QD-LC endocytosis capacity of the cell was intimately related to cytotoxicity in the hepatic cell lines.
Figure 3 Intracellular quantification of QD-LC in HepG2 and HL-7702 cells.
Notes: Fluorescence intensity of QDs or QD-LC in (A) HepG2 cells and (B) HL-7702 cells by FACS, using detecting channel 525-A. (C) Quantitative analysis of cellular uptake of QDs or QD-LC in HepG2 cells and HL-7702 cells. The data represent three separate experiments and are presented as mean values ± SD. **P<0.01 for mean fluorescence intensity of QDs versus QD-LC in HepG2 cells; #P<0.01 for mean fluorescence intensity of QD-LC in HepG2 cells versus in HL-7702 cells; ##P<0.01 for mean fluorescence intensity for HepG2 cells versus HL-7702 cells. (D) The endocytosis inhibition assay on HepG2 and HL-7702 cells. The data represent three separate experiments and are presented as mean values ± SD. *P<0.05 and #P<0.05 versus control group; &P<0.05 for HepG2 cells versus HL-7702 cells.
Abbreviations: FACS, fluorescence-activated cell sorting; QD, quantum dot; QD-LC, CdTe/CdS core/shell quantum dot–lipids complex; SD, standard deviation.
To further elucidate the cause of the differences in the uptake of QD-LC by the cancer cells and the normal cells, the endocytosis mechanisms in both cells were investigated. Several inhibitors targeting various cellular uptake pathways were utilized to block the energy-dependent endocytosis, ie, ATP-utilizing pathway, the clathrin-mediated pathway, the caveolae/lipid rafts pathway, the caveolae-mediated pathway, and the macropinocytosis pathway. The results indicated that the ATP-utilizing, the clathrin-mediated, and the macropinocytosis pathways were the main uptake pathways in the energy-dependent endocytosis of QD-LC. Interestingly, we found that the significant difference in uptake between the tumor cells and the normal cells was due to the macropinocytosis pathway (shown in ).
QD-LC-activated, reactive oxygen species-mediated JNK apoptosis pathway in HepG2 cells
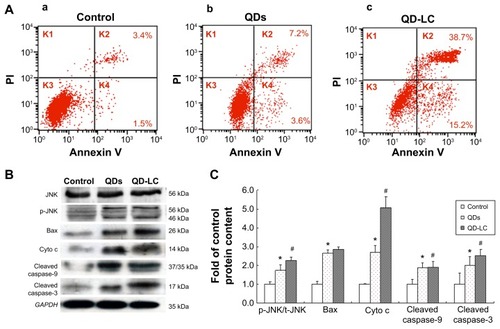
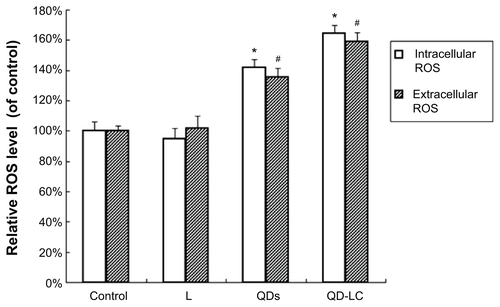
It has been documented that the intracellular uptake of CdTe/CdS QDs can disturb the oxidative balance of the cell and induce apoptosis through the release of cadmium ions. Therefore, the apoptotic rate was determined by flow cytometry, and the mechanism underlying QD-LC-induced apoptosis in HepG2 cells was investigated. As shown in , the apoptotic rate in HepG2 cells incubated with 2 μM QD-LC or QDs for 24 hours was 53.9%±5.9% and 10.8%±2.3%, respectively. Subsequently, the content of reactive oxygen species (ROS) in cell culture medium was determined. The ROS levels in the QD-LC group were more elevated compared to the QD group in cancer cells (Figure S6). Considering that ROS accumulation can induce cell cycle arrest and apoptosis through the activation of the JNK/mitochondrial apoptosis pathway in cancer cells, we detected the changes of JNK and key proteins in the intrinsic mitochondrial apoptosis signaling pathway. The results showed that the protein expression of p-JNK, Bax, cytochrome c, cleaved caspase-9, and cleaved caspase-3 were all increased (), indicating that QD-LC had the ability to activate the ROS-mediated JNK apoptosis pathway in HepG2 cells.
Figure 4 QD-LC-induced apoptosis in HepG2 cells and the activation of the apoptotic signal pathway.
Notes: (A) Apoptosis detection with annexin V–FITC/PI double staining by FACS analysis. Cells were cultured with QDs or QD-LC (2 μM for 24 hours). (a) Control, (b) QDs, and (c) QD-LC. (B) Determination of proteins in the apoptotic signal pathway by Western blot. (C) Quantitative analysis of the ratio of proteins. Values are presented as means ± SD of three determinations. *P<0.05 versus control group; #P<0.05 versus QDs group.
Abbreviations: Cyto c, cytochrome c; FACS, fluorescence-activated cell sorting; FITC, fluorescein isothiocyanate; K, quadrant; PI, propidium iodide; QD, quantum dot; QD-LC, CdTe/CdS core/shell quantum dot–lipids complex; SD, standard deviation.
Effect of QD-LC on inhibiting tumor formation and growth in vivo
To investigate the inhibitory effect of the QD-LC on tumor growth, both a microtumor formation model and a transplanted tumor model in nu/nu mice were employed. For the microtumor formation animal model, mouse hepatocarcinoma H22 cells were pretreated with or without 0.25 μM QD-LC for 6 hours in a flask before being injected subcutaneously into the right side of the dorsal flank of the mice at a total of 3×10⁵ cells for each mouse. Tumor volumes were measured every day and calculated by the formula length × widthCitation2 × 0.52. Microtumors (volume less than 60 mm3) developed in 60% of the mice in the control group after 3 days of inoculation, and a 100% rate of tumor growth existed in the control group after 4 days. However, there were no microtumors detected at 4 days in the QD-LC group, and only 20% of the mice were found to have developed microtumors after 5 days of inoculation, while 100% of the mice exhibited these tumors after 9 days (as shown in , Kaplan–Meier curves). Moreover, the average tumor weight in mice that were sacrificed 10 days after the incubation was 0.315±0.085 g in the control group, but only 0.102±0.023 g in the QD-LC pretreatment group (). There was a significant difference in tumor-free time (P=0.0023) between the control group and QD-LC group, indicating that QD-LC pretreatment delayed the latent period of tumor development.
Figure 5 In vivo monitoring of tumor formation of H22 liver cancer cells.
Notes: (A) Kaplan–Meier curves showing tumor-free mouse analysis using GraphPad Prism 4 software (GraphPad Software, Inc., La Jolla, CA, USA). (B) Tumor weight analysis at the end of the experiment. Data are presented as means ± SD, n=5, *P<0.01 versus control group. (C) Photograph of the dissected tumor tissues for each treatment group.
Abbreviations: QD-LC, CdTe/CdS core/shell quantum dot–lipids complex; SD, standard deviation.
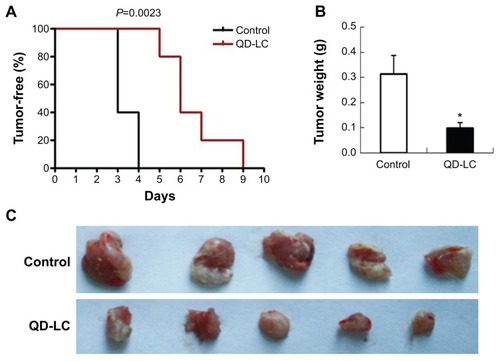
In the tumor transplant model, H22 cells (2×10⁶) were injected into the right side of the dorsal flank of the mice. When the tumor volume reached 100 mm3, 10 μL of 2 μM QD-LC PBS solution was injected once every 3 days into the center of the tumor in the QD-LC group, and 10 μL PBS solution was injected once every 3 days into each tumor in the control group. The tumor volume was measured every day, and the mice were sacrificed at 19 days after inoculation. As depicted in , the tumor volume was significantly decreased after 11 days in the QD-LC treatment group and a significant decrease in the final weight of the tumors was observed compared to the control group. The QD-LC suppressed tumor growth, with a 53.2% reduction in tumor weight. The average final weight of the tumors in the QD-LC treatment group was significantly lower than that of the control group (3.85±1.06 g versus 1.8±0.41 g). Interestingly, the fluorescence images of the removed tumors revealed that the fluorescence of the QD-LC covered 60% of tumor volume (), not the entire tumor, suggesting that it may be potentially useful as an optical imaging agent in cancer diagnoses.
Figure 6 QD-LC inhibited tumor growth and toxicity detection.
Notes: (A) Tumor volume curve. (B) Tumor weight analysis after treatment. Data are presented as means ± SD, n=6, *P<0.01 versus control group. (C) Representative images of excised tumors from treated mice under white or UV light. (D) Body weight curve. (E) Effect of functional enzymes ([a] ALT; [b] AST; [c] CRE; [d] BUN) in liver and kidney after QD-LC treatment (n=6). (F) Histological images from the major organs of the treated mice. Images were taken at ×40 magnification with standard HE staining.
Abbreviations: ALT, alanine aminotransferase; AST, aspartate aminotransferase; BUN, blood urea nitrogen; CRE, creatinine; HE, hematoxylin and eosin; QD-LC, CdTe/CdS core/shell quantum dot–lipids complex; SD, standard deviation; UV, ultraviolet.
![Figure 6 QD-LC inhibited tumor growth and toxicity detection.Notes: (A) Tumor volume curve. (B) Tumor weight analysis after treatment. Data are presented as means ± SD, n=6, *P<0.01 versus control group. (C) Representative images of excised tumors from treated mice under white or UV light. (D) Body weight curve. (E) Effect of functional enzymes ([a] ALT; [b] AST; [c] CRE; [d] BUN) in liver and kidney after QD-LC treatment (n=6). (F) Histological images from the major organs of the treated mice. Images were taken at ×40 magnification with standard HE staining.Abbreviations: ALT, alanine aminotransferase; AST, aspartate aminotransferase; BUN, blood urea nitrogen; CRE, creatinine; HE, hematoxylin and eosin; QD-LC, CdTe/CdS core/shell quantum dot–lipids complex; SD, standard deviation; UV, ultraviolet.](/cms/asset/1dd525da-2caf-417f-820a-463ac07fc0e8/dijn_a_73185_f0006_c.jpg)
Toxicological evaluation of the QD-LC in vivo
We performed a toxicological evaluation by comparing the effects of different treatments. The safety profiling included an assessment of the total body weight and blood chemistry and a histological examination of the major organs. Compared to saline-treated, tumor-bearing mice, no significant body weight changes were observed following the administration of the QD-LC (). Moreover, in the tumor transplant model, blood was collected at the end of the experiment. The levels of ALT, AST, BUN, and CRE in the serum were measured. The results showed that all the enzymes tested were not elevated compared to the control group (). In addition, the histological analysis of the tissues from five treated and control mice revealed that there were no observable pathological changes in the heart, lung, kidney, liver, or spleen. The hepatocytes in the liver were normal in both groups, and there were no signs of an inflammatory response. No pulmonary fibrosis was detected in the lung samples. The glomerulus structure in the kidney section was clearly identifiable, and necrosis was not observed in any of the histological sections ().
Discussion
The presence of systemic toxicity and the absence of cellular and/or organ targeting of antitumor agents are key factors limiting their widespread use in cancer chemotherapy. Recently, advances have been made in the employment of various nanoparticles as drug carriers, therapeutic agents, and imaging probes in cancer diagnosis. QDs have been used as an innovative fluorescence imaging probe for biomedical research and disease diagnosis, and, recently, their potential as antitumor agents has attracted more attention from researchers. The semiconductor nanocrystal core of QDs, however, generally contains toxic heavy metals, including Cd, Se, Te, and Hg, and their toxicities have caused safety concerns, severely limiting their use in biomedicine.Citation21–Citation23 To circumvent this concern, QDs are modified with polymeric coatings (polyethylene glycol, polyethylenimine) or other inorganic coatings, such as silica, to improve their biocompatibility and decrease toxicity. QDs functionalized by an antibody, nucleic acid, or folic acid may have even more enhanced active target delivery; however, nanomaterial-based therapy utilizing the intrinsic toxicity of nanomaterials has been explored. Various studies have found that the uptake of some nanomaterials can be controlled to induce cellular autophagy and/or cell death by ion leaching.Citation15,Citation35 It was, therefore, the aim of this study to modify CdTe/CdS QDs with lipids and to fine-tune the intracellular dose of these QDs to achieve the selective treatment of liver cancer in vivo and in vitro.
The determinative factor of QD toxicity is the dose that refers to the intracellular levels of QD rather than its concentration in the extracellular fluids. Chang et al have demonstrated that the “bare” CdS-capped CdSe QDs were more toxic than polyethylene glycol-substituted QDs to the human breast cancer cell line SK-BR-3 because the modification of the surface of QDs with polyethylene glycol decreased intracellular uptake of the QDs by endocytosis.Citation31 In the present study, we found that the quantity of QD-LCs taken up by the cell through endocytosis was intimately related to cytotoxicity in hepatic cell lines. We showed that QD-LC had enhanced uptake by the tumor cells. Our data showed that there was an unequivocal selective uptake of QD-LC by tumor cells compared with the normal cells, suggesting that tumor cells more favorably phagocytize QD-LC. As the lipid reagents in FuGENE® HD contribute to transfection and release contents into mammalian cell linesCitation36 and transfer into cancer cells more than normal cells,Citation37 the selective cancer cytotoxicity of QD-LC toward cancer cells might be due to different intracellular concentrations of QDs between the cancer and normal cells.
Furthermore, we found that the significant difference in uptake pathways between the tumor cells and the normal cells was the macropinocytosis pathway. Macropinocytosis has been most widely explored in immune cells, such as macrophages and dendritic cells, but is also upregulated in oncogene-expressing cells.Citation38–Citation40 Moreover, macropinocytosis serves as a key internalization pathway for intracellular delivery of various physiological, pathological, and therapeutic cargoes.Citation41 Reyes-Reyes et al showed that macropinocytosis was much more active in DU145 cancer cells than in the nonmalignant Hs27 cells and that amiloride pretreatment caused a reduction in FL-AS1411 uptake in DU145 cancer cells but only a slight increase in the nonmalignant Hs27 cells,Citation42 which is consistent with our results. Therefore, we suggest that macropinocytosis may be partially responsible for the difference in endocytosis capabilities in both cancer and normal cells, which subsequently results in the selective toxicity seen in the tumor cells. However, the possibility of enhanced uptake via the difference in the charge and fluidity of the plasma membrane or endocytosis receptors between the tumor and normal cells cannot be ruled out.
The production of ROS, such as superoxide, hydroxyl radicals, or peroxide radicals, can adversely affect cellular functions. At a high level of oxidative stress, the antioxidant defense system would be overwhelmed by the excessive ROS, which would eventually lead to mitochondrial dysfunction as well as apoptosis.Citation43,Citation44 The generation of ROS by cultured cells upon exposure to inorganic nanoparticles is a quite common phenomenon.Citation45–Citation47 In QDs, ROS can be induced by the reactivity of surface-located transition metals, the leaching of free Cd2+ ions, or the direct interaction of QDs with mitochondria.Citation48–Citation50 Our results show that the intracellular and extracellular ROS levels in HepG2 cells treated with QD-LC were significantly higher than those in the control HepG2 cells (without treatment of QD-LC). Our Western blot analysis indicated that the QD-LC treatment resulted in the overexpression of p-JNK, which would stimulate the release of cytochrome c and, subsequently, activate caspase-9 and caspase-3, which suggests that the QD-LC induced the activation of the intrinsic mitochondrial apoptosis signal pathway.
Our in vivo study showed that QD-LC treatment significantly delayed tumor development and suppressed tumor growth without any detrimental effect on functional enzymes in the liver and kidney or histopathology abnormalities in the major organs after intratumoral injection. It is clear from this study that there is a biosafety margin of QD-LC when employed as a plausible agent for tumor treatment. In addition, the accumulation of QD-LC in tumors could provide an alternative way to either label solid tumor cells or monitor their migratory patterns. It is entirely possible that this work may lead to the positive identification of well-localized solid tumors and aid in their early diagnosis and treatment in clinical situations. The metabolism of QD-LC and its degradation in both normal and cancer cells, however, would be an interesting topic for further investigation.
Conclusion
We have successfully prepared QD-LCs as cancer therapeutic nanoagents. It has been illustrated that QD-LC has distinct effects on cell viability, killing cancer cells while having little impact on normal cells. Our study demonstrated that the macropinocytotic uptake pathway determined the selective toxicity for the cancer cells, which induced intrinsic mitochondrial apoptosis by the activation of the ROS-mediated JNK signaling pathway. In vivo experiments with animal models indicated that the administration of QD-LC in a controlled dose prolonged the latent period of tumor development and significantly inhibited tumor growth without obvious toxicity. Our results provide a proof-of-concept for the intrinsic toxicity of QD-based cancer therapy strategies.
Supplementary materials
Figure S1 Cell viability of QD-LC on H22 cell lines at 6 and 24 hours.
Notes: The data represent three separate experiments and are presented as mean values ± SD. *P<0.05 versus control group.
Abbreviations: QD-LC, CdTe/CdS core/shell quantum dot–lipids complex; SD, standard deviation; T, transfection agent.
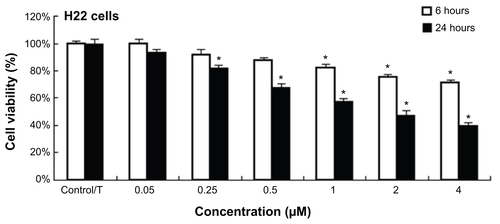
Figure S2 Characterization of QDs and QD-LC.
Notes: Average diameters, found by DLS, of QDs (A) and QD-LC (B). Zeta potentials of QDs (C), lipids (D), and QD-LC (E) were −40.4 mV, +34 mV, and −18.3 mV, respectively. These results indicated the conjugation of the QDs and lipids.
Abbreviations: DLS, dynamic light scattering; QD, quantum dot; QD-LC, CdTe/CdS core/shell quantum dot–lipids complex.
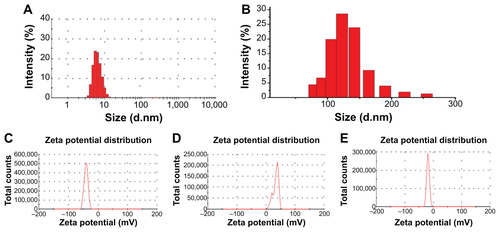
Figure S3 Energy-dispersive X-ray (EDX) spectroscopy analysis of CdTe/CdS core/shell quantum dot–lipids complex.
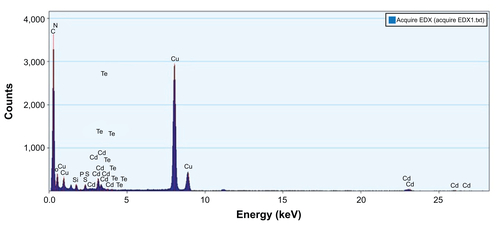
Figure S4 Intracellular distribution of QD-LC in HepG2 cells.
Notes: Confocal microscopy images of HepG2 cells after 24 hours’ incubation with different QD concentrations and different QD-LC concentrations (red). The cell nucleus is stained with Hoechst 33258 (blue). The scale bar represents 10 μm.
Abbreviations: QD, quantum dot; QD-LC, CdTe/CdS core/shell quantum dot–lipids complex.
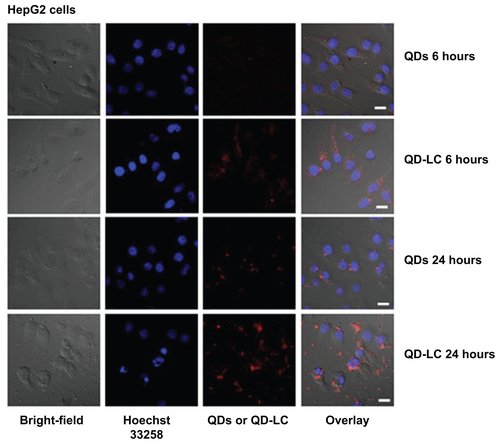
Figure S5 Intracellular distribution of QD-LC in HL-7702 cells.
Notes: Confocal microscopy images of HL-7702 cells after 24 hours’ incubation with different QD concentrations and different QD-LC concentrations (red). The cell nucleus is stained with Hoechst 33258 (blue). The scale bar represents 10 μm.
Abbreviations: QD, quantum dot; QD-LC, CdTe/CdS core/shell quantum dot–lipids complex.
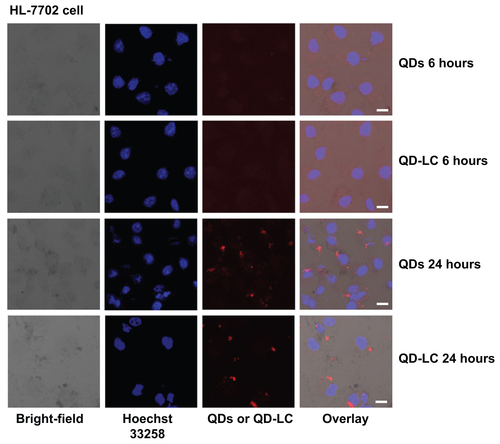
Figure S6 Comparative effects of QDs and QD-LC on intracellular and extracellular ROS generation in HepG2 cells.
Note: *P<0.05 and #P<0.05 versus control group.
Abbreviations: L, lipids; QD, quantum dot; QD-LC, CdTe/CdS core/shell quantum dot–lipids complex; ROS, reactive oxygen species.
Materials and methods
CdTe/CdS core/shell quantum dot–lipids complex fluorescence imaging in HepG2 cells by laser scanning confocal fluorescence microscopy
Quantum dots (QDs) and CdTe/CdS core/shell QD–lipids complex (QD-LC) were co-cultured with HepG2 and HL-7702 cells for 6 or 24 hours in a 24-well plate, then the cells were washed twice with chilled phosphate-buffered saline (PBS) and the nuclei were stained with Hoechst 33258 (5 mg mL−1) for 5 minutes. The QD intracellular location and cytotoxicity were observed, after washing twice, by confocal laser scanning microscopy. The confocal laser scanning microscopy was carried out using an Olympus FV1000 microscope (Olympus Corporation, Tokyo, Japan) equipped with multiline argon laser, 405, 488 nm, and 30 mW Laserclass 3D laser.
Determination of intracellular reactive oxygen species
HepG2 cells were cultured in a 24-well plate overnight and then treated with QDs or QD-LC for 24 hours. The culture medium was collected and ultra-centrifuged at 100,000 rpm for 20 minutes to provide the supernatant for analysis, while the cells were washed with chilled PBS twice. Then, the cells with 20 μL PBS solution were frozen at −80°C and thawed at 25°C three times to break the cells. Reactive oxygen species content was then analyzed using a reactive oxygen species detection kit.
Author contributions
Dan Shao and Jing Li contributed equally to this work; thus, both are co-first authors. All authors contributed toward data analysis, drafting, and revising the paper and agree to be accountable for all aspects of the work.
Acknowledgments
Professor Bai Yang, Professor Ming-zhu Sun, Professor Wen-fei Dong, Dr Fang-zhong Shen, Dr Ying-shuai Wang, Dr Qiong-shu Li, Dr Hai-jun Li, Dr Shu-ting Zuo, Dr Shuo Li, Dr Qi-hui Liu, Hai-yang Wang, Ou Li, Zheng Wang, Xin Zhang, and Hui-lin Zheng are acknowledged for their help in preparing this paper. This work was sponsored by the National Natural Science Foundation of China (81071886, 81201804), the Science and Technology Support Program of Jilin Province (201205006), the Graduate Innovation Fund of Jilin University (20121118), and the Opening Project of State Key Laboratory of Supramolecular Structure and Materials of Jilin University (grant numbers SKLSSM 200912 and SKLSSM 201317). Most of the experiments were carried out in the Nanomedicine Engineering Laboratory of Jilin Province and the Preclinical Pharmacology R&D Center of Jilin Province.
Disclosure
The authors report no conflicts of interest in this work. The authors alone are responsible for the content and writing of this paper.
References
- NieZPetukhovaAKumachevaEProperties and emerging applications of self-assembled structures made from inorganic nanoparticlesNat Nanotechnol20105152520032986
- ErathodiyilNYingJYFunctionalization of inorganic nanoparticles for bioimaging applicationsAcc Chem Res20114492593521648430
- XiaLKongXLiuXAn upconversion nanoparticle – zinc phthalocyanine based nanophotosensitizer for photodynamic therapyBiomaterials2014354146415624529625
- FadeelBGarcia-BennettAEBetter safe than sorry: understanding the toxicological properties of inorganic nanoparticles manufactured for biomedical applicationsAdv Drug Deliv Rev20106236237419900497
- KimJEShinJYChoMHMagnetic nanoparticles: an update of application for drug delivery and possible toxic effectsArch Toxicol20128668570022076106
- SoenenSJRivera-GilPMontenegroJMParakWJDe SmedtSCBraeckmansKCellular toxicity of inorganic nanoparticles: common aspects and guidelines for improved nanotoxicity evaluationNano Today20116446465
- LiuYZhaoYSunBChenCUnderstanding the toxicity of carbon nanotubesAcc Chem Res20134670271322999420
- WangLLiuYLiWSelective targeting of gold nanorods at the mitochondria of cancer cells: implications for cancer therapyNano Lett20111177278021186824
- DreadenECEl-SayedMADetecting and destroying cancer cells in more than one way with noble metals and different confinement properties on the nanoscaleAcc Chem Res2012451854186522546051
- ZhangYZhengFYangTTuning the autophagy-inducing activity of lanthanide-based nanocrystals through specific surface-coating peptidesNat Mater20121181782622797828
- AkhtarMJAhamedMKumarSKhanMMAhmadJAlrokayanSAZinc oxide nanoparticles selectively induce apoptosis in human cancer cells through reactive oxygen speciesInt J Nanomedicine2012784585722393286
- RasmussenJWMartinezELoukaPWingettDGZinc oxide nano-particles for selective destruction of tumor cells and potential for drug delivery applicationsExpert Opin Drug Deliv201071063107720716019
- SanpuiPChattopadhyayAGhoshSSInduction of apoptosis in cancer cells at low silver nanoparticle concentrations using chitosan nanocarrierACS Appl Mater Interfaces2011321822821280584
- PremanathanMKarthikeyanKJeyasubramanianKManivannanGSelective toxicity of ZnO nanoparticles toward Gram-positive bacteria and cancer cells by apoptosis through lipid peroxidationNanomedicine2011718419221034861
- SasidharanAChandranPMenonDRamanSNairSKoyakuttyMRapid dissolution of ZnO nanocrystals in acidic cancer microenvironment leading to preferential apoptosisNanoscale201133657366921826307
- MedintzILUyedaHTGoldmanERMattoussiHQuantum dot bioconjugates for imaging, labelling and sensingNat Mater2005443544615928695
- MichaletXPinaudFFBentolilaLAQuantum dots for live cells, in vivo imaging, and diagnosticsScience200530753854415681376
- HoYPLeongKWQuantum dot-based theranosticsNanoscale20102606820648364
- JamiesonTBakhshiRPetrovaDPocockRImaniMSeifalianAMBiological applications of quantum dotsBiomaterials2007284717473217686516
- ShaoDZengQFanZMonitoring HSV-TK/ganciclovir cancer suicide gene therapy using CdTe/CdS core/shell quantum dotsBiomaterials2012334336434422440046
- ChouLYChanWCNanotoxicology. No signs of illnessNat Nanotechnol2012741641722760019
- CliftMJStoneVQuantum dots: an insight and perspective of their biological interaction and how this relates to their relevance for clinical useTheranostics2012266868022896769
- TsoiKMDaiQAlmanBAChanWCAre quantum dots toxic? Exploring the discrepancy between cell culture and animal studiesAcc Chem Res20134666267122853558
- SinghSSharmaARobertsonGPRealizing the clinical potential of cancer nanotechnology by minimizing toxicologic and targeted delivery concernsCancer Res2012725663566823139207
- YeLYongKTLiuLA pilot study in non-human primates shows no adverse response to intravenous injection of quantum dotsNat Nanotechnol2012745345822609691
- YongKTSwihartMTIn vivo toxicity of quantum dots: no cause for concern?Nanomedicine (Lond)201271641164323210710
- SukhanovaAEven-DesrumeauxKKisserliAOriented conjugates of single-domain antibodies and quantum dots: toward a new generation of ultrasmall diagnostic nanoprobesNanomedicine2012851652521839049
- SavlaRTaratulaOGarbuzenkoOMinkoTTumor targeted quantum dot-mucin 1 aptamer-doxorubicin conjugate for imaging and treatment of cancerJ Control Release2011153162221342659
- YongKTRoyILawWCHuRSynthesis of cRGD-peptide conjugated near-infrared CdTe/ZnSe core-shell quantum dots for in vivo cancer targeting and imagingChem Commun (Camb)2010467136713820820500
- LiuLYongKTRoyIBioconjugated pluronic triblock-copolymer micelle-encapsulated quantum dots for targeted imaging of cancer: in vitro and in vivo studiesTheranostics2012270571322896772
- ChangEThekkekNYuWWColvinVLDrezekREvaluation of quantum dot cytotoxicity based on intracellular uptakeSmall200621412141717192996
- ZengQHKongXGSunYJSynthesis and optical properties of type IICdTe/CdS core/shell quantum dots in aqueous solution via successive ion layer adsorption and reactionJ Phys Chem C Nanomater Interfaces200811285878593
- IversenTGSkotlandTSandvigKEndocytosis and intracellular transport of nanoparticles: present knowledge and need for future studiesNano Today20116176185
- SahayGAlakhovaDYKabanovAVEndocytosis of nanomedicinesJ Control Release201014518219520226220
- AsharaniPVHandeMPValiyaveettilSAnti-proliferative activity of silver nanoparticlesBMC Cell Biol2009106519761582
- CalvinSCalvinJEWangJJacobsenLPitzSFuGENE® HD transfection reagent: choice of a transfection reagent with minimal off-target effect as analyzed by microarray transcriptional profilingNat Methods2006 Available from: http://www.nature.com/app_notes/nmeth/2006/061710/full/an2079.htmlAccessed November 10, 2014
- YamanoSDaiJMoursiAMComparison of transfection efficiency of nonviral gene transfer reagentsMol Biotechnol20104628730020585901
- LimJPGleesonPAMacropinocytosis: an endocytic pathway for internalising large gulpsImmunol Cell Biol20118983684321423264
- AmyereMMettlenMVan Der SmissenPOrigin, originality, functions, subversions and molecular signalling of macropinocytosisInt J Med Microbiol200229148749411890548
- CommissoCDavidsonSMSoydaner-AzelogluRGMacropinocytosis of protein is an amino acid supply route in Ras-transformed cellsNature201349763363723665962
- Redelman-SidiGIyerGSolitDBGlickmanMSOncogenic activation of Pak1-dependent pathway of macropinocytosis determines BCG entry into bladder cancer cellsCancer Res2013731156116723378476
- Reyes-ReyesEMTengYBatesPJA new paradigm for aptamer therapeutic AS1411 action: uptake by macropinocytosis and its stimulation by a nucleolin-dependent mechanismCancer Res2010708617862920861190
- SimonHUHaj-YehiaALevi-SchafferFRole of reactive oxygen species (ROS) in apoptosis inductionApoptosis2000541541811256882
- RajLIdeTGurkarAUSelective killing of cancer cells by a small molecule targeting the stress response to ROSNature201147523123421753854
- NelAXiaTMädlerLLiNToxic potential of materials at the nano-levelScience200631162262716456071
- HuangDMHsiaoJKChenYCThe promotion of human mesenchymal stem cell proliferation by superparamagnetic iron oxide nanoparticlesBiomaterials2009303645365119359036
- KhanMIMohammadAPatilGNaqviSAChauhanLKAhmadIInduction of ROS, mitochondrial damage and autophagy in lung epithelial cancer cells by iron oxide nanoparticlesBiomaterials2012331477148822098780
- KaufferFAMerlinCBalanLSchneiderRIncidence of the core composition on the stability, the ROS production and the toxicity of CdSe quantum dotsJ Hazard Mater201426824625524509095
- SinghBRSinghBNKhanWSinghHBNaqviAHROS-mediated apoptotic cell death in prostate cancer LNCaP cells induced by biosurfactant stabilized CdS quantum dotsBiomaterials2012335753576722594971
- NguyenKCWillmoreWGTayabaliAFCadmium telluride quantum dots cause oxidative stress leading to extrinsic and intrinsic apoptosis in hepatocellular carcinoma HepG2 cellsToxicology201330611412323485651