72
Views
0
CrossRef citations to date
0
Altmetric
CORRIGENDUM

Experimental Validation of Novel Glypican 3 Exosomes for the Detection of Hepatocellular Carcinoma in Liver Cirrhosis [Corrigendum]

Pages 853-854 | Received 16 Aug 2022, Accepted 16 Aug 2022, Published online: 29 Aug 2022
This article refers to:
Experimental Validation of Novel Glypican 3 Exosomes for the Detection of Hepatocellular Carcinoma in Liver Cirrhosis

Aydin Y, Koksal AR, Thevenot P, et al. J Hepatocell Carcinoma. 2020;15:1771–1786.

The authors have advised due to an error that occurred inadvertently at the time of figure assembly, Figure 3 on page 1587 is incorrect. The high magnification images of Huh-7.5 and HLE should be interchanged.

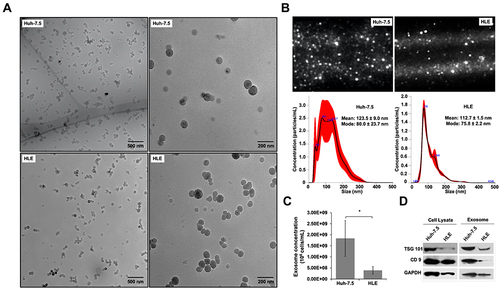
The correct is shown below.

Figure 3 Characterization of exosomes released from an autophagy-deficient and an autophagy-competent HCC cell line. (A) Cryogenic transmission electron microscopy (cryoTEM) images of exosomes purified from culture supernatants of autophagy-deficient (Huh-7.5) and autophagy-competent (HLE) HCC lines. Left panel (low magnification). Right panel (high magnification). (B) Top panel: Representative image of exosome Brownian motion in liquid phase using Nanoparticle tracking analysis (NTA). Bottom panel: Size distribution profile of exosomes with mean and mode of the population diameter ± standard error. (C) Exosome concentration in the culture supernatant quantified by NTA. The results are expressed as the mean ± standard deviation and analyzed by Student’s t-test. *P < 0.05. (D) Representative Western blot for TSG101 and CD9 in cell lysates and exosomes isolated from autophagy-deficient Huh-7.5 and autophagy-competent HLE cell cultures. All experiments were performed in triplicate.

Figure 3 Characterization of exosomes released from an autophagy-deficient and an autophagy-competent HCC cell line. (A) Cryogenic transmission electron microscopy (cryoTEM) images of exosomes purified from culture supernatants of autophagy-deficient (Huh-7.5) and autophagy-competent (HLE) HCC lines. Left panel (low magnification). Right panel (high magnification). (B) Top panel: Representative image of exosome Brownian motion in liquid phase using Nanoparticle tracking analysis (NTA). Bottom panel: Size distribution profile of exosomes with mean and mode of the population diameter ± standard error. (C) Exosome concentration in the culture supernatant quantified by NTA. The results are expressed as the mean ± standard deviation and analyzed by Student’s t-test. *P < 0.05. (D) Representative Western blot for TSG101 and CD9 in cell lysates and exosomes isolated from autophagy-deficient Huh-7.5 and autophagy-competent HLE cell cultures. All experiments were performed in triplicate.

The authors apologize for the error and advise it does not affect the results and conclusion of the paper.