
Abstract
Purpose
Hepatocellular carcinoma has become one of the severe diseases threatening human health. T cell exhaustion is deemed as a reason for immunotherapy resistance. However, little is known about the roles of CD8 Tex-related lncRNAs in HCC.
Materials and Methods
We processed single-cell RNA sequencing to identify CD8 Tex-related genes. CD8 Tex-related lncRNAs were identified based on their correlations with mRNAs. Unsupervised clustering approach was used to identify molecular clusters of CD8 Tex-related lncRNAs. Differences in prognosis and immune infiltration between the clusters were explored. Machine learning algorithms were used to construct a prognostic signature. Samples were classified as low- and high-risk groups based on their risk scores. We identified prognosis-related lncRNAs and constructed a ceRNA network. In vitro experiments were conducted to investigate the impacts of CD8 Tex-related lncRNAs on proliferation and apoptosis of HCC cells.
Results
We clarified cell types within two HCC single-cell datasets. We identified specific markers of CD8 Tex cells and analyzed their potential functions. Twenty-eight lncRNAs were identified as CD8 Tex-related. Based on CD8 Tex-related lncRNAs, samples were categorized into two distinct clusters, which exhibited significant differences in survival rates and immune infiltration. Ninety-six algorithm combinations were employed to establish a prognostic signature. RSF emerged as the one with the highest C-index. Patients in high- and low-risk groups exhibited marked differences in prognosis, enriched pathways, mutations and drug sensitivities. MCM3AP-AS1, MAPKAPK5-AS1 and PART1 were regarded as prognosis-related lncRNAs. A ceRNA network was constructed based on CD8 Tex-related lncRNAs and mRNAs. Experiments on cell lines and organoids indicated that downregulation of MCM3AP-AS1, MAPKAPK5-AS1 and PART1 suppressed cell proliferation and induced apoptosis.
Conclusion
CD8 Tex-related lncRNAs played crucial roles in HCC progression. Our findings provided new insights into the regulatory mechanisms of CD8 Tex-related lncRNAs in HCC.
As one of the most common types of primary malignant tumors in digestive system, liver and intrahepatic bile duct cancer are estimated to account for approximately 41,210 new cases and 29,380 deaths in the United States in 2023.Citation1 Hepatocellular carcinoma (HCC), which is predominantly seen in men, comprises approximately 80% of the cases. It is reported that incidence of liver cancer has stabilized between 2015 and 2019.Citation1 However, mortality of liver cancer has increased rapidly over the past few decades. Systemic therapy is the preferred treatment modality for patients with advanced stage HCC who are not suitable for local therapy.Citation2 Immune checkpoint inhibitors (ICIs) have proven to be safe and effective. Anti-PD1, anti-PDL1 and anti-VEGF have been approved by the FDA for advanced HCC.Citation3 Currently, ICI-based therapies are being explored across all stages of HCC, from neoadjuvant and adjuvant therapies for early HCC, over combinations with local therapies in intermediate stage disease, to advanced HCC.Citation4
T cell exhaustion (Tex) is defined as a broad term describing the dysfunctional response of T cells to chronic antigen stimulation.Citation5 This concept was first applied in the context of chronic viral infection but now in response to tumors.Citation6 By blocking the surface co-inhibitory receptors of CD8 Tex, cytolytic cell-mediated immune responses could be reinvigorated, potentially leading to the eradication of some persistent viruses.Citation7 CD8 Tex is also found to be hyporesponsive and dysfunctional in anti-tumor immune response.Citation8 The activated and exhausted status of CD8 T cells maintain homeostasis in the tumor immune microenvironment (TIME).Citation8,Citation9 Therefore, CD8 Tex cells are critical components of TIME, and they could affect the progression and prognosis of HCC.Citation10,Citation11 Identifying sensitive markers of CD8 Tex cells may help us gain more insight into TIME and discover novel disease targets.
Long non-coding RNA (lncRNA) is a type of RNA molecule exceeding 200 nucleotides in length.Citation12,Citation13 They are similar to mRNA in transcripts but without protein-coding capacity.Citation14 LncRNAs have been proven to play crucial roles in nearly all stages of HCC, including cell proliferation, differentiation, invasion, metastasis and drug sensitivity.Citation15–19 Given their vital functions, the expression of specific dysregulated lncRNAs has the potential to serve as diagnostic and therapeutic biomarkers.Citation20,Citation21 Therefore, lncRNA-based signature could be harnessed to influence therapeutic strategy of HCC.
Single-cell RNA sequencing (scRNA-seq) technology is a valuable tool for uncovering the expression profiles of individual cell and analyzing the TIME.Citation22 It enables us to identify rare and previously undetected cell types within tissues.Citation23 In this study, we aimed to investigate the expression of CD8 Tex-related genes in HCC using scRNA-seq. We established a CD8 Tex-related lncRNA signature to validate classification of HCC using machine learning techniques. Subsequently, we explored the potential of this CD8 Tex-related lncRNA signature to predict prognosis, immunological features and drug sensitivity in HCC.
Materials and Methods
Data Collection
Two scRNA-seq datasets, GSE125449 and GSE140228, were acquired from the Gene Expression Omnibus (GEO, http://www.ncbi.nlm.nih.gov/geo/) database. GSE125449 comprised 3834 cells from 9 patients, while GSE140228 contained 7074 cells from 6 patients, respectively.Citation24,Citation25 Clinical information of the 15 patients was summarized in Supplementary Table 1. Gene expression RNA-seq and follow-up data were obtained from The Cancer Genome Atlas (TCGA, https://portal.gdc.cancer.gov/), and it was regarded as training cohort. GSE14520 and GSE40144 cohorts were used as validation cohorts. Inclusion criteria were as following. First, patients were diagnosed with primary HCC. Second, patients had not undergone any preoperative radiotherapy or chemotherapy. Finally, complete mRNA and lncRNA expression could be obtained. Somatic mutation data was downloaded from UCSC Xena database (https://xenabrowser.net).
Landscape of scRNA-Seq Data and Identification of CD8 Tex-Related Genes
Two scRNA-seq cohorts of HCC were independently analyzed in R (version 4.1.0). Package “Seurat” was used for quality control and further analysis. Genes expressed in less than 3 cells and cells expressing fewer than 200 genes were excluded. PercentageFeatureSet function was applied to calculate the percentage of mitochondrial genes, and cells with a mitochondrial proportion exceeding 20% were removed due to low quality or extensive mitochondrial contamination. The total transcripts per single-cell were normalized to 10,000, followed by log transformation. Using FindVariableFeatures function, we identified the top 2000 features for each single-cell dataset, which varied among cells. ScaleData function was then employed to scale the expression levels of genes. Principal component analysis (PCA) was performed to obtain linear dimensional reduction using RunPCA function. JackStrawPlot and ElbowPlot functions were utilized to determine the optimal number of principal components (PCs) for downstream analyses. Cells were clustered using FindClusters function. RunTSNE function was used to reduce dimension and visualize clusters. FindAllMarkers function was used to identify specific biomarkers of different clusters. We set the parameters “only.pos = TURE” and “min.pct = 0.25” to select highly expressed markers. Clusters in the single-cell dataset were annotated based on known marker genes and corresponding original articles. CD8 Tex-related genes were identified using FindAllMarkers function. Intersection of the marker genes discovered in both cohorts was considered as CD8 Tex-related genes.
CD8 Tex-Related Score of Cell Types
After CD8 Tex-related genes identified, we calculated CD8 Tex-related score for each cell using five distinct algorithms, including AUCell, AddModuleScore, PercentageFeatureSet, single sample gene set enrichment (ssGSEA), and gene set variation analysis (GSVA). Subsequently, we compared CD8 Tex-related scores across different cell types to gain insights into their relative expression patterns.
Protein–Protein Interaction
After acquiring CD8 Tex-related genes, we delved into protein–protein interaction (PPI) analysis using the STRING database (https://cn.string-db.org/), which contained a comprehensive collection of PPI data.Citation26 Based on the results, we constructed a PPI network to visualize and analyze the interactions between these genes’ protein products.
Functional Enrichment Analysis
We conducted functional enrichment analysis using “clusterProfiler” R package to explore Gene Ontology (GO) and Kyoto Encyclopedia of Genes and Genomes (KEGG) pathways associated with CD8 Tex-related genes.Citation27,Citation28 Cellular component (CC), molecular function (MF) and biological process (BP) categories were explored in GO analysis. We performed GO and KEGG analyses to illustrate the function of CD8 Tex-related genes. Additionally, we performed enrichment analysis via Metascape (https://metascape.org/) to further illustrate the functions of CD8 Tex-related genes.Citation29
CD8 Tex-Related lncRNAs Selection
Due to the varying nomenclature across different platforms, we first gained the overlapping lncRNA species from TCGA-LIHC, GSE14520 and GSE40144 datasets. CD8 Tex-related lncRNAs were selected based on their co-expression and correlation with CD8 Tex-related mRNAs. The criteria for determining CD8 Tex-related lncRNAs were P<0.00,001 and absolute value of coefficient >0.3.
Cluster Analysis
On the basis of CD8 Tex-related lncRNA expression profiles, we performed consensus cluster analysis to identify molecular clusters.Citation30 We utilized “kmeans” function from “cluster” package to determine the optimal number of clusters. Survival analysis was carried out to compare prognostic difference between the various clusters.
Single Sample Gene Set Enrichment Analysis and Immune Cell Infiltration
After CD8 Tex-related lncRNAs acquired, we conducted the single ssGSEA. The prognostic significance of ssGSEA score in HCC was evaluated. To calculate the abundance of tumor-infiltrating immune cells in samples, we employed cell-type identification by Estimating Relative Subsets of RNA Transcripts (CIBERSORT, https://cibersort.stanford.edu/) algorithm.Citation31 Additionally, we utilized various algorithms, including Estimation of Stromal and Immune Cells in Malignant Tumors Tissues using Expression data (ESTIMATE, https://bioinformatics.mdanderson.org/estimate/index.html),Citation32 Tumor Immune Estimation Resource (TIMER, http://timer.comp-genomics.org/),Citation33 quanTIseq (http://icbi.at/quantiseq),Citation34 MCP-counter (http://github.com/ebecht/MCPcounter),Citation35 XCELL (http://xCell.ucsf.edu/)Citation36 and EPIC (http://epic.gfellerlab.org),Citation37 to predict the infiltrated T cell fractions. The impact of ssGSEA score on T cell fraction predictions was further explored.
Development and Validation of CD8 Tex-Related lncRNA Prognostic Signature
After CD8 Tex-related lncRNAs obtained, overall survival time (OS) and survival status of patients were integrated by 10 machine learning algorithms and 96 algorithm combinations in total. In this study, the algorithms employed included random survival forest (RSF), survival support vector machine (survival-SVM), ridge, elastic net (Enet), the least absolute shrinkage and selection operator (LASSO), supervised principal components (SuperPC), generalized boosted regression modelling (GBM), partial least squares regression for Cox (plsRcox), CoxBoost and stepwise Cox. Five of these algorithms had a variable filtering function, including RSF, LASSO, CoxBoost, backward stepwise Cox, and both stepwise Cox regression. We applied 96 algorithm combinations to the CD8 Tex-related lncRNAs to fit predictive models. The dataset with the largest sample size, TCGA-LIHC, served as the training cohort. All models were then tested on GSE14520 and GSE40144 datasets, which were considered validation cohorts. Subsequently, the Harrell’s concordance index (C-index) of all datasets was calculated. The model with the highest average C-index was deemed the optimal one. Risk score of each case was calculated using the best model. Samples were classified into different groups based on their risk scores. Disease-free survival time (DFS) and recurrent status were also collected. We further validated the efficacy of the signature in predicting recurrence risk.
Construction of Competing Endogenous RNA Network
Competing endogenous RNA (ceRNA) represented a regulatory mechanism within biological systems, where diverse RNAs compete to bind with miRNAs. As a consequence, ceRNAs affected gene expression and potentially influenced various biological processes. In this study, we identified CD8 Tex-related mRNAs and lncRNAs that have the potential to bind a common miRNA. Package “multiMIR” was used to explore the mRNA–miRNA interaction. We analyzed validated data from 3 databases: miRecords (http://mirecords.biolead.org/), miRTarBase (http://mirtarbase.mbc.nctu.edu.tw/index.html/) and Tarbase (http://microrna.gr/tarbase/). We selectively included only those interactions that have been validated using a dual-luciferase reporter gene system. We further anticipated lncRNA-miRNA interactions by consulting ENCORI database (https://rnasysu.com/encori/). We identified the shared miRNAs between the two sets of interactions. Finally, a CD8 Tex-related ceRNA network was constructed based on these findings.
Pathway Enrichment Analysis and Genetic Mutation Analysis
To investigate the pathways primarily enriched in the groups, we utilized the hallmark gene sets from Molecular Signatures Database (MSigDB).Citation38 Somatic mutation variants of samples in TCGA cohort were acquired. Mutation Annotation Format (MAF) was analyzed using “maftools” package.Citation39 Gene mutation was visually presented in a waterfall plot, arranged in descending order based on their frequencies. Tumor mutation burden (TMB) was defined as the numbers of mutations detected per million bases.
Potential Therapeutic Drug Sensitivity Estimation
To assess the potential therapeutic drugs, “pRRophetic” package was employed to calculate the half-maximal inhibitory concentration (IC50) of each patient.Citation40 Generally speaking, lower IC50 values meant higher drug sensitivities. We identified potentially sensitive drugs for different HCC subtypes based on these IC50 values. Differentially expressed genes (DEGs) between different risk groups were identified using “limma” package.Citation41 The threshold for p-value was set at 0.05, while the absolute value of log2 fold change was set as 1.0. Subsequently, we explored potential drugs of HCC in L1000 Fireworks Display (L1000FWD, http://amp.pharm.mssm.edu/L1000FWD),Citation42 the Drug Gene Interaction Database (DGIdb, http://www.dgidb.org),Citation43 and the Connectivity Map (CMap, https://portals.broadinstitute.org/cmap/).Citation44 For CMap, we utilized the SPIEDw web tool (http://www.spied.org.uk/) to interrogate the database.Citation45 Drug structure was searched in DrugBank database (https://go.drugbank.com/).Citation46
Cell Culture
Four human HCC cell lines (HepG2, HuH-7, HepG2.2.15 and PLC5) and a normal hepatic cell line (L02) used in this study were purchased from Procell (Wuhan, China). HepG2, HuH-7, HepG2.2.15 and PLC5 cells were all cultured in RPMI-1640 medium (Gibco, NY, USA) supplemented with 10% fetal bovine serum (FBS, Gibco, NY, USA) in a 5% CO2 atmosphere at 37 °C. Meanwhile, L02 cells were cultured in DMEM (Gibco, NY, USA) under similar conditions.
Reverse Transcription Quantitative PCR
Total RNA samples were isolated from HCC tissues and cell lines using TRIzol reagent (Applygen, Beijing, China) according to the instructions. For reverse transcription quantitative PCR (RT-qPCR), complementary DNA (cDNA) was synthesized from RNA samples using TruScript Reverse Transcriptase and Kits (Norgen Biotek). Quantitative analysis of lncRNA expressions was then carried out using SYBR Premix Ex Taq II (Takara, Tokyo, Japan). The relative lncRNA expressions were calculated using the 2−ΔΔCT method with GAPDH serving as an endogenous control.
Transient Transfection of Cell Lines with siRNA
In this study, siRNAs were designed and synthesized by RiboBio (Guangzhou, China). siRNAs were transfected into the cells using DharmaFECT4 (thermos scientific, USA) in accordance with the provided instructions. Eight hours post-transfection, fresh complete medium was added to the cultures. Forty-eight hours after transfection, RT-qPCR was performed to assess the efficiencies of gene silencing.
Cell Counting Kit-8 and Colony Formation Assays
We conducted Cell Counting Kit-8 (CCK-8) and plate colony formation assays to test cell proliferation in vitro. Human HCC cell lines were obtained during the logarithmic growth phase. Cells were seeded into 96-well plates at a density of approximately 2000 cells per well in 100μL of culture media. The plates were incubated at 37°C and 5% CO2 for 96 hours. At 0, 24, 48, 72, and 96 h, 10μL of CCK-8 reagent (APExBIO) was added to each well. After incubation for 2 hours, the absorbance/optical density (OD) value of each well at 450 nm was measured.
For the colony formation assay, single-cell suspensions of cell lines were prepared and seeded into a 6-well plate (500 cells per well). These were incubated at 37°C incubator in a 5% CO2 atmosphere. Once visible colonies appeared, cultures were terminated, and cells were fixed with 4% paraformaldehyde (Maokang Biotechnology Co., Ltd, Shanghai, China) for 30 minutes. Subsequently, they were stained with 0.1% crystal violet for 30 minutes and counted.
Cell Migration and Invasion Assays
We performed cell migration and invasion assays according to the instructions (Corning, 3422). Cells were collected, centrifuged, and resuspended in serum-free DMEM (Gibco, NY, USA). For migration assays, a cell suspension containing 5*104 cells was pipetted into the upper chamber of the Transwell insert. For invasion assays, the same volume of cell suspension was pipetted into the Matrigel-coated upper chamber. DMEM media supplemented with 10% FBS was added to the lower chamber. The Transwell plate was then placed in a cell culture incubator and incubated for 24 hours. Finally, the migrated or invaded cells were fixed with 4% paraformaldehyde for 20 minutes and stained with crystal violet for 20 minutes.
Wound Healing Assay
Cells were seeded in 6-well plates at a density of 5*105 cells per well and incubated overnight in cell culture medium at 37°C. An artificial wound was created using a P200 pipette tip, and the detached cells and fragments were thoroughly washed away with PBS. After incubating for 12 hours, images of cell migration near the wound were captured using a microscope.
Flow Cytometric Analysis of Apoptosis and Cell Cycle
Cells in logarithmic growth phase were collected, digested and suspended in cold PBS, followed by a transfer to binding buffer. To analyze apoptosis, cell suspensions were incubated with 5 µL of annexin V-FITC (KeyGen Biotech, China) and 10 µL PI (KeyGen Biotech, China) in the dark for 15 minutes at room temperature. Apoptosis was subsequently detected using a FACSCalibur instrument (BD Biosciences).
To analyze the cell cycle, cell suspensions were fixed overnight with 70% ethanol at 4°C. After centrifuging the fixed cells, they were incubated in propidium iodide (PI) in the dark for 30 minutes at room temperature. Cell cycle was analyzed using a FACSCalibur instrument (BD Biosciences).
Organoid Culture and Growth Assay
This study followed the ethical guidelines of the Declaration of Helsinki. All patients or their immediate family members wrote an informed consent form before taking part in any study procedure. Hepatocellular carcinoma tissue was sheared and digested in DMEM (Gibco, NY, USA) supplemented with IV collagenase (Sigma, Germany; 1 mg/mL) at 37°C for 15 minutes. PBS was added to terminate the digestion. After centrifuging and filtering, tissue was further embedded in Cultrex Reduced Growth Factor Basement Membrane Extract (Trevigen, USA) and cultured in human hepatocellular carcinoma basal medium (Biozellen, USA), comprising advanced DMEM/F12 medium, N21-MAX supplement, N2-MAX supplement, glutamine, nicotinamide, HEPES, A83-01, N-acetylcysteine, FGF-10, BMP7, EGF, HGF, Noggin, Wnt-3α, R-Spondin 1, Gastrin I, Forskolin and Y-27632. The mixture of organoid and medium was placed in a 24-well cell incubator for 3 days. Cultrex Organoids Harvesting Solution (3700–100-01, R&D Systems, USA) was added to recover and passage the organoids.
The organoid was cultured in proliferation medium (Biozellen, USA), consisting of advanced DMEM/F12 medium, N21-MAX supplement, N2-MAX supplement, glutamine, nicotinamide, HEPES, A83-01, N-acetylcysteine, FGF-10, BMP7, EGF, HGF, R-Spondin 1, Gastrin I and Forskolin. Growth of organoid was observed under a microscope. For passaging, the organoid was digested using Cultrex Organoids Harvesting Solution (3700–100-01, R&D Systems, USA). After the matrix degeneration, the sample was centrifuged (1000 rpm, 5 minutes) and washed with PBS. The precipitated cells were subsequently cultured in proliferation medium (Biozellen, USA). We first treated the organoids into single cells to transfect. The procedures for transfecting siRNAs into organoids are similar to those used in cell lines. Single cells from the organoids were collected to verify the transfection effects and culture the organoids.
Immunofluorescence Staining
The organoids were stored in PBS and fixed in 4% paraformaldehyde (Maokang Biotechnology Co., Ltd, Shanghai, China) at 4°C for 60 minutes. They were then blocked with 5% bovine serum albumin (BSA) for 60 minutes at room temperature. Subsequently, the organoids were incubated for 3 hours at room temperature and settled under gravity. To investigate the proliferative ability of the organoids, we focused on the expression of Ki67 within them. The samples were incubated with anti-Ki67 antibody (1:250; Abcam, Cambridge, MA, USA) at 4°C for 60 minutes, followed by overnight incubation at 4°C. After washed with PBS, they were incubated with Goat Anti-Human IgA-FITC Conjugated antibody (BSZH Scientific Inc., Beijing, China) at 37°C for 30 minutes. Nuclei were counterstained with DAPI for 15 minutes. Finally, the samples were viewed and analyzed under a fluorescence microscope.
Statistical Analysis
Continuous variables were analyzed using the t test, and categorical variables were compared through the chi-square test. Pearson’s correlation was used to assess correlations between continuous variables. The optimal cut-off value was determined by survminer package. Kaplan–Meier curves of OS and DFS were plotted with the aid of survival package, with Log rank test for estimating survival difference. P < 0.05 was considered statistically significant for all analyses. All statistical processes were conducted using R 4.1.0 software.
Results
ScRNA-Seq Landscape in HCC and Identification of Marker Genes of CD8 Tex Cells
For GSE125449 dataset, overall cellular composition among these samples does not change after the filtering steps (Supplementary Figure 1A and B). After data normalization, the top 2000 variable features were found for downstream analysis (Supplementary Figure 1C). Data was reduced to 12 principal components (Supplementary Figure 1D and E). The data dimensionality was determined using JackStraw and ElbowPlot methods (Supplementary Figure 1F and G). Fifteen clusters were identified and visualized by the T-distributed stochastic neighbor embedding (t-SNE) method (). The top 10 marker genes of each cluster were obtained (Supplementary Table 2). Based on the previous reports and marker genes, cells were classified into eight different types, including malignant cell, monocyte/macrophage, B cell, plasma cell, endothelial cell, CD8 Tex cell, fibroblast and hepatic progenitor cell ().Citation24
Figure 1 Single-cell landscape of HCC in GSE125449 and GSE140228 cohorts. (A) Fifteen clusters were identified by t-SNE methods in GSE125449 cohort. (B) Cell type annotation in GSE125449 cohort. (C) AUCell scores of different cell clusters in GSE125449 cohort. (D) Feature plot of AUCell scores in GSE125449 cohort. (E) Twenty-one clusters were identified by t-SNE methods in GSE140228 cohort. (F) Cell type annotation in GSE140228 cohort. (G) AUCell scores of different cell clusters in GSE140228 cohort. (H) Feature plot of AUCell scores in GSE140228 cohort. **** P < 0.0001.
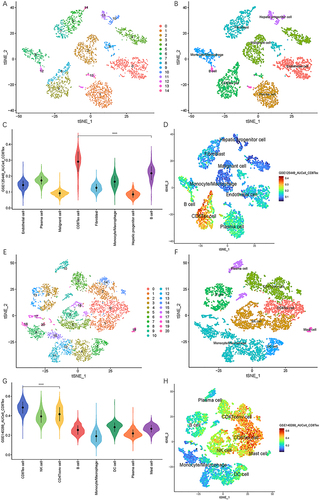
A similar procedure was carried out in GSE140228 cohort.Citation25 We successively conducted quality control, normalization, variable features identification, data scaling, linear dimensional reduction, and dimensionality determination (Supplementary Figure 2A-G). Afterwards, 21 clusters and 8 different types of cells were identified (Supplementary Table 2, and ).
Finally, 42 and 782 CD8 Tex cells were annotated, respectively. Significant marker genes for each cluster and cell type in GSE125449 and GSE140228 were identified (Supplementary Table 3, Supplementary Figure 3A and B). We intersected the marker genes of CD8 Tex cells from both datasets and deemed them as CD8 Tex-related genes (Supplementary Figure 3C, Supplementary Table 4).
We further calculated CD8 Tex-related score for each cell using five algorithms, including AUCell, AddModuleScore, PercentageFeatureSet, ssGSEA and GSVA. The results indicated that AUCell scores in CD8 Tex cells were significantly higher than those in other cell types (). We observed similar outcomes with the other 4 algorithms (Supplementary Figure 4A-H and Supplementary Figure 5A-H). Specifically, the enrichment scores in CD8 Tex cells were significantly higher than those in other cell types.
PPI Network and Functional Enrichment Analyses of CD8 Tex-Related Genes
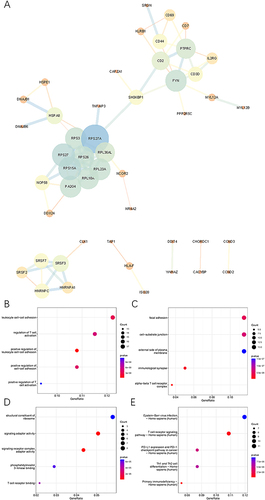
To gain deeper insights into the potential action mechanism of CD8 Tex-related genes, a PPI network was constructed through STRING database (). GO enrichment analysis showed that enriched BP terms were associated with leukocyte cell–cell adhesion, regulation of T cell activation, positive regulation of leukocyte cell–cell adhesion, positive regulation of cell–cell adhesion and positive regulation of T cell activation (). CC terms were related to focal adhesion, cell-substrate junction, external side of plasma membrane, immunological synapse and alpha-beta T cell receptor complex (). The significant enrichment of MF terms encompassed structural constituent of ribosome, signaling adaptor activity, signaling receptor complex adaptor activity, phosphatidylinositol 3-kinase binding and T cell receptor binding (). The KEGG enrichment analyses identified EB virus infection, T cell receptor signaling pathway, PD-L1 expression and PD-1 checkpoint pathway in cancer, Th1 and Th2 cell differentiation and primary immunodeficiency (). GO enrichment analysis through Metascape indicated that CD8 Tex-related genes were mainly enriched in immune system process, multicellular organismal process and positive regulation of biological process. These genes were significantly related to lymphopenia, lupus erythematosus and combined immunodeficiency, and they were enriched in thymus, spleen and MOLT4 cells (Supplementary Figure 6A-C).
Figure 2 Functional enrichment of CD8 Tex-related genes. (A) PPI network of CD8 Tex-related genes. (B–D) GO enrichment analyses of CD8 Tex-related genes in BP terms (B), CC terms (C) and MF terms (D). (E) KEGG enrichment analyses of CD8 Tex-related genes.
Identification of CD8 Tex-Related lncRNAs
Due to inconsistencies in the names and probes of lncRNAs, we first took intersection of lncRNAs identified in TCGA-LIHC, GSE14520 and GSE40144 datasets (Supplementary Figure 7A). Subsequently, 33 lncRNAs were obtained. Pearson’s correlation analysis was then utilized to identify CD8 Tex-related lncRNAs. According to the established criterion, 28 lncRNAs were identified as CD8 Tex-related lncRNAs, namely MAPKAPK5-AS1, PDCD4-AS1, TCL6, HAND2-AS1, MEG3, LINC01140, KLF3-AS1, LINC00652, MCM3AP-AS1, GSN-AS1, OR7E47P, DLEU2, SNHG17, GUSBP11, LINC00216, HLA-F-AS1, INE1, LINC00115, LINC00667, LINC00574, SNX29P2, IDI2-AS1, FLJ13224, CPS1-IT1, ASMTL-AS1, DGCR5, LINC00963 and PART1 (Supplementary Table 5).
Cluster Analysis
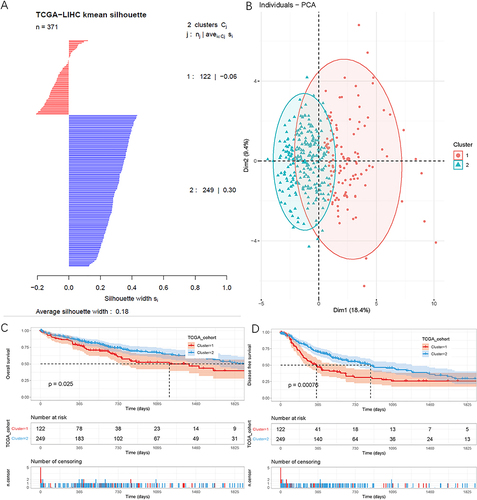
Cluster analysis was performed using “kmeans” function. Based on the between-cluster and within-cluster sum of squares, it was determined that the optimal clustering was 2 clusters (Supplementary Figure 7B and C). Consequently, patients were divided into 2 distinct clusters, comprising 122 and 249 samples, respectively (). PCA analysis revealed the distinct characteristics between clusters 1 and 2 (). Patients in cluster 2 exhibited significantly longer OS and DFS compared to those in cluster 1 (P<0.05, and ).
Figure 3 Samples were divided into 2 clusters based on CD8 Tex-related lncRNAs. (A) Silhouette coefficient of each sample in two clusters. (B) PCA analysis of the two clusters. (C–D) Patients in cluster 1 suffered significantly worse prognosis than those in cluster 2. (C) OS. (D) DFS.
TIME and ssGSEA of Bulk RNA-Seq Data
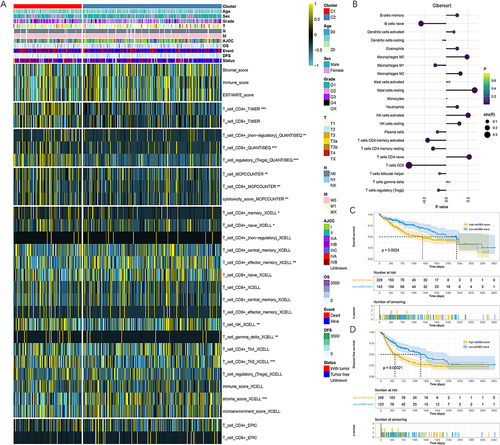
TIME of samples were assessed using five algorithms, including TIMER, QUANTISEQ, MCPCOUNTER, XCELL and EPIC. Indicators related to T cells were extracted to elucidate the relationships between clusters and TIME. The heatmap presented the different TIME between clusters 1 and 2 (). We calculated ssGSEA scores of each patient based on CD8 Tex-related lncRNAs. It indicated a significant negative correlation between the ssGSEA score and T_cells_CD8 fraction estimated by CIBERSORT algorithm (). Survival analysis revealed that patients with a high ssGSEA score had significantly shorter OS and DFS when compared to those with a low ssGSEA score ( and ).
Figure 4 Different immune landscapes of the two clusters in TCGA-LIHC cohort. (A) Associations of cluster, clinical characteristics and TIME. (B) Associations between ssGSEA scores and immune infiltration calculated by CIBERSORT algorithm. (C and D) Patients with high ssGSEA score suffered significantly worse prognosis than those with low ssGSEA score. (C) OS. (D) DFS. * P < 0.05, ** P < 0.01, *** P < 0.001.
Construction of a CD8 Tex-Related lncRNA Signature
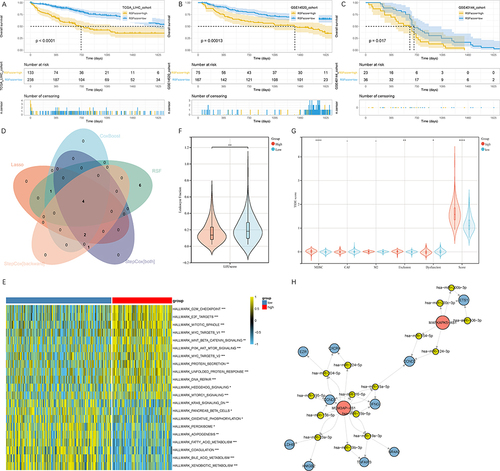
Twenty-eight CD8 Tex-related lncRNAs were integrated into machine learning procedure. We employed a combination of 96 machine learning algorithms to establish a CD8 Tex-related lncRNA signature (). The C-index of different cohorts was used to evaluate the performance of algorithms. RSF model showed optimal fitting, achieving the highest average C-index at 0.588. We illustrated the tree structure of RSF model in Supplementary Figure 8A. Association between number of trees and error rate is shown in . In the RSF model, 28 CD8 Tex-related lncRNAs presented varying degrees of importance. The top three most significant lncRNAs were MAPKAPK5-AS1, MCM3AP-AS1 and CPS1-IT1 (). Brier score was applied to assess the accuracy of probabilistic prediction. It revealed that the brier score of RFS method was much lower than KM method, indicating that the accuracy of RFS method was significantly higher that KM method (Supplementary Figure 8B). Risk score was calculated based on the RFS model, allowing samples to be categorized into high-risk and low-risk groups. Function “var.select” was used to filter variables of RSF model, resulting in 11 lncRNAs remaining, including MCM3AP-AS1, MAPKAPK5-AS1, PART1, CPS1-IT1, ASMTL-AS1, LINC00667, HLA-F-AS1, LINC00652, PDCD4-AS1, LINC01140 and TCL6. Relationships between risk scores, survival time, status and CD8 Tex lncRNA expression are compiled in . As risk score increasing, survival rate of patients decreased obviously. MCM3AP-AS1, MAPKAPK5-AS1, PART1, ASMTL-AS1, LINC00667, HLA-F-AS1, LINC00652, PDCD4-AS1, LINC01140 and TCL6 acted as risk factors, with their expression levels increasing as the risk scores rose. On the other hand, CPS1-IT1 functioned as a protective factor. Survival analyses indicated that OS of patients in high-risk group was significantly shorter than that of patients in low-risk group in TCGA-LIHC, GSE14520 and GSE40144 (). Similarly, patients in high-risk group suffered significantly higher risk of recurrence compared to those in low-risk group (Supplementary Figure 8C-E). Furthermore, we took the intersection of the filtered variables obtained from RSF, Lasso, CoxBoost and StepCox (). Four CD8 Tex-related lncRNA were remained in the intersection, including MCM3AP-AS1, MAPKAPK5-AS1, PART1 and LINC00652.
Figure 5 Establishment and validation of the prediction model. (A) A total of 96 sorts of prediction models and their C-index via machine learning method. (B) Error rate of RSF model at different number of trees. (C) Importance of different variables. (D–F) Survival time, status and CD8 Tex-related lncRNA expression as the risk score growing. (D) TCGA-LIHC cohort, (E) GSE14520 cohort and (F) GSE40144 cohort.
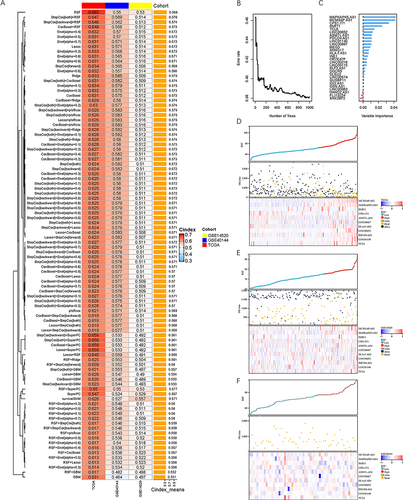
Figure 6 Identification of the core CD8 Tex-related lncRNAs. (A–C) Prognostic difference between high- and low-score groups. (A) TCGA-LIHC cohort, (B) GSE14520 cohort and (C) GSE40144 cohort. (D) Intersection of variables selected by LASSO, CoxBoost, RSF, stepCox (both) and stepCox (backward) algorithms. (E) Enriched pathways in high-risk and low-risk groups. (F) Leukocyte fractions of high- and low-score groups. (G) TIDE scores of high- and low-score groups. (H) CeRNA network of CD8 Tex-related mRNAs and lncRNAs. * P < 0.05, ** P < 0.01, *** P < 0.001, **** P < 0.0001.
Pathway Enrichment and ceRNA Network Construction
We calculated ssGSEA scores of hallmark gene sets and compared the difference between high- and low-risk groups (). It indicated that samples in the low-risk group were primarily enriched in metabiotic related pathways, including KRAS signaling, oxidative phosphorylation, peroxisome, adipogenesis, fatty acid metabolism, bile acid metabolism and xenobiotic metabolism, whereas samples in the high-risk group mainly enriched in cell division-related pathways, including G2M checkpoint, mitotic spindle, DNA repair, etc. Furthermore, leukocyte fractions and Tumor Immune Dysfunction and Exclusion (TIDE, http://tide.dfci.harvard.edu/) scores were extracted from the published literatures. It revealed that leukocyte fraction in low-risk group was significantly higher than that in high-risk group (). Additionally, TIDE score was significantly higher in high-risk group when compared to low-risk group. Moreover, T cell exclusion was significantly higher in high-risk group ().
Based on CD8 Tex-related mRNAs and lncRNAs, we constructed a ceRNA regulatory network. The ceRNA network encompassed 2 CD8 Tex-related lncRNAs, 10 CD8 Tex-related mRNAs and 15 miRNAs. We identified 21 ceRNA interactions that were related to CD8 Tex (Supplementary Table 6).
Mutation Status
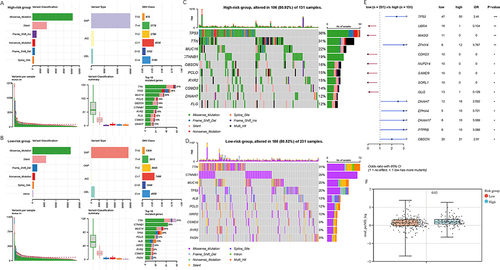
Genetic variation showed that the top 5 mutated genes in TCGA-LIHC cohort were TTN, TP53, CTNNB1, MUC16 and PCLO (Supplementary Figure 9A). Missense mutation was the most common type of variant classification. The most common variant type and single nucleotide variation (SNV) class were single nucleotide polymorphism (SNP) and “C>T”, respectively (Supplementary Figure 9B and C). Co-mutation analyses demonstrated that the concurrent occurrence of gene mutations was significantly excessive among the top highest 10 mutations. The most frequent co-occurrence and mutually exclusive mutations were OBSCN-FLG and TP53-CTNNB1, respectively (Supplementary Figure 9D). Characteristics of variant classification, variant type, SNV class and variants per sample were similar in both low- and high-risk groups ( and ). The top 5 genes with the highest mutation frequency in high-risk group were TP53, TTN, MUC16, CTNNB1 and OBSCN (). In contrast, the low-risk group had TTN, CTNNB1, MUC16, TP53 and ALB as the top five genes with the highest mutation frequency (). Compared to low-risk group, patients in high-risk group exhibited a higher frequency of mutations in TP53, ZFHX4, DNAH7, EPHA4 and DNAH17. Conversely, mutation frequency of UBR4, MAGI2, CDH23, NUP214 and SAMD9 in low-risk group was much lower than that in high-risk group (). TMB of each sample was calculated. It revealed that TMB in high-risk group was significantly higher than that in low-risk group ().
Figure 7 Mutation analysis of samples in high- and low-risk groups. (A and B) Summary of mutation status. (A) High-risk group. (B) Low-risk group. (C and D) Waterfall plots show mutation frequencies and types of the top 10 most commonly mutated genes. (C) High-risk group. (D) Low-risk group. (E) Mutational differences between high- and low-risk groups. (F) TMB of high- and low-risk group. * P < 0.05, ** P < 0.01, *** P < 0.001.
Drug Sensitivity Analysis
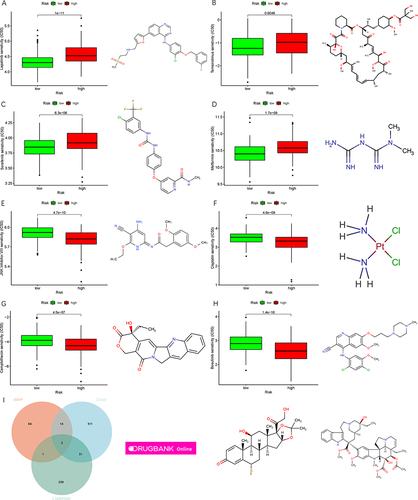
We further assessed the sensitivity of high- and low-risk samples to common chemotherapy drugs. Differences in the resistance potential between high- and low-risk groups were observed. Patients in the low-risk group were more sensitive to lapatinib, temsirolimus, sorafenib and metformin (, P all <0.05). In contrast, patients in the high-risk group were more sensitive to JNK.inhibitor.VIII, cisplatin, camptothecin and bosutinib (, P all <0.05). Relevant drug structures were also displayed. DEGs between high- and low-risk groups were obtained. The CMAP, L1000FWD and DGIdb databases were used to identify small molecular compounds for LIHC. Intersection of the molecular compounds included flunisolide and vinblastine ().
Figure 8 Drug sensitivity analyses and structure prediction. (A) Lapatinib, (B) Temsirolimus, (C) Sorafenib, (D) Metformin, (E) JNK.inhibitor.VIII, (F) Cisplatin, (G) Camptothecin, (H) Bosutinib. (I) Intersection of the potential drugs via cMAP, L100FWD and DGIdb databases based on DEGs.
Downregulation of MCM3AP-AS1, MAPKAPK5-AS1 and PART1 in HCC Cells Suppressed Proliferation, Migration and Invasion in vitro
L-02 and four HCC cell lines were cultured to verify the expression and potential functions of CD8 Tex-related lncRNAs. We performed RT-qPCR in normal hepatic and HCC cell lines. The primers used were listed in Supplementary Table 7. It indicated that the expression of MCM3AP-AS1, MAPKAPK5-AS1 and PART1 was significantly higher in HCC cells compared to L-02 cell line (). PLC5 and HuH-7 cell lines were selected for further study due to their higher expression of CD8 Tex-related lncRNAs. Targeting siRNAs were employed to specifically downregulate the expression of MCM3AP-AS1, MAPKAPK5-AS1 and PART1 expression in HCC cell lines (Supplementary Table 8). All these siRNAs exhibited good knockdown efficiencies (). CCK-8 and colony formation assays were conducted to assess the proliferative abilities of the cells. Knockdown of MCM3AP-AS1, MAPKAPK5-AS1 and PART1 significantly inhibited the proliferation of HCC cell lines ( and ). Transwell assays were used to investigate the effects of CD8 Tex-related lncRNAs on cell migration and invasion. Knockdown of MCM3AP-AS1, MAPKAPK5-AS1 and PART1 suppressed cell migration and invasion in HCC cell lines ( and , P all <0.01). Wound healing assays were also conducted to evaluate the capacities of cell migration. Migratory capacity of HCC cells was suppressed after downregulation of MCM3AP-AS1, MAPKAPK5-AS1 and PART1 (, P all <0.001).
Figure 9 Downregulation of MCM3AP-AS1, MAPKAPK5-AS1 and PART1 suppressed HCC cell proliferation, migration and invasion. (A) Expression levels of MCM3AP-AS1, MAPKAPK5-AS1 and PART1 in normal hepatic cell and hepatocellular carcinoma cell lines by RT-qPCR. (B) Relative expression level of siNC and siRNA in PLC5 and HuH-7 cell lines by RT-qPCR. (C) The ability of cell proliferation was evaluated by CCK-8 assay in PLC5 and HuH-7 cell lines. (D) The ability of cell proliferation was evaluated by CCK-8 assay in PLC5 and HuH-7 cell lines. (E–F) The abilities of cell migration and invasion were evaluated by transwell assays in PLC5 and HuH-7 cell lines. (E) Migration ability. (F) Invasion ability. Error bars showed the SD from three independent experiments. ** P < 0.01, *** P < 0.001.
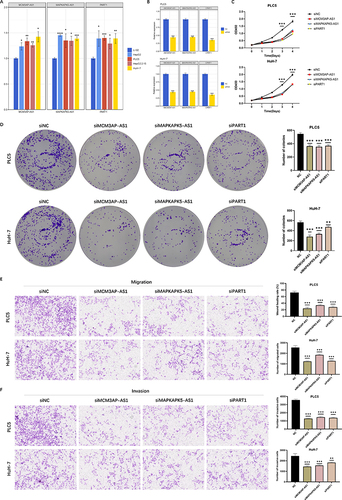
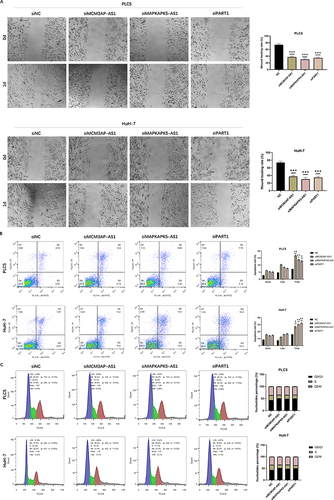
Figure 10 Downregulation of MCM3AP-AS1, MAPKAPK5-AS1 and PART1 suppressed migration, promoted apoptosis and arrested cell cycle progression in G1 phase. (A) The ability of cell migration was suppressed after knockdown of MCM3AP-AS1, MAPKAPK5-AS1 and PART1. (B) The apoptosis rates of PLC5 and HuH-7 cells were evaluated by flow cytometry after transfection. (C) Cell cycle analysis of PLC5 and HuH-7 cells were conducted by flow cytometry after transfection. Error bars showed the SD from three independent experiments. * P < 0.05, ** P < 0.01, *** P < 0.001.
Downregulation of MCM3AP-AS1, MAPKAPK5-AS1 and PART1 Promoted Apoptosis and Arrested Cell Cycle in G1 Phase
We measured apoptosis and cell cycle by flow cytometry. Inhibition of MCM3AP-AS1, MAPKAPK5-AS1 and PART1 significantly promoted apoptosis in HCC cell lines (, P all <0.05). After knockdown of MCM3AP-AS1, MAPKAPK5-AS1 and PART1, HCC cells in S phase decreased, and cells in G0/G1 phase increased. These results indicated that knockdown of MCM3AP-AS1, MAPKAPK5-AS1 and PART1 promoted cell cycle arrest in G1 phase (). To further know about the effects of CD8 Tex-related lncRNAs in pan-cancer, we explored the expression features in TCGA pan-cancer cohort, which contained 23 tumors. As shown in , MCM3AP-AS1 was up-regulated in 14 tumors, and down-regulated in KICH. MAPKAPK5-AS1 was up-regulated in 16 tumors and down-regulated in BRCA. PART1 was up- and down-regulated in 7 and 10 tumors, respectively. LINC00652 was up- and down-regulated in 6 and 6 tumors, respectively.
Figure 11 Validation experiments at pan-cancer and organoid levels. (A) Differential expression of MCM3AP-AS1, MAPKAPK5-AS1 and PART1 in tumor and normal samples of 23 tumors in TCGA database. Redness and blueness indicated upregulation and downregulation in tumor samples, respectively. (B) RT-qPCR validated the effects of knockdown. (C–E) The growth of HCC organoids with or without siRNAs treatment. (C) siMCM3AP-AS1. (D) siMAPKAPK5-AS1. (E) siPART1. (F–H) Immunofluorescence images of HCC organoids stained with DAPI (nuclei, blue) and Ki67 (red). (F) siMCM3AP-AS1. (G) siMAPKAPK5-AS1. (H) siPART1. * P < 0.05, ** P < 0.01, *** P < 0.001, **** P < 0.0001.
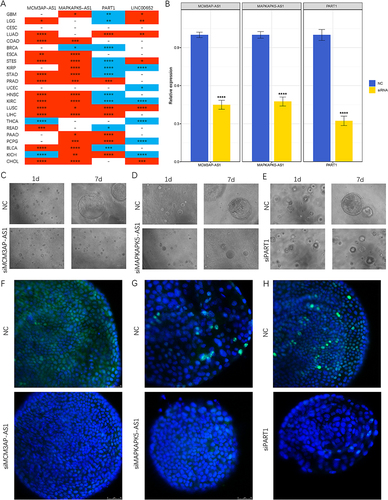
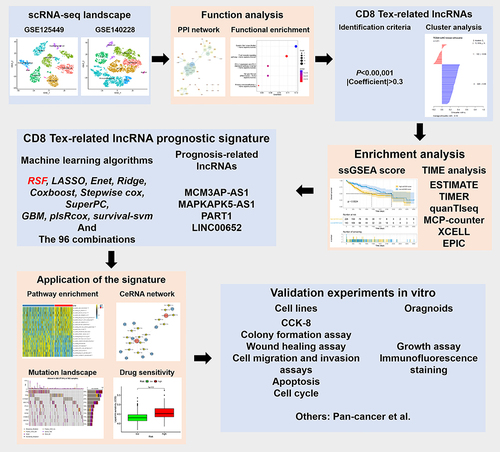
Figure 12 Flow chart of this study.
Downregulation of MCM3AP-AS1, MAPKAPK5-AS1 and PART1 Hindered Growth in Organoids
To investigate the roles of CD8 Tex-related lncRNAs in HCC, organoid model derived from a patient was established. We successfully transfected siRNAs into HCC organoids. Knockdown of MCM3AP-AS1, MAPKAPK5-AS1 and PART1 significantly suppressed HCC organoid growth in vitro (). Immunofluorescence staining revealed that the frequency of Ki67-positive organoids was notably reduced following the downregulation of MCM3AP-AS1, MAPKAPK5-AS1 and PART1 (). We illustrated the entire process of this study in .
Discussion
In this study, markers of CD8 Tex cell were obtained via scRNA-seq. CD8 Tex-related lncRNAs were identified by correlation analysis. Consensus cluster analysis indicated that HCC samples could be categorized into two distinct clusters, each exhibiting unique immune infiltration characteristics. Prognostic related lncRNAs were filtered through 96 algorithm combinations, revealing RSF as the optimal method. Risk score of all samples was computed using the RSF model. Patients with high RSF score suffered poorer prognosis compared to those with low RSF score. Notably, the two groups exhibited different mutation characteristics and drug sensitivities. Finally, we delved the expression patterns and potential function roles of CD8 Tex-related lncRNAs in HCC cell lines and organoids. Downregulation of MCM3AP-AS1, MAPKAPK5-AS1 and PART1 in HCC cells suppressed proliferation, migration, and invasion while promoting apoptosis in vitro.
The advancement of sequencing technology has granted us a profounder understanding of malignant tumors.Citation47 This has enabled us to recognize crucial biomarkers in disease progression.Citation48 Traditional bulk sequencing method provides an average value of gene expression across a cell population, potentially overlooking the variations between individual cells. As a cutting-edge technology, scRNA-seq plays a crucial role in identifying rare cell types within tissues and organisms.Citation49 It enables the identification and characterization of distinct cell populations and subpopulations, thus allowing researcher to study the genetic information of individual cells.Citation22 In cancer research, it aids in the identification of rare cancer stem cells, understanding tumor heterogeneity, and monitoring the dynamics of tumor evolution.Citation50 Additionally, in immunology, it assists in dissecting immune cell responses and identifying rare immune cell subsets.Citation51
Tex refers to a dysfunctional state and functional exhaustion that occurs in T cells, primarily in the context of chronic infections, cancer, or prolonged antigen exposure.Citation52 In such scenarios, T cells experience a chronic, progressive loss of effector functions, including reduced cytokine production, decreased cytotoxicity, resistance to reactivation, and impaired proliferation. Tex is characterized by the upregulation of inhibitory receptors, such as PD-1, TIM-3, and LAG-3.Citation53 This phenomenon plays an important role in tumor progression and metastasis.Citation54 These receptors dampen T cell activity and contribute to immune suppression. It was reported that local expansion of Tregs and CD8 Tex cells led to their preferential accumulation in HCC.Citation55 Immune checkpoint blockade (ICB) therapies have emerged as the leading strategy to restore T cell function and enhance the immune response against tumor cells.Citation56
Gaining insights into the mechanisms and pathways of CD8 Tex cells could provide additional strategies to regulate the immune system and eliminate tumors. Despite numerous reports on CD8 Tex cell markers, little is known about CD8 Tex-related lncRNAs. Therefore, we tried to explore CD8 Tex-related lncRNAs based on their correlations with CD8 Tex-related markers. After identifying CD8 Tex-related lncRNAs, a prognostic signature was established using 10 common machine learning algorithms and 96 algorithm combinations. By comparing the C-index of various algorithms, RSF was ultimately chosen as the optimal signature with an average C-index at 0.588. Among the machine learning algorithms we employed, five had a variable filtering function, including RSF, LASSO, CoxBoost, backward stepwise Cox, and both stepwise Cox regression. Intersection of variables selected by these algorithms included MCM3AP-AS1, MAPKAPK5-AS1, PART1 and LINC00652. These variables also played important roles in RSF models.
Our previous study indicated that MAPKAPK5-AS1 could facilitate proliferation in HBV-related hepatocellular.Citation57 Specifically, MAPKAPK5-AS1 stabilized c-Myc and induced transcriptional activation of CDK4, CDK6 and SKP2, ultimately facilitating G1/S transition. Predominantly expressed in M2 macrophage, MAPKAPK5-AS1 was transferred to HBV+ HCC cells via exosomes. HBeAg could upregulate MAPKAPK5-AS1 expression by m6A modification.Citation57 Wang et al revealed a MAPKAPK5-AS1/PLAGL2/HIF-1α signaling loop in HCC.Citation58 MAPKAPK5-AS1 upregulated PLAGL2 expression and enhanced HCC growth and metastasis by activating the EGFR/AKT signaling pathway.Citation58 Moreover, MAPKAPK5-AS1 was proven to promote HCC progression through ceRNA mechanisms. Peng et al indicated that MAPKAPK5-AS1 could sponge miR-429 and upregulate ZEB1, thereby driving HCC progression.Citation59 Lv et al showed that MAPKAPK5-AS1 competitively bound to miR-376b-5p and prevent ECT2 from degradation, thus facilitating HCC metastasis.Citation60
The other three lncRNAs have also been reported to play important roles in progression and metastasis of HCC. Wang et al recognized that MCM3AP-AS1 exerted an oncogenic role by targeting miR-194-5p and promoting FOXA1 expression in HCC.Citation61 Zhang et al indicated that MCM3AP-AS1 interacted with miR-455 and promoted HCC metastasis via the EGFR and autophagy axis.Citation62 PART1 promoted progression of HCC through miR-149-5p/MAP2K1 and miR-590-3p/HMGB2 axes.Citation63,Citation64 Zhou et al indicated that PART1 could be derived from HCC extracellular vesicles and promoted M2 polarization via miR-372-3p/TLR4 axis.Citation65 To the best of our knowledge, association between LINC00652 and HCC progression was limited right now.
In this study, we endeavored to delve into CD8 Tex-related lncRNA via scRNA-seq and have successfully established a novel CD8 Tex-related lncRNA signature. However, it is imperative to acknowledge several limitations. First, platforms utilized for the various cohorts were diverse, which contributed to a relatively small number of candidate lncRNAs. Second, all samples included in this study were retrospective, necessitating future validation through multicenter prospective research. Third, Tex was highly related to hepatitis B and C virus infections. This might potentially introduce bias into the results of this study. Finally, the specific mechanisms of filtered CD8 Tex-related lncRNAs in HCC remained elusive, necessitating further experimentation.
In conclusion, leveraging scRNA-seq and correlation analysis, we successfully filtered CD8 Tex-related lncRNAs. A CD8 Tex-related lncRNA signature was constructed and validated using the RSF model. The signature served as a valuable tool for decision-making in clinical works. These findings provided new insights into the regulatory mechanisms of CD8 Tex-related lncRNAs in HCC and could facilitate the development of novel therapeutic strategies.
Abbreviations
HCC, hepatocellular carcinoma; Tex, T cell exhaustion; scRNA-seq, single-cell RNA sequencing; ICIs, immune checkpoint inhibitors; TIME, tumor immune microenvironment; lncRNA, long non-coding RNA; GEO, Gene Expression Omnibus; TCGA, The Cancer Genome Atlas; PC, principal component; ssGSEA, single sample gene set enrichment; GSVA, gene set variation analysis; PPI, protein–protein interaction; GO, Gene Ontology; KEGG, Kyoto Encyclopedia of Genes and Genomes; CC, cellular component; MF, molecular function; BP, biological process; CIBERSORT, Cell-type identification by Estimating Relative Subsets of RNA Transcripts; ESTIMATE, Estimation of Stromal and Immune Cells in Malignant Tumors Tissues using Expression; TIMER, Tumor Immune Estimation Resource; OS, overall survival; RSF, random survival forest; SVM, support vector machine; Enet, elastic net; LASSO, least absolute shrinkage and selection operator; SuperPC, supervised principal components; GBM, generalized boosted regression modelling; plsRcox, partial least squares regression for Cox; C-index, Harrell’s concordance index; DFS, disease-free survival; ceRNA, competing endogenous RNA; MSigDB, Molecular Signatures Database; MAF, Mutation Annotation Format; TMB, tumor mutation burden; IC50, half-maximal inhibitory concentration; DEG, differentially expressed genes; L1000FWD, L1000 Fireworks Display; DGIdb, Drug Gene Interaction Database; CMap, Connectivity Map; t-SNE, T-distributed stochastic neighbor embedding; TIDE, Tumor Immune Dysfunction and Exclusion; SNV, single nucleotide variation; SNP, single nucleotide polymorphism; ICB, immune checkpoint blockade.
Ethics Approval
The study was conducted in accordance with the guidelines of the Declaration of Helsinki and approved by the Ethics Committee of Henan Provincial People’s Hospital, People’s Hospital of Zhengzhou University (2019 No.58) and Peking University Third Hospital (M2020233).
Author Contributions
All authors made a significant contribution to the work reported, whether that is in the conception, study design, execution, acquisition of data, analysis and interpretation, or in all these areas; took part in drafting, revising or critically reviewing the article; gave final approval of the version to be published; have agreed on the journal to which the article has been submitted; and agree to be accountable for all aspects of the work.
Disclosure
The authors declare no competing interest in this work.
Data Sharing Statement
Original data presented in the study are included in the article or its Supplementary Materials. Essential scripts and codes used for analysis are available on the Github website (https://github.com/jcge/CD8_Tex_lncRNA). Further inquiries can be directed to the corresponding author.
Additional information
Funding
References
- Siegel RL, Miller KD, Wagle NS, Jemal A. Cancer statistics, 2023. CA Cancer J Clin. 2023;73(1):17–48. doi:10.3322/caac.21763
- Vogel A, Meyer T, Sapisochin G, Salem R, Saborowski A. Hepatocellular carcinoma. Lancet. 2022;400(10360):1345–1362. doi:10.1016/S0140-6736(22)01200-4
- Llovet JM, De Baere T, Kulik L, et al. Locoregional therapies in the era of molecular and immune treatments for hepatocellular carcinoma. Nat Rev Gastroenterol Hepatol. 2021;18(5):293–313. doi:10.1038/s41575-020-00395-0
- Brown ZJ, Tsilimigras DI, Ruff SM, et al. Management of Hepatocellular Carcinoma: a Review. JAMA Surg. 2023;158(4):410–420. doi:10.1001/jamasurg.2022.7989
- Blank CU, Haining WN, Held W, et al. Defining ‘T cell exhaustion’. Nat Rev Immunol. 2019;19(11):665–674. doi:10.1038/s41577-019-0221-9
- Pritykin Y, van der Veeken J, Pine AR, et al. A unified atlas of CD8 T cell dysfunctional states in cancer and infection. Mol Cell. 2021;81(11):2477–2493e2410. doi:10.1016/j.molcel.2021.03.045
- Zheng K, Zheng X, Yang W. The role of metabolic dysfunction in T-cell exhaustion during chronic viral infection. Front Immunol. 2022;13:843242. doi:10.3389/fimmu.2022.843242
- Collier JL, Weiss SA, Pauken KE, Sen DR, Sharpe AH. Not-so-opposite ends of the spectrum: CD8(+) T cell dysfunction across chronic infection, cancer and autoimmunity. Nat Immunol. 2021;22(7):809–819. doi:10.1038/s41590-021-00949-7
- Tabana Y, Moon TC, Siraki A, Elahi S, Barakat K. Reversing T-cell exhaustion in immunotherapy: a review on current approaches and limitations. Expert Opin Ther Targets. 2021;25(5):347–363. doi:10.1080/14728222.2021.1937123
- Kim HD, Song GW, Park S, et al. Association between expression level of PD1 by tumor-infiltrating CD8(+) T Cells and Features of Hepatocellular Carcinoma. Gastroenterology. 2018;155(6):1936–1950e1917. doi:10.1053/j.gastro.2018.08.030
- Wang YG, Zheng DH, Shi M, Xu XM. T cell dysfunction in chronic hepatitis B infection and liver cancer: evidence from transcriptome analysis. J Med Genet. 2019;56(1):22–28. doi:10.1136/jmedgenet-2018-105570
- Micheel J, Safrastyan A, Wollny D. Advances in non-coding RNA sequencing. Noncoding RNA. 2021;7(4). doi:10.3390/ncrna7040070
- Panni S, Lovering RC, Porras P, Orchard S. Non-coding RNA regulatory networks. Biochim Biophys Acta Gene Regul Mech. 2020;1863(6):194417. doi:10.1016/j.bbagrm.2019.194417
- Anastasiadou E, Jacob LS, Slack FJ. Non-coding RNA networks in cancer. Nat Rev Cancer. 2018;18(1):5–18. doi:10.1038/nrc.2017.99
- Moldogazieva NT, Zavadskiy SP, Astakhov DV, et al. Differentially expressed non-coding RNAs and their regulatory networks in liver cancer. Heliyon. 2023;9(9):e19223. doi:10.1016/j.heliyon.2023.e19223
- Wang W, Yang T, Li D, Huang Y, Bai G, Li Q. LINC00491 promotes cell growth and metastasis through miR-324-5p/ROCK1 in liver cancer. J Transl Med. 2021;19(1):504. doi:10.1186/s12967-021-03139-z
- Sheng JQ, Wang MR, Fang D, et al. LncRNA NBR2 inhibits tumorigenesis by regulating autophagy in hepatocellular carcinoma. Biomed Pharmacother. 2021;133:111023. doi:10.1016/j.biopha.2020.111023
- Cai Y, Lyu T, Li H, et al. LncRNA CEBPA-DT promotes liver cancer metastasis through DDR2/beta-catenin activation via interacting with hnRNPC. J Exp Clin Cancer Res. 2022;41(1):335. doi:10.1186/s13046-022-02544-6
- Shi Z, Li Z, Jin B, et al. Loss of LncRNA DUXAP8 synergistically enhanced sorafenib induced ferroptosis in hepatocellular carcinoma via SLC7A11 de-palmitoylation. Clin Transl Med. 2023;13(6):e1300. doi:10.1002/ctm2.1300
- Liao W, Du J, Wang Z, et al. The role and mechanism of noncoding RNAs in regulation of metabolic reprogramming in hepatocellular carcinoma. Int, J, Cancer. 2022;151(3):337–347. doi:10.1002/ijc.34040
- Huang Z, Zhou JK, Peng Y, He W, Huang C. The role of long noncoding RNAs in hepatocellular carcinoma. Mol Cancer. 2020;19(1):77. doi:10.1186/s12943-020-01188-4
- Jia Q, Chu H, Jin Z, Long H, Zhu B. High-throughput single-small es, Cyrillicell sequencing in cancer research. Signal Transduct Target Ther. 2022;7(1):145. doi:10.1038/s41392-022-00990-4
- Heinrich S, Craig AJ, Ma L, Heinrich B, Greten TF, Wang XW. Understanding tumour cell heterogeneity and its implication for immunotherapy in liver cancer using single-cell analysis. J Hepatol. 2021;74(3):700–715. doi:10.1016/j.jhep.2020.11.036
- Ma L, Hernandez MO, Zhao Y, et al. Tumor cell biodiversity drives microenvironmental reprogramming in liver cancer. Cancer Cell. 2019;36(4):418–430e416. doi:10.1016/j.ccell.2019.08.007
- Zhang Q, He Y, Luo N, et al. Landscape and dynamics of single immune cells in hepatocellular carcinoma. Cell. 2019;179(4):829–845e820. doi:10.1016/j.cell.2019.10.003
- Szklarczyk D, Kirsch R, Koutrouli M, et al. The STRING database in 2023: protein-protein association networks and functional enrichment analyses for any sequenced genome of interest. Nucleic Acids Res. 2023;51(D1):D638–D646. doi:10.1093/nar/gkac1000.
- Subramanian A, Tamayo P, Mootha VK, et al. Gene set enrichment analysis: a knowledge-based approach for interpreting genome-wide expression profiles. Proc Natl Acad Sci U S A. 2005;102(43):15545–15550. doi:10.1073/pnas.0506580102
- Kanehisa M, Furumichi M, Sato Y, Ishiguro-Watanabe M, Tanabe M. KEGG: integrating viruses and cellular organisms. Nucleic Acids Res. 2021;49(D1):D545–D551. doi:10.1093/nar/gkaa970
- Zhou Y, Zhou B, Pache L, et al. Metascape provides a biologist-oriented resource for the analysis of systems-level datasets. Nat Commun. 2019;10(1):1523. doi:10.1038/s41467-019-09234-6
- Wilkerson MD, Hayes DN. ConsensusClusterPlus: a class discovery tool with confidence assessments and item tracking. Bioinformatics. 2010;26(12):1572–1573. doi:10.1093/bioinformatics/btq170
- Chen B, Khodadoust MS, Liu CL, Newman AM, Alizadeh AA. Profiling Tumor Infiltrating Immune Cells with CIBERSORT. Methods Mol Biol. 2018;1711:243–259. doi:10.1007/978-1-4939-7493-1_12
- Yoshihara K, Shahmoradgoli M, Martinez E, et al. Inferring tumour purity and stromal and immune cell admixture from expression data. Nat Commun. 2013;4(1):2612. doi:10.1038/ncomms3612
- Li T, Fu J, Zeng Z, et al. TIMER2.0 for analysis of tumor-infiltrating immune cells. Nucleic Acids Res. 2020;48(W1):W509–W514. doi:10.1093/nar/gkaa407
- Finotello F, Mayer C, Plattner C, et al. Molecular and pharmacological modulators of the tumor immune contexture revealed by deconvolution of RNA-seq data. Genome Med. 2019;11(1):34. doi:10.1186/s13073-019-0638-6
- Becht E, Giraldo NA, Lacroix L, et al. Estimating the population abundance of tissue-infiltrating immune and stromal cell populations using gene expression. Genome Biol. 2016;17(1):218. doi:10.1186/s13059-016-1070-5
- Aran D, Hu Z, Butte AJ. xCell: digitally portraying the tissue cellular heterogeneity landscape. Genome Biol. 2017;18(1):220. doi:10.1186/s13059-017-1349-1
- Racle J, de Jonge K, Baumgaertner P, Speiser DE, Gfeller D. Simultaneous enumeration of cancer and immune cell types from bulk tumor gene expression data. Elife. 2017;6. doi:10.7554/eLife.26476
- Liberzon A, Birger C, Thorvaldsdottir H, Ghandi M, Mesirov JP, Tamayo P. The Molecular Signatures Database (MSigDB) hallmark gene set collection. Cell Syst. 2015;1(6):417–425. doi:10.1016/j.cels.2015.12.004
- Mayakonda A, Lin DC, Assenov Y, Plass C, Koeffler HP. Maftools: efficient and comprehensive analysis of somatic variants in cancer. Genome Res. 2018;28(11):1747–1756. doi:10.1101/gr.239244.118
- Geeleher P, Cox N, Huang RS. pRRophetic: an R package for prediction of clinical chemotherapeutic response from tumor gene expression levels. PLoS One. 2014;9(9):e107468. doi:10.1371/journal.pone.0107468
- Ritchie ME, Phipson B, Wu D, et al. limma powers differential expression analyses for RNA-sequencing and microarray studies. Nucleic Acids Res. 2015;43(7):e47. doi:10.1093/nar/gkv007
- Wang Z, Lachmann A, Keenan AB, Ma’ayan A. L1000FWD: fireworks visualization of drug-induced transcriptomic signatures. Bioinformatics. 2018;34(12):2150–2152. doi:10.1093/bioinformatics/bty060
- Cannon M, Stevenson J, Stahl K, et al. DGIdb 5.0: rebuilding the drug-gene interaction database for precision medicine and drug discovery platforms. Nucleic Acids Res. 2024;52(D1):D1227–D1235. doi:10.1093/nar/gkad1040
- Lamb J, Crawford ED, Peck D, et al. The Connectivity Map: using gene-expression signatures to connect small molecules, genes, and disease. Science. 2006;313(5795):1929–1935. doi:10.1126/science.1132939
- Williams G. SPIEDw: a searchable platform-independent expression database web tool. BMC Genomics. 2013;14(1):765. doi:10.1186/1471-2164-14-765
- Knox C, Wilson M, Klinger CM, et al. DrugBank 6.0: the DrugBank Knowledgebase for 2024. Nucleic Acids Res. 2024;52(D1):D1265–D1275. doi:10.1093/nar/gkad976
- Li T, Mehraein-Ghomi F, Forbes ME, et al. HSP90-CDC37 functions as a chaperone for the oncogenic FGFR3-TACC3 fusion. Mol Ther. 2022;30(4):1610–1627. doi:10.1016/j.ymthe.2022.02.009
- Bian S, Ni W, Zhu M, et al. Flap endonuclease 1 Facilitated hepatocellular carcinoma progression by enhancing USP7/MDM2-mediated P53 inactivation. Int J Biol Sci. 2022;18(3):1022–1038. doi:10.7150/ijbs.68179
- Lei Y, Tang R, Xu J, et al. Applications of single-cell sequencing in cancer research: progress and perspectives. J Hematol Oncol. 2021;14(1):91. doi:10.1186/s13045-021-01105-2
- Huang D, Ma N, Li X, et al. Advances in single-cell RNA sequencing and its applications in cancer research. J Hematol Oncol. 2023;16(1):98. doi:10.1186/s13045-023-01494-6
- Wherry EJ. T cell exhaustion. Nat Immunol. 2011;12(6):492–499. doi:10.1038/ni.2035
- McLane LM, Abdel-Hakeem MS, Wherry EJ. CD8 T cell exhaustion during chronic viral infection and cancer. Annu Rev Immunol. 2019;37(1):457–495. doi:10.1146/annurev-immunol-041015-055318
- Cheng H, Ma K, Zhang L, Li G. The tumor microenvironment shapes the molecular characteristics of exhausted CD8(+) T cells. Cancer Lett. 2021;506:55–66. doi:10.1016/j.canlet.2021.02.013
- Zielinski CE. T helper cell subsets: diversification of the field. Eur J Immunol. 2023;53(12):e2250218. doi:10.1002/eji.202250218
- Barsch M, Salie H, Schlaak AE, et al. T-cell exhaustion and residency dynamics inform clinical outcomes in hepatocellular carcinoma. J Hepatol. 2022;77(2):397–409. doi:10.1016/j.jhep.2022.02.032
- Schmid D, Auf der Maur P, Trefny MP, Zippelius A. Unraveling T-cell Exhaustion: genetic Screening meets in vitro modeling. Cancer Res. 2023;83(23):3830–3832. doi:10.1158/0008-5472.CAN-23-3204
- Tao L, Li D, Mu S, Tian G, Yan G. LncRNA MAPKAPK5_AS1 facilitates cell proliferation in hepatitis B virus -related hepatocellular carcinoma. Lab Invest. 2022;102(5):494–504. doi:10.1038/s41374-022-00731-9
- Wang L, Sun L, Liu R, et al. Long non-coding RNA MAPKAPK5-AS1/PLAGL2/HIF-1alpha signaling loop promotes hepatocellular carcinoma progression. J Exp Clin Cancer Res. 2021;40(1):72. doi:10.1186/s13046-021-01868-z
- Peng Z, Ouyang X, Wang Y, Fan Q. MAPKAPK5-AS1 drives the progression of hepatocellular carcinoma via regulating miR-429/ZEB1 axis. BMC Mol Cell Biol. 2022;23(1):21. doi:10.1186/s12860-022-00420-x
- Lv E, Sheng J, Yu C, Rao D, Huang W. Long noncoding RNA MAPKAPK5-AS1 promotes metastasis through regulation miR-376b-5p/ECT2 axis in hepatocellular carcinoma. Dig Liver Dis. 2023;55(7):945–954. doi:10.1016/j.dld.2022.11.024
- Wang Y, Yang L, Chen T, et al. A novel lncRNA MCM3AP-AS1 promotes the growth of hepatocellular carcinoma by targeting miR-194-5p/FOXA1 axis. Mol Cancer. 2019;18(1):28. doi:10.1186/s12943-019-0957-7
- Zhang H, Luo C, Zhang G. LncRNA MCM3AP-AS1 regulates epidermal growth factor receptor and autophagy to promote hepatocellular carcinoma metastasis by interacting with miR-455. DNA Cell Biol. 2019;38(8):857–864. doi:10.1089/dna.2019.4770
- Zhou C, Wang P, Tu M, Huang Y, Xiong F, Wu Y. Long non-coding RNA PART1 promotes proliferation, migration and invasion of hepatocellular carcinoma cells via miR-149-5p/MAP2K1 axis. Cancer Manag Res. 2020;12:3771–3782. doi:10.2147/CMAR.S246311
- Pu J, Tan C, Shao Z, et al. Long noncoding RNA PART1 promotes hepatocellular carcinoma progression via targeting miR-590-3p/HMGB2 axis. Onco Targets Ther. 2020;13:9203–9211. doi:10.2147/OTT.S259962
- Zhou J, Che J, Xu L, Yang W, Zhou W, Zhou C. Tumor-derived extracellular vesicles containing long noncoding RNA PART1 exert oncogenic effect in hepatocellular carcinoma by polarizing macrophages into M2. Dig Liver Dis. 2022;54(4):543–553. doi:10.1016/j.dld.2021.07.005