
Abstract
Objective
The aim of this study is to develop and verify a magnetic resonance imaging (MRI)-based radiomics model for predicting the microvascular invasion grade (MVI) before surgery in individuals diagnosed with nodular hepatocellular carcinoma (HCC).
Methods
A total of 198 patients were included in the study and were randomly stratified into two groups: a training group consisting of 139 patients and a test group comprising 59 patients. The tumor lesion was manually segmented on the largest cross-sectional slice using ITK SNAP, with agreement reached between two radiologists. The selection of radiomics features was carried out using the LASSO (Least Absolute Shrinkage and Selection Operator) algorithm. Radiomics models were then developed through maximum correlation, minimum redundancy, and logistic regression analyses. The performance of the models in predicting MVI grade was assessed using the area under the receiver operating characteristic curve (AUC) and metrics derived from the confusion matrix.
Results
There were no notable statistical differences in sex, age, BMI (body mass index), tumor size, and location between the training and test groups. The AP and PP radiomic model constructed for predicting MVI grade demonstrated an AUC of 0.83 (0.75–0.88) and 0.73 (0.64–0.80) in the training group and an AUC of 0.74 (0.61–0.85) and 0.62 (0.48–0.74) in test group, respectively. The combined model consists of imaging data and clinical data (age and AFP), achieved an AUC of 0.85 (0.78–0.91) and 0.77 (0.64–0.87) in the training and test groups, respectively.
Conclusion
A radiomics model utilizing-contrast-enhanced MRI demonstrates strong predictive capability for differentiating MVI grades in individuals with nodular HCC. This model could potentially function as a dependable and resilient tool to support hepatologists and radiologists in their preoperative decision-making processes.
Introduction
Hepatocellular carcinoma (HCC) is the most prevalent primary malignant liver tumor associated with high mortality rates. Currently, radical resection is usually the primary treatment modality for HCC. Nevertheless, due to tumor recurrence, the 5-year survival rate for patients with HCC remains unsatisfactory. Microvascular invasion (MVI) plays a pivotal role in the elevated recurrence rate, shortened recurrence time, and poor prognosis following hepatectomy for HCC.Citation1,Citation2 Numerous studies have affirmed that patients with high-risk MVI exhibit a worse prognosis compared to those with low-risk MVI after HCC resection or liver transplant.Citation2–4 Presently, MVI grading relies on postoperative pathological analysis of MVI number and distribution.Citation5
Recent literature has explored the use of clinical and radiological features such as tumor size, number, differentiation, serum α-fetoprotein (AFP) levels, peripheral integrity, margin smoothness, and margin enhancement to preoperatively predict MVI. However, the subjective interpretation of conventional imaging signs introduces observer bias, leading to poor reproducibility and unreliable prediction accuracy.Citation6,Citation7 Furthermore, many studies primarily focus on predicting the presence or absence of MVI without addressing its grade.Citation8
Therefore, there is a pressing need for an accurate preoperative prediction of both the state and grade of MVI in HCC to facilitate the development of personalized therapeutic strategies and prognostic assessments. This study combines clinical and radiomics datasets, aiming to construct a radiomics model for predicting MVI grade based on contrast-enhanced magnetic resonance imaging (CE-MRI), using postoperative pathology as a reference criterion.
Materials and Methods
Study Participants
With the approval of our hospital’s Institutional Review Board, a retrospective study was conducted on patients who had undergone preoperative CE-MRI examination of the liver within a timeframe of less than 2 weeks before hepatectomy, and who were pathologically confirmed with HCC, between January 2019 and April 2022. Exclusion criteria included: (a) Incomplete clinical, imaging, and pathological data; (b) Presence of multiple or recurrent tumors; (c) Previous treatments such as radiotherapy, chemotherapy, radiofrequency ablation, or other interventions before the imaging examination or surgery; (d) Cases with poor image quality that rendered the delineation of the regions of interest (ROI) impossible. Out of the 323 patients initially screened, 198 were deemed eligible for inclusion in this study and were randomly divided into two groups with a ratio of 7:3, as depicted in . The clinical stage of HCC was assessed in accordance with the diagnosis and treatment guidelines for liver cancer.Citation9
Figure 1 The flowchart of patient selection.
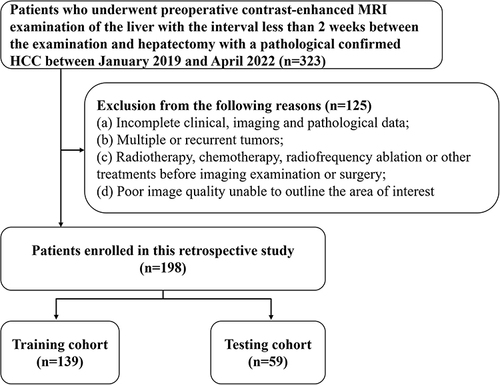
Image Acquisition
The patients fasted for a period of 6 to 8 hours to clear their gastrointestinal tract before undergoing an MRI examination. Two 3.0-T MR scanners (Achieva MR, Philips Medical Systems, Netherlands; Signa HDxt, GE, USA) with an 8‑channel phased‑array body coil were utilized to acquire MR images. A bolus injection of gadodiamide (Omniscan 0.5 mmol/mL; GE Healthcare) at a standard dose (0.2 mL/kg) was administered through peripheral veins using an automatic pump injector at a rate of 3.0 mL/sec. This injection was immediately followed by a 20 mL infusion of a 0.9% sterile saline solution. CE-MRI scans were conducted using a multiphase 3D spoiled gradient echo liver acceleration volume acquisition sequence. Dynamic images enhanced with contrast were captured at 15–20 s (arterial phase, AP), 50–55 s (portal venous phase, PVP), and 85–90 s (delayed phase) post-contrast-agent injection. The specific scanning parameters are presented in Supplementary Materials - PART 1.
ROI Segmentation and Radiomics Feature Extraction
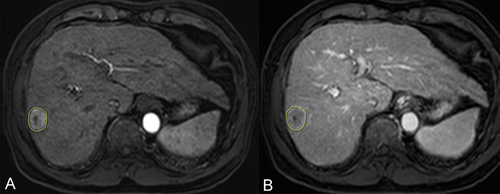
The radiomics analysis utilized standardized procedures outlined by the Image Biomarker Standardization Initiative (IBSI).Citation10 ROI were defined on the transverse arterial and portal vein phase T1 weighted image (T1WI) obtained from CE-MRI. The segmentation of ROI followed a two-step procedure. Specifically, the tumor lesion was manually segmented only on the cross-sectional layer depicting the maximum tumor area using ITK SNAP (www.itksnap.org) for both the AP and PVP images (). Two experienced radiologists (referred to as P and Z), with three and five years of experience, respectively, delineated all MRI ROI. During the delineation process, radiologists were blinded to the clinical information of the patients. The reproducibility of interobserver measurements was assessed using intraclass correlation coefficients (ICCs), where an ICC value exceeding 0.75 indicated a high degree of feature stability.
Figure 2 ROI segmentation. The largest dimension of the lesion in the arterial (A) and portal venous phases (B) was selected and ROIs were sketched along the edge of the lesion.
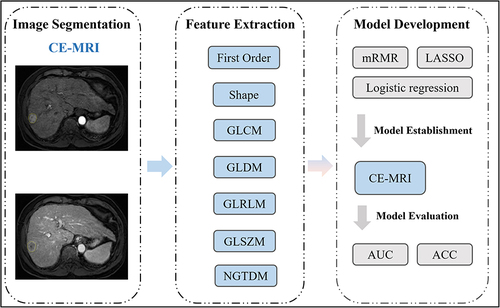
To derive radiomics features for subsequent studies, the implementation of MRI radiomics feature extraction was carried out in Python using the “Pyradiomics” package,Citation11 with manual or semi-automated segmentation. A total of 576 radiomics features were extracted and categorized into seven groups: (1) first-order, (2) shape features, (3) grey-level co-occurrence matrix (GLCM), (4) gray-level difference method (GLDM), (5) gray-level run length matrix (GLRLM), (6) gray-level size zone matrix (GLSZM), and (7) neighborhood gray-tone difference matrix (NGTDM). Standardization for the extracted features was accomplished through z-score normalization. The presentation of the study’s workflow is depicted in .
Figure 3 Study flowchart.
Pathological MVI Evaluation
The final histopathologic assessment served as the established benchmark for evaluation. Following hepatectomy, senior pathologists examined hematoxylin eosin (HE)-stained slices. In accordance with liver cancer diagnosis and treatment guidelines,Citation9 positive MVI was characterized by the presence of cancer cell nests within the vascular cavity, particularly in portal vein branches. Patients with HCC were categorized into two groups based on MVI status: those with MVI and those without. The MVI-positive group was further stratified based on the quantity and location of MVIs, distinguishing between high-grade (more than five MVI or MVI in non-tumor-adjacent tissues) and low-grade (no more than five MVI within 1 cm of tumor-adjacent tissues).
Model Establishment
The stable radiomics features that were preserved were ranked using the maximum correlation minimum redundancy method. This approach aimed to minimize correlation between features while maximizing their discriminatory power in distinguishing between outcomes (presence or absence of MVI). Subsequently, the top 20 radiomics features associated with MVI were chosen for each model. In the training group of MRI, we applied the least absolute shrinkage and selection operator along with logistic analysis to identify crucial radiomics features. To prevent overfitting, we implemented a ten-fold cross-validation model. The selected features which were listed in Supplementary Materials - Supplementary Table 2 were utilized to construct radiomics models based on CE-MRI AP images (AP model) and CE-MRI PVP images (PVP model). Finally, we combined clinical factors and radiomics features extracted from CE-MRI AP and PVP images to establish a comprehensive model (combined model) using the methodology detailed above. The relevant formulas, corresponding parameters, and construction details of the model are provided in Supplementary Materials - PART 2.
Statistical Analysis
The IBM SPSS Statistics software (version 22.0; SPSS Inc., Chicago, IL, USA) and R software (version 3.5.1; https://www.R-project.org) were utilized for conducting statistical analyses. Univariate analyses of clinical characteristics between groups with distinct MVI status in both the training and test groups were performed using the Mann–Whitney U-test or chi-squared test. Model performance assessment involved the evaluation of the area under the receiver operating characteristic curve (AUC) and indices derived from the confusion matrix. Statistical significance was established at a threshold of P < 0.05.
Results
Study Population and Baseline Characteristics
The study included 198 participants, who were randomly assigned to training (139 participants) and test (59 participants) groups. provides detailed baseline characteristics. There were no significant differences in age, gender, size, AFP level, and MVI status between the training and test groups (P > 0.05). The maximum tumor diameter was significantly greater in patients with MVI-high grade compared to those with negative or MVI-low grade, in both the training and test groups ().
Table 1 Baseline Characteristics of Patients Between the Training and Testing Cohorts
Model Construction and Evaluation
Three radiomics models were established in this study to assess the MVI grade in nodular HCC. These models were developed utilizing radiomics based on CE-MRI AP and PVP images. Additionally, a third model was created, integrating radiomics from both CE-MRI AP and PVP images along with clinical information. The sensitivity, specificity, negative predictive value, positive predictive value, accuracy, and AUC of each model in predicting MVI grade within the training and testing groups are presented in and .
Table 2 The Performance of Each Model
Figure 4 Receiver operating characteristic curves of AP, PVP and combined models in the training and test groups.
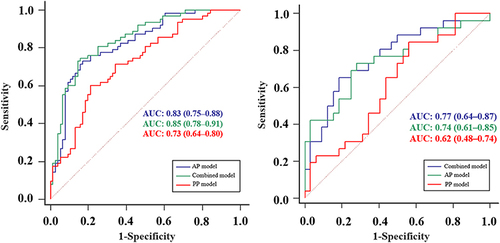
In the training group, the AUC values for the AP model, PVP model, and the combined model were 0.83 (95% CI: 0.75–0.88), 0.73 (95% CI: 0.64–0.80), and 0.85 (95% CI: 0.78–0.91), respectively. The corresponding sensitivity values were 0.73, 0.60, and 0.75, while specificity values were 0.83, 0.79, and 0.84, respectively. In the test group, the AUC values for the same models were 0.74 (95% CI: 0.61–0.85), 0.62 (95% CI: 0.48–0.74), and 0.77 (95% CI: 0.64–0.87), with sensitivity values of 0.73, 0.85, and 0.65, and specificity values of 0.72, 0.44, and 0.81. Overall, the combined model demonstrated the highest accuracy, reaching 0.80 in the training group and 0.74 in the test group. Additionally, the AP model exhibited relatively higher accuracy compared to the PVP model, with accuracy rates of 0.78 vs 0.71 and 0.72 vs 0.62 in the training and test groups, respectively.
Discussion
In this study, we formulated a radiomics model utilizing CE-MRI to predict the MVI grade in nodular HCC. The radiomics model, particularly the combined model incorporating clinical factors, exhibited superior predictive efficacy. Specifically, the AUC values for the combined model were 0.85 and 0.77 in the training and test groups, respectively. In comparison, the AUC values for the CE-MRI-based radiomics model alone were 0.83 and 0.74 in the training and test groups, respectively. These Results underscore the potential of integrating CE-MRI radiomics with clinical variables to augment the accuracy of predicting MVI in patients with nodular HCC.
Radiomics signatures hold significance in the examination of prognostic factors among patients with HCC. A preceding investigation indicated the efficacy of a radiomics model utilizing computed tomography (CT) in accurately predicting the MVI status in individuals with hepatitis B virus-associated HCC.Citation12 The established radiomics signature for MVI prediction comprised eight distinct radiomics features derived from both texture and shape characteristics. Another study developed an integrated MVI prediction model that incorporated the aforementioned radiomics features alongside wavelet-based features, with the latter exhibiting higher weight coefficients in the final models.Citation13
In the current study, discernible differences were observed in the correlation, variance, and entropy of the gray-level co-occurrence matrix (GLCM) between the MVI and non-MVI groups, as well as between high-grade and low-grade MVI subgroups. Specifically, the GLCM values in the MVI group, especially the high-grade MVI subgroup, were significantly greater compared to those in the non-MVI group. These findings align with a recent investigation utilizing a gadoxetic acid-enhanced MRI-based radiomics approach to predict MVI status in HCC.Citation14 The observed alterations in textural parameters, indicative of heightened heterogeneity, are attributed to the invasion of microvessels by HCC, thereby altering the local hemodynamic environment of the liver parenchyma surrounding the tumor and intensifying the complexity and inhomogeneity of the tumor’s internal structure.
Furthermore, our study underscores the significance of the long-range high gray emphasis (LRHGE) feature, which exhibited a substantial weighting coefficient in the prediction model. This observation is consistent with the outcomes reported by Lee et al, who employed MR texture features to predict MVI status, thereby suggesting the potential importance of LRHGE as a cross-modal texture feature in predicting MVI status.Citation15
The utilization of AFP levels has recently been employed in the development of a predictive model for MVI, in conjunction with MRI radiomics. AFP levels are posited to exert a noteworthy influence within the amalgamated model for predicting both MVI status and grade in HCC.Citation16 Our investigation underscores the efficacy of a composite model incorporating MRI radiomics and AFP levels in augmenting predictive capabilities. This finding aligns with the outcomes of the research by McHugh et al, wherein a significant association between MVI status in HCC and AFP levels was observed.Citation17 Additionally, a separate study affirmed that AFP levels serve as an independent predictor, thereby contributing to the formulation of a preoperative predictive model for MVI in HCC.Citation18 Nevertheless, it is imperative to acknowledge the variability in AFP level thresholds across different radiomics nomograms for MVI assessment, potentially rendering these models less applicable in diverse clinical contexts.
A consensus has not been established concerning the status of tumor size as an independent predictive factor in the assessment models for MVI in HCC. Two prior radiomics studies investigating MVI in HCC identified tumor size as an independent clinical factor essential for constructing radiomics nomograms.Citation19–21 In our study, the incorporation of tumor size did not enhance the predictive efficacy of the radiomics model. Consequently, tumor size was excluded from our final integrated model for predicting MVI grade in HCC. The conflicting findings regarding the effectiveness of tumor size in predicting MVI in HCC may be attributable to selection bias.
This study has certain limitations. Firstly, it was a retrospective study conducted at a single center, potentially introducing selection bias since only patients with nodular HCC who underwent hepatectomy were included. Secondly, the assessment focused solely on tumor maximum diameter, neglecting other morphological features. We aim to develop a model that integrates both morphological and textural features in future investigations. To establish more robust evidence, further validation through multicenter studies with a larger sample size is essential. Additionally, while the MRI images underwent pre-processing, the influence of using two different machines on the results remains unknown. Moreover, this study employed 2D-ROI rather than 3D-VOI.
Conclusion
In Conclusion, the integration of the radiomics model derived from CE-MRI with clinical factors offers a dependable means to predict the preoperative MVI status and grade of nodular HCC. This combination may be suggested as a promising prognostic imaging tool for individuals postoperatively diagnosed with HCC.
Abbreviations
HCC, Hepatocellular carcinoma; MVI, Microvascular invasion; AFP, α-fetoprotein CE-MRI, contrast-enhanced MR imaging; LASSO, Least Absolute Shrinkage and Selection Operator; BMI, body mass index.
Ethics Approval and Consent to Participate
This study was conducted in accordance with the declaration of Helsinki. This study was conducted with approval from the Ethics Committee of The First Affiliated Hospital of Wenzhou Medical University. Due to the retrospective nature of the study, the requirement of patient consent for inclusion was waived. Patient personal privacy and data confidentiality has been upheld.
Disclosure
The authors report no conflicts of interest in this work.
Data Sharing Statement
Date will be made available on request.
Additional information
Funding
References
- General Office of the National Health Commission. Guidelines for the diagnosis and treatment of primary liver cancer (2022 edition). J Clinl Hepa Dis. 2022;38(2):288–303.
- Rodriguez-Peralvarez M, Luong TV, Andreana L, et al. A systematic review of microvascular invasion in hepatocellular carcinoma: diagnostic and prognostic variability. Ann Surg Oncol. 2013;20(1):325–339. doi:10.1245/s10434-012-2513-1
- Sumie S, Nakashima O, Okuda K, et al. The significance of classifying microvascular invasion in patients with hepatocellular carcinoma. Ann Surg Oncol. 2014;21(3):1002–1009. doi:10.1245/s10434-013-3376-9
- Du M, Chen L, Zhao J, et al. Microvascular invasion (MVI) is a poorer prognostic predictor for small hepatocellular carcinoma. BMC Cancer. 2014;14:38. doi:10.1186/1471-2407-14-38
- Iguchi T, Shirabe K, Aishima S, et al. New pathologic stratification of microvascular invasion in hepatocellular carcinoma: predicting prognosis after living-donor liver transplantation. Transplantation. 2015;99(6):1236–1242. doi:10.1097/TP.0000000000000489
- Renzulli M, Brocchi S, Cucchetti A, et al. Can Current Preoperative Imaging Be Used to Detect Microvascular Invasion of Hepatocellular Carcinoma? Radiology. 2016;279(2):432–442. doi:10.1148/radiol.2015150998
- Banerjee S, Wang DS, Kim HJ, et al. A computed tomography radiogenomic biomarker predicts microvascular invasion and clinical outcomes in hepatocellular carcinoma. Hepatology. 2015;62(3):792–800. doi:10.1002/hep.27877
- Bakr S, Echegaray S, Shah R, et al. Noninvasive radiomics signature based on quantitative analysis of computed tomography images as a surrogate for microvascular invasion in hepatocellular carcinoma: a pilot study. J Med Imag. 2017;4(4):451–459. doi:10.1117/1.JMI.4.4.041303
- Bruix J, Sherman M. Management of hepatocellular carcinoma: an update. HEPATOLOGY. 2011;53:1020–1022. doi:10.1002/hep.24199
- Zwanenburg A, Vallières M, Abdalah MA, et al. The image biomarker standardization initiative: Standardized quantitative radiomics for high-throughput image-based Phenotyping. Radiology. 2020;295(2):328–338. doi:10.1148/radiol.2020191145
- van Timmeren JE, Cester D, Tanadini-Lang S, et al. Radiomics in medical imaging-“how-to” guide and critical reflection. Insights Imaging. 2020;11(1):91. doi:10.1186/s13244-020-00887-2
- Peng J, Zhang J, Zhang QF, et al. A radiomics nomogram for preoperative prediction of microvascular invasion risk in hepatitis B virus-related hepatocellular carcinoma.Diagn. Interv Radiol. 2018;24(3):121–127.
- Zhang X, Ruan S, Xiao W, et al. Contrast-enhanced CT radiomics for preoperative evaluation of microvascular invasion in hepatocellular carcinoma: a two-center study. Clin Transl Med. 2020.
- Ni M, Zhou XM, Lv Q, et al. Radiomics models for diagnosing microvascular invasion in hepatocellular carcinoma: which model is the best model? Cancer Imaging. 2019;19(1):60–66. doi:10.1186/s40644-019-0249-x
- Lee S, Kim SH, Lee JE, et al. Preoperative gadoxetic acid-enhanced MRI for predicting microvascular invasion in patients with single hepatocellular carcinoma. J Hepatol. 2017;67(3):526–534. doi:10.1016/j.jhep.2017.04.024
- Forner A, Llovet JM, Bruix J. Hepatocellular carcinoma. Lancet. 2012;3(79):1245‑1255.
- McHugh PP, Gilbert J, Vera S, et al. Alpha-fetoprotein and tumour size are associated with microvascular invasion in explanted livers of patients undergoing transplantation with hepatocellular carcinoma. HPB. 2010;12(1):56–61. doi:10.1111/j.1477-2574.2009.00128.x PMID: 20495646; PMCID: PMC2814405.
- Zhao H, Hua Y, Lu ZH, et al. Prognostic value and preoperative predictors of microvascular invasion in solitary hepatocellular carcinoma ≤ 5 cm without macrovascular invasion. Oncotarget. 2017;8(37):61203–61214. doi:10.18632/oncotarget.18049
- Zheng J, Chakraborty J, Chapman WC, et al. Preoperative prediction of microvascular invasion in hepatocellular carcinoma using quantitative image analysis. J Am Coll Surg. 2017;225(6):778–788. doi:10.1016/j.jamcollsurg.2017.09.003
- Ma XH, Wei JW, Gu DS, et al. Preoperative radiomics nomogram for microvascular invasion prediction in hepatocellular carcinoma using contrast-enhanced CT. Eur Radiol. 2019;29(7):3595–3605. doi:10.1007/s00330-018-5985-y
- XH M, YJ Z, Wang S, et al. Value of preoperative prediction of microvascular invasion in primary hepatocellular carcinoma by enhanced MRI texture analysis. Chin J Radiol. 2018;52(5):327–332.