
Abstract
Background
CD276 is an emerging immune checkpoint molecule that has been implicated in various cancers. However, its specific role in hepatocellular carcinoma (HCC) remains unclear. This study examined the impact of CD276 on patient prognosis and the tumor microenvironment (TME).
Methods
The Cancer Genome Atlas (TCGA) database was utilized to evaluate CD276 expression in HCC and the association between CD276 and immune indicators was also analyzed. The signaling pathways correlated with CD276 expression were identified by gene set enrichment analysis (GSEA). Different algorithms were used to assess immune cell infiltration. The effect of CD276 knockdown on HCC cell phenotypes and its relationship with macrophage polarization was examined using the cell counting kit 8 (CCK-8) assay and co-culture system.
Results
CD276 was upregulated in HCC and associated with unfavorable clinical outcomes. Hgh CD276 expression was associated with enrichment of the G2/M checkpoint, E2F targets, and mitotic spindles. CD276 expression was correlated with the infiltration of immune cells, including high level of tumor-associated macrophages and low levels of CD8+ T cells. Knockdown of CD276 decreased HCC cell proliferation and increased apoptosis. CD276 silencing in HCC cells and co-culture with THP-1–derived macrophages had a regulatory effect on macrophage polarization and macrophage-mediated cell proliferation and migration.
Conclusion
CD276 expression in HCC is associated with unfavorable clinical outcomes and may contribute to the development of an immunosuppressive microenvironment. Specifically, CD276 was associated with alterations in immune cell infiltration, immune marker expression, and macrophage polarization during HCC progression, suggesting its potential as a prognostic indicator and promising target for immunotherapeutic intervention in HCC.
Introduction
Globally, cancer remains the second leading cause of death, despite a significant decrease in mortality rates in recent years. In the United States, primary liver cancer ranks as the fifth most common cause of cancer-related deaths in men and the seventh in women.Citation1 In China, liver cancer mortality ranks fourth among all types of cancer and is the third leading cause of malignant tumor-related deaths.Citation2 Hepatocellular carcinoma (HCC), which accounts for 75–85% of primary liver cancers, is primarily caused by hepatitis viruses (type B or C), aflatoxin-containing foods, and alcohol consumption.Citation3 The diagnosis of HCC in the early stages allows for a range of treatment options, including medications, surgery, and liver transplantation, which can lead to an improved prognosis.Citation4,Citation5 However, many HCC patients have a poor prognosis due to high rates of recurrence and metastasis.Citation6,Citation7 Therefore, it is crucial to identify new biomarkers and therapeutic targets to improve our understanding of HCC pathogenesis and develop novel therapeutic approaches.
Because of the often asymptomatic nature of HCC, many patients are diagnosed at advanced stages, at which traditional treatment methods such as radiotherapy and chemotherapy are less effective. Transcatheter arterial chemoembolization (TACE) is the most common local treatment for unresectable liver cancer in the advanced stage, and recent advances in immunotherapy and targeted therapy are providing new hope for patients with liver cancer.Citation8,Citation9 Immunotherapy offers a promising approach by enhancing the body’s immune response to control and eliminate tumors. Immune checkpoint inhibitors, particularly anti-programmed cell death-1 (PD-1)/programmed cell death 1 ligand (PD-L1) therapies, have considerably improved the treatment of HCC.Citation10,Citation11 Targeting immune checkpoints such as cytotoxic T lymphocyte associated antigen 4 (CTLA-4) and PD-1 has demonstrated clinical efficacy, and therapies based on immune checkpoint inhibitors, tumor-associated antigen antibodies, chimeric antigen receptor T-cell immunotherapy, tumor vaccine therapy, or a combination of these approaches are commonly used.Citation12,Citation13 For instance, anti-PD-1 and anti-CTLA4 antibodies are effective for treating liver cancer, colon cancer, and metastatic melanoma.Citation14 The combination of atezolizumab and bevacizumab, which are both immune checkpoint inhibitors, is used as the first-line treatment for advanced HCC.Citation15,Citation16 Additionally, combination treatment with sintilimab and bevacizumab has improved overall survival and progression-free survival in patients with HBV-related HCC patients.Citation17,Citation18 However, some HCC patients do not respond well to immune checkpoint inhibitors. Therefore, it is crucial to explore new targets for immunotherapy and develop combination treatment strategies.
CD276, also known as B7-H3 or B7RP-2, is a transmembrane protein that belongs to the B7 superfamily, similar to PD-L1 (B7-H1). It is constitutively expressed on immune cells, including macrophages and antigen-presenting cells (APCs).Citation19,Citation20 Abnormal expression of CD276 has been observed in various human cancers such as melanoma, renal cell carcinoma, and ovarian cancer.Citation21 Increasing evidence suggests that members of the B7 family play crucial roles in regulating immune responses, which has prompted investigation into related pathways in tumor immunology. However, the exact role of CD276 in the development of HCC remains unclear. Further investigation is necessary to elucidate the role of CD276 in HCC.
This study investigated the expression distribution of CD276 in the immune microenvironment of HCC and evaluated its prognostic value. We used various data sources including transcriptomics, genomics, and single-cell transcriptomics to examine the role of CD276 in the development and progression of HCC and explored the underlying mechanisms.
Materials and Methods
Multiomics Data Acquisition and Processing
RNA-seq expression data and The Cancer Genome Atlas-Liver Hepatocellular Carcinoma (TCGA-LIHC) data on survival were obtained from the UCSC Xena website (https://xenabrowser.net/datapages/). Somatic mutation data were downloaded from the TCGA GDC website (https://portal.gdc.cancer.gov/) and processed using the Mutect software. Single-cell RNA-seq data were obtained from the TISCH database (http://tisch.comp-genomics.org/) and visualized in the study.
Sample Collection and Immunohistochemical Testing
For immunohistochemical (IHC) analysis, twenty HCC and paired peri-tumor tissue and an array involving 70 formalin-fixed paraffin-embedded HCC tissues were used. This study was conducted in accordance with the ethical guidelines of the Declaration of Helsinki and was approved by the institutional ethics committee of Zhongshan Hospital, Fudan University (Approval No. B2022-164). mRNA was extracted using a relevant purification kit (EZB, Suzhou, China). The tissues were sliced into 4 μm continuous sections and subjected to IHC staining and analysis. Reverse transcription and quantitative real-time PCR analyses were performed using a kit or SYBR green mix (EZB, Suzhou, China) according to the instructions of the PCR amplifier (Bio-Rad, CA, USA). For the specified genes, the following primers were used: forward primer GACTACCTCATGAAGATCCTCACC and reverse primer TCTCCTTAATGTCACGCACGATT for β-actin, and forward primer ACAGGGCAGCCTATGACATT and reverse primer GTCCTCAGCTCCTGCATTCT for CD276.
For IHC, formalin-fixed paraffin-embedded sections were deparaffinized using xylene, gradually rehydrated with ethanol, and rinsed with distilled water. The sections were then blocked with goat serum and incubated overnight with primary antibodies against CD276 (Cell Signaling Technology, 14058, diluted at 1:100), followed by incubation with a horseradish peroxidase-conjugated secondary antibody for 1h at room temperature. Finally, the sections were counterstained with hematoxylin.
Gene Set Enrichment Analysis
After dividing the samples into CD276-high and low CD276-low groups according to the median CD276 expression value, differential gene expression (DEG) analysis was performed using the “limma” R package. The logFoldChange (logFC) values obtained from the differential expression analysis were used to rank all genes. Gene set enrichment analysis (GSEA) was then performed using the GSEA function from the “clusterProfiler” R package and the HALLMARK gene set from the MSigDB database. To obtain statistically robust results, the gene set was sequenced 1000 times. Finally, the generated data were visualized using the ridgeplot function in the “clusterProfiler” R package and the gseaplot2 function in the “enrichplot” R package, which facilitated data interpretation and visualization.
Whole Exome Sequencing Data Analysis
To generate somatic mutation data for HCC patients, we used the Mutect software which was obtained from the GDC website as previously described. The patient cohort was separated into CD276-high and low CD276-low groups. The somatic mutation subsets of the two groups were extracted using the “maftools” R package with the subsetMaf function, followed by calculation of the tumor mutation load (TMB) of both groups using the TMB function for comparison purposes. The mutated genes in the two groups were further examined using the mafCompare function with the parameter minMut set to 20. Next, the estimateSignatures function with default parameters and the NMF algorithm were used to estimate the number of signatures, which were compared with 65 known updated/improved cosmic signatures using the compareSignatures function.
Estimation of Immunoinvasive Status in Tumor Samples
The immune infiltration levels in HCC samples were assessed using different methodologies. First, the ESTIMATE algorithm was used to analyze expression data from each HCC sample and calculate its immune, stromal, and tumor purity scores. This analysis was performed using the “estimate” R package. Second, the microenvironment cell population (MCP) counter algorithm via the “MCP-counter” R package was used to perform an additional evaluation of immune infiltration levels. The use of these distinct methodologies, provided a comprehensive understanding of immune infiltration patterns in the HCC samples.
Association of CD276 with the Immunosuppressive Microenvironment
To predict the immune status in HCC samples, the Tumor ImmunoDysfunction and Elimination (TIDE) algorithm was used. The output results provided us with the TIDE score, microsatellite instability (MSI) score, T cell exclusion score, and T cell dysfunction score, which were extracted and compared between the CD276-high expression group and CD276-low expression group. Statistical analysis and visualization were performed using the “ggstatsplot” R package. The correlation between CD276 expression and immune checkpoints (PDCD1, CD274, PDCD1LG2, HAVCR2, TIGIT, LAG3 CTLA4) and M2 macrophage markers (CD163, CD209, IL10, VISG4 and MS4A4A) was calculated from the TCGA-LIHC queue.
Cell Lines
HCC cell lines (PLC/PRF/5 and HCCLM3) and THP-1 cells were sourced from the Liver Cancer Institute of Zhongshan Hospital (Shanghai, China) with approval from the research ethics committee of Zhongshan Hospital. THP-1 cells were induced to differentiate into M0 macrophages by administration of 100 ng/mL phorbol-12-myristate-13-acetate (PMA; Sigma-Aldrich, St. Louis, MO, USA) for 24h. These cells were cultured in Dulbecco’s Modified Eagle Medium (DMEM; Gibco, Thermo Fisher Scientific) or RPMI1640 (Gibco, Thermo Fisher Scientific) supplemented with 10% heat-inactivated fetal bovine serum (FBS; Gibco, Thermo Fisher Scientific) and maintained at 5% CO2 and 37 °C.
Cell Transfection
Short interfering RNA (siRNA) targeting CD276 was synthesized by Genepharma (Shanghai, China). The sequence information for the siCD276 was as follows: 5’-UGAAACACUCUGACAGCAA-3’. The knockdown efficiency of siCD276 was validated by qPCR after transfection with Lipo8000 transfection reagent (Invitrogen, Thermo Fisher Scientific) according to the manufacturer’s recommendations.
Cell Function Assays
Cell viability was assessed using the Cell Counting Kit 8 (CCK-8; Beyotime, Shanghai, China) in accordance with the manufacturer’s protocol. The absorbance of each well was measured using a microplate reader at a wavelength of 450 nm. Additionally, flow cytometry was used to determine cell cycle progression and cell apoptosis rate. Migration and invasion of cancer cells were assessed using the wound healing test and Transwell assay; the latter were performed using chambers coated with 1 µg/µL Matrigel (BD Biosciences, USA) in a 24-well Transwell plate (8 μm pore size, Corning, NY, USA). The chambers were seeded with cells at a density of 1×10⁵ cells per insert and incubated at 37°C with 5% CO2 for 72 h, followed by fixing with 4% paraformaldehyde and staining with crystal violet. For the co-culture system, HCC cells (1×10⁵ cells) were placed in the upper chamber and THP-1–derived macrophage (1×10⁵ cells) were seeded into the lower chamber, and they were incubated for 72 h.
Statistical Analysis
All statistical analyses were performed using R software V4.1.2 and GraphPad Prism 7 software. The Student’s t-test was used for the comparison between two groups, and Pearson correlation coefficients were used to analyze gene expression correlations. P < 0.05 was considered statistically significant.
Results
CD276 is Upregulated in HCC and Associated with Poor Survival
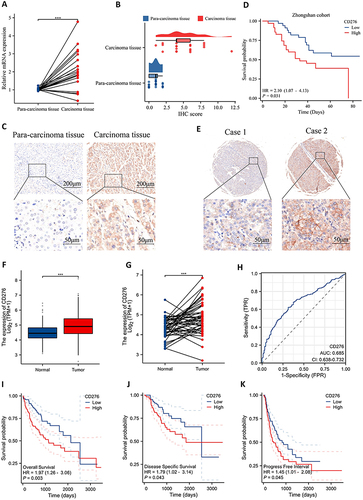
CD276 expression was analyzed in tumor tissues and adjacent tissues from 20 HCC patients. The Results showed that CD276 was significant higher in tumor tissues than in adjacent tissues (P < 0.001) (). IHC staining further confirmed the upregulation of CD276 protein expression in HCC tissues compared with that in para-carcinoma tissue (). IHC staining of an HCC tissue array (Zhongshan Cohort) showed that overall survival (OS) was significantly shorter in the CD276-high group than in the CD276-low group ( and ). The upregulation of CD276 mRNA in HCC was confirmed by analyzing 50 pairs of HCC cancer tissues and normal tissues from TCGA database ( and ). The diagnostic significance of CD276 in HCC was evaluated using the ROC curve, and the area under the curve was 0.685 (). Kaplan–Meier analysis indicated that patients with higher CD276 expression had poorer OS (P = 0.003), disease-specific survival (P = 0.043), and progression-free interval (PFI) (P = 0.045) ().
Figure 1 CD276 was upregulated in HCC and associated with poor prognosis. (A) Relative CD276 mRNA expression in HCC and para-carcinoma tissues of 20 patients. (B) Distribution and statistical analysis of CD276 IHC scores in tumor tissues and normal tissues. (C) Representative images of CD276 protein expression in HCC and para-carcinoma tissues. (D) The Kaplan–Meier survival analysis of overall survival in HCC patients from the Zhongshan cohort. (E) Representative images of CD276 protein expression in HCC tissues. (F) mRNA levels of CD276 in HCC compared with those in normal cells. (G) CD276 mRNA expression in tumor tissue and normal tissues from 50 HCC patients form TCGA database. (H) Diagnostic power of CD276 in HCC patients. (I–K) The Kaplan–Meier analysis of overall survival, progression free survival and progression free interval in HCC patients form TCGA database.
CD276 is Associated with a Malignant Phenotype and Regulates Immune-Related Pathways
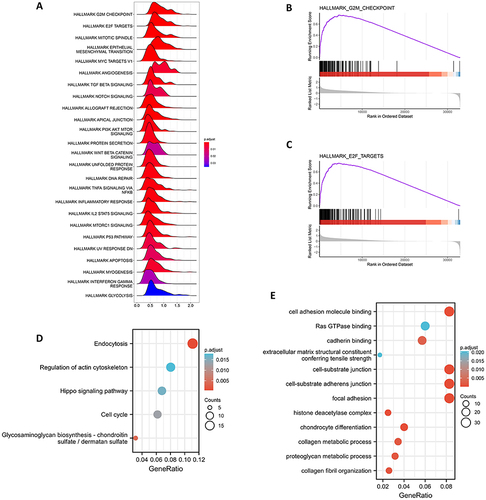
GSEA analysis showed that various carcinogenic pathways were enriched significantly in the CD276-high group, including the G2M signaling pathway, E2F signaling pathway, and mitotic spindle. Additionally, immune-related pathways such as the TNF-α, TGF-β, and IL-2/STAT5 pathways were also significantly enriched in the CD276-high group (). Kyoto Encyclopedia of Genes and Genomes (KEGG) and Gene Ontology (GO) analysis indicated that CD276 is primarily associated with endocytosis, regulation of actin cytoskeleton, Hippo signaling pathway, cell cycle, and cell adhesion molecule binding and Ras GTPase binding pathways ( and ).
Figure 2 Function and pathway enrichment analysis of CD276 in HCC. (A) The enrichment score of Hallmark pathways influenced by CD276. (B) Visualization of the top one pathway. (C) Visualization of the second pathway. (D) KEGG analysis of the top 100 genes correlated with CD276. (E) GO analysis of the top 100 genes correlated with CD276.
Comparison of Somatic Mutations Between Patients with High CD276 and Low CD276 Expression
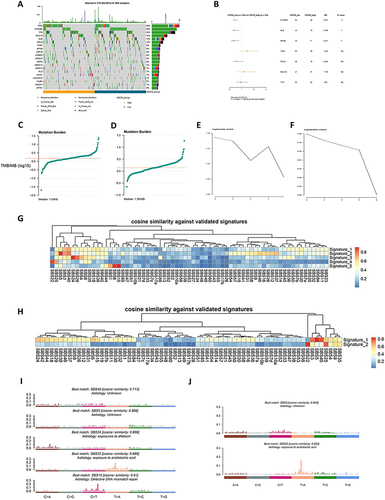
For somatic mutation analysis, TCGA-LIHC data were used to divide the population into two groups according to CD276 expression. shows the somatic mutation landscape of the two groups. The CD276-low group had a higher frequency of mutations in the CTNNB1, ALB, and APOB genes (). Conversely, the CD276-high group exhibited a higher TMB, with a median of 1.5/MB (), compared with 1.38/MB in the CD276-low group (). The cophenetic metric parameters for the CD276-high and CD276-low groups are shown in and . The mutation characteristics of the two groups were investigated by extracting five features from the CD276-high group. These features were identified as SBS40 (unknown), SBS5 (unknown), SBS24 (exposure to aflatoxin), SBS22 (exposure to aristolochic acid), and SBS15 (defective DNA mismatch repair) according to cosine similarity with the COSMIC database ( and ). By contrast, the CD276-low group only exhibited two identifying features: SBS5 (unknown) and SBS22 (exposure to aristolochic acid) ( and ).
Figure 3 Comparison of CD276-high group and CD276-low group at the genomics level. (A) The top 20 most frequently mutated genes in HCC tumor samples from TCGA database. (B) Comparison of gene mutation frequencies between the CD276-high group and the CD276-low group. (C) Distribution plot of the CD276-high group. (D) Distribution plot of the CD276-low group. (E) Selection of cophenetic metric parameter in the NMF algorithm in the CD276-high group. (F) Selection of cophenetic metric parameter in the NMF algorithm in the CD276-high group. (G) Cosine similarity between the mutational signatures of the CD276-high group and the validated COSMIC V3 signature. (H) Cosine similarity between the mutational signatures of the CD276-low group and the validated COSMIC V3 signature. (I) The identified mutational signatures of the CD276-high group. (J) The identified mutational signatures of the CD276-low group.
CD276 is Related to the Tumor Immunosuppressive Microenvironment
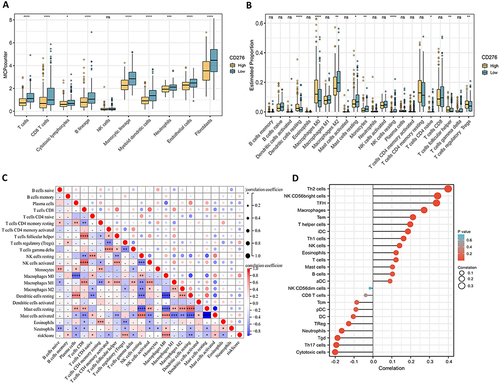
The results obtained led us to hypothesize that CD276 modulates the tumor immune microenvironment. To confirm this hypothesis, various algorithms were used as shown in . The CIBERSORT algorithm showed decreased infiltration of NK cell lineages and increased infiltration of macrophages in HCC samples with high CD276 expression (). Similarly, the MCP counter algorithm indicated a significant reduction in T cells and cytotoxic lymphocytes in the CD276 high group. The CD276-high group also exhibited lower levels of CD8+ T cells, which play a crucial role in targeting tumor cells within the tumor microenvironment (). The decreased infiltration of CD8+ T cells implies a weakened anti-tumor immune response, supporting the immunosuppressive role of CD276 in regulating the tumor microenvironment. A positive correlation between CD276 expression and the density of infiltrating macrophages was identified ( and ). Tumor-associated macrophages (TAMs) are involved in tumor-associated inflammation and contribute to cancer progression by promoting tumor cell proliferation, invasion, migration, angiogenesis, and immune suppression. Taken together, these findings provide insight into the mechanism underlying the role of CD276 in promoting tumor progression.
Figure 4 Correlation between CD276 expression and immune cell infiltration. (A) Comparison of the proportions of different types of cells estimated by the MCP-counter algorithm. (B) Comparison of immune score calculated by the ESTIMATE algorithm. (C) Correlation between CD276 and immune cell density estimated by Sangerbox. (D) Comparison of the proportions of 22 immune cell types estimated by the CIBERSORT algorithm.
The Correlation Between CD276 and Immunosuppressive Markers
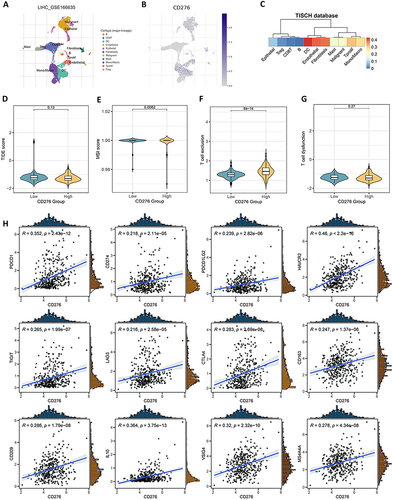
To identify the types of cells that express CD276 in the HCC tumor microenvironment, single-cell RNA-seq analysis was performed using the GSE166635 dataset. After reducing the dimensionality and annotating the cells, 11 distinct clusters were identified. Among these clusters, CD276 expression was predominantly observed in fibroblasts, endothelial cells, dendritic cells (DC), and mononuclear/macrophages (). The TIDE algorithm showed that the CD276-high group had lower MSI scores (P = 0.0062) and higher T-cell exclusion scores (P = 8×10⁻¹⁴) than the CD276-low group ( and ). This indicated that CD276 expression is associated with immune escape and resistance to immunotherapy. However, no significant correlation was observed between CD276 and the TIDE score or T cell dysfunction ( and ). Additionally, the expression of immune checkpoints (PDCD1, CD274, PDCD1LG2, HAVCR2, TIGIT, LAG3 and CTLA4) and M2 macrophage markers (CD163, CD209, IL10, VISG4 and MS4A4A) was positive correlated with CD276 expression levels ().
Figure 5 High CD276 expression is associated with indicated immunosuppression in HCC. (A) Expression pattern of CD276 in the tumor microenvironment at single-cell revolution, and cells were clustered and annotated using the TISCH database. (B) Expression of CD276 in these cells. The intensity of the red color is positively correlated with CD276 expression level. (C) Correlations between CD276 expression and various tumor signatures. (D–G) TIDE score, MSI score, T cell exclusion and T cell dysfunction in the CD276-high and CD276-low groups. (H) Correlations between the expression of CD276 and immune checkpoints (PDCD1, CD274, PDCD1LG2, HAVCR2, TIGIT, LAG3, and CTLA4) and M2 macrophage markers (CD163, CD209, IL10, VSIG4, and MS4A4A).
Knockdown of CD276 Inhibits Cell Growth and Invasion
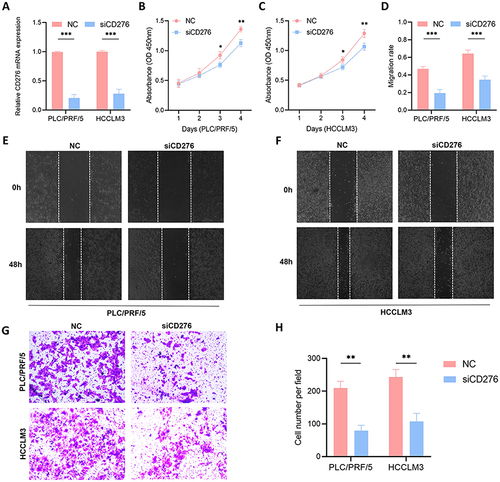
PLC/PRF/5 and HCCLM3 cells was transfected with siCD276 or siNC and subjected to CCK-8 cell proliferation assays (). Knockdown of CD276 inhibited the proliferation of HCC cells ( and ) and significantly suppressed the migration and invasion of both PLC/PRF/5 and HCCLM3 cells, as demonstrated by the wound healing assay and Transwell invasion assay ().
Figure 6 Validation of the pro-oncogenic effect of CD276 in HCC. (A) The efficiency of transfection in PLC/PRF/5 and HCCLM3 cell lines was confirmed. (B and C) CCK-8 assays of the proliferation of PLC/PRF/5 and HCCLM3 cells transfected with siCD276 or NC. (D–F) Silencing CD276 in HCC cells inhibited cell migration as determined by the wound healing assay. (G and H) Silencing CD276 in HCC cells inhibited cell invasion as determined by the Transwell assay.
Knockdown of CD276 Causes Cell Cycle Arrest and Induces Cell Apoptosis
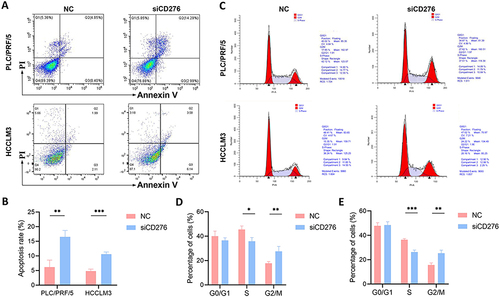
Flow cytometry was used to assess the cell apoptosis and cell cycle progression. The rate of apoptosis was significantly higher in cells with CD276 knockdown than in the control group in both PLC/PRF/5 and HCCLM3 cells ( and ). Knockdown of CD276 also significantly increased the proportion of cells in the G2/M phase, resulting in cell cycle arrest in PLC/PRF/5 and HCCLM3 cells compared with the siNC group (). These results indicate that CD276 is involved in the regulation of cell cycle progression and apoptosis, suggesting its potential as a target for cancer therapy.
Figure 7 Effects of CD276 knockdown on cell cycle progression and apoptosis. (A and B) Cell apoptosis analyses of PLC/PRF/5 and HCCLM3 cells transfected with NC or siCD276. (C) Cell cycle analyses of PLC/PRF/5 and HCCLM3 cells transfected with NC or siCD276. (D) Statistical analysis of the results of cell cycle progression assays on PLC/PRF/5 cells transfected with NC or siCD276. (E) Statistical analysis of the results of cell cycle progression assays on HCCLM3 cells transfected with NC or siCD276.
CD276 in Tumor Cells Regulates Macrophage Polarization and Macrophage-Mediated Cell Proliferation and Migration
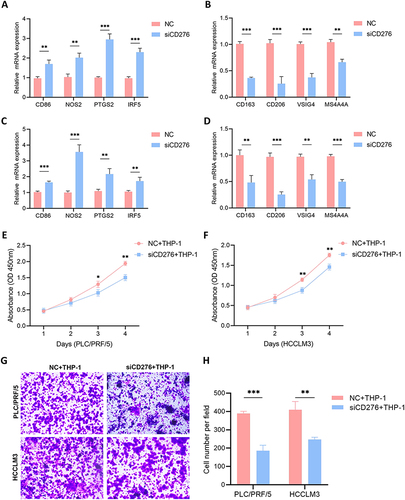
The interaction between CD276 and macrophages was examined by evaluating macrophage polarization in cells co-cultured with HCC cells in which CD276 was knocked down. Specifically, we examined the mRNA expression levels of M1 and M2 macrophage markers. Co-culture of THP-1 macrophages with CD276-silenced HCC cells significantly increased the mRNA levels of M1 macrophage markers (CD86, NOS2, IRF5, and PTGS2) compared with those in the control group ( and ). Conversely, the mRNA levels of M2 macrophage markers (CD163, CD206, VSIG4, and MS4A4A) were markedly decreased ( and ). Furthermore, we observed a substantial reduction in the tumor-promoting effects of macrophages on the proliferation and migration abilities of HCC cells following CD276 knockdown ().
Figure 8 CD276 contributed to macrophage-induced HCC progression. (A and B) Effects of co-culture of THP-1 and PLC/PRF/5 cells transfected with NC or siCD276 on the mRNA expression of M1 and M2 macrophage markers. (C and D) Effects of co-culture of THP-1–derived macrophages and HCCLM3 cells transfected with NC or siCD276 on the expression of M1 and M2 macrophage markers. (E) Effects of co-culture of THP-1–derived macrophages and PLC/PRF/5 cells with low CD276 expression on cell proliferation. (F) Effects of co-culture of THP-1–derived macrophages and HCCLM3 cells with low CD276 expression on cell proliferation. (G and H) The effects of co-culture of THP-1 derived macrophages and PLC/PRF/5 or HCCLM3 cells with low CD276 expression on migration ability.
Discussion
CD276 is overexpressed in various human cancers, including melanoma, leukemia, breast cancer, prostate cancer, ovarian cancer, pancreatic cancer, and colorectal cancer.Citation22–28 In patients with prostate cancer, CD276 overexpression increases the risk of metastasis, clinical cancer recurrence, and cancer-specific death after surgery.Citation29 Consistently, in this study, CD276 was upregulated at both the mRNA and protein levels in HCC. Abnormal expression of CD276 in HCC showed a significant association with unfavorable prognosis, indicating its potential as a marker in HCC GSEA revealed that CD276 is linked to pathways such as G2M, E2F, and epithelial-mesenchymal transition (EMT). Furthermore, high levels of CD276 were associated with various immune suppressor cells and markers, indicating a role in the formation of the HCC immune suppressive microenvironment.
CD276 exerts been shown to have carcinogenic effects through various signaling pathways. The PI3K/AKT pathway, which is associated with cancer cell invasion and immune cell function, has been implicated in CD276-mediated effects.Citation30–32 In colorectal cancer, CD276 promotes EMT by upregulating Smad1, vimentin, and N-cadherin and downregulating β-catenin and E-cadherin via the PI3K/AKT signaling pathway.Citation33 Decreased expression of CD276 reduces cell viability and proliferation rate and sensitizes breast cancer cells to AKT/mTOR inhibitors.Citation34 The NF-κB transcription factor, which is activated in response to various signals, plays a crucial role in CD276-mediated effects. Knockdown of CD276 significantly reduces the phosphorylation levels of AKT, NF-κB, and STAT3 in colorectal cancer cell, supporting the importance of the NF-κB pathway in CD276-induced VEGFA expression and cell apoptosis.Citation35 In pancreatic cancer cells, CD276 induces metastasis and cell cycle progression by upregulating TLR4 expression via the NF-κB signaling pathway.Citation36 Additionally, CD276 plays a role in tumorigenesis by exerting anti-apoptotic effects mediated by the MAPK and JAK2/STAT3 pathway.Citation37,Citation38 In this study, GSEA analysis revealed that high CD276 expression was associated with enrichment of the E2F, EMT, PI3K, NF-κB, Notch, and Wnt pathways, as well as with apoptotic processes in HCC. This finding was further supported by the results of the GO and KEGG analyses. siRNA-mediated knockdown of CD276 significantly inhibited the proliferative and invasive abilities of PLC/PRF/5 and HCCLM3 cells. Furthermore, CD276 knockdown promoted apoptosis and induced cell cycle arrest in HCC cells, as detected by flow cytometry. Taken together, these findings indicate that CD276 may promote HCC tumorigenesis and progression.
In recent years, immunotherapy has emerged as a promising strategy for the treatment of malignant tumors. However, a significant proportion of HCC patients are resistant to immune checkpoint inhibitors, which may be attributed to the strong immunosuppressive microenvironment.Citation39–41 Overexpression of CD276, a co-inhibitory molecule, has been associated with a decrease in the number of tumor-infiltrating lymphocytes (TILs) and poor clinical outcomes. In lung cancer, CD276 expression is linked to lymph node metastasis and reduced TIL numbers, indicating its role in immune evasion and tumor progression.Citation42 In ovarian cancer, CD276 expression, rather than PD-L1 expression, impairs the function of TILs.Citation43 Direct inhibition of CD8+ T cells by CD276 has been observed, and anti-CD276 therapies improves OS in mouse models.Citation43 In colorectal cancer tissues, CD276 expression is positively correlated with macrophage infiltration and inversely correlated with patient survival.Citation44 Therefore, CD276 represents a critical target for immunotherapy in the treatment of malignant cancers.
Within the tumor microenvironment, CD276 is involved the regulation of the immune system through various signaling pathways. CD276 expression can render anti-PD-1 immunotherapy ineffective in some non-small cell lung cancer patients by inhibiting CD8+ T cell function, allowing tumor cells to evade anti-tumor immunity.Citation45 Blocking CD276 using antibodies, particularly in combination with PD-1 blockade, exerts anti-tumor effects by increasing tumor-specific CD8+ T cells. It has been observed that CD276 may suppress the proliferation of CD4+ and CD8+ T cells, reduce IL-2 and IFN-γ production.Citation46 Additionally, CD276 promotes tumor progression and invasiveness by facilitating IL10 secretion and inducing immune tolerance in human breast cancer tissue.Citation47 Antibodies targeting CD276 impede the growth of brain tumors in a mouse model of breast cancer, resulting in a substantial increase in survival rates. Additionally, this intervention causes molecular-level alterations in the vascular structure and facilitates the infiltration of cytotoxic T cells into the tumor.Citation48 This indicates that the inhibitory immune microenvironment induced by CD276 enables tumors to evade immune destruction. Therefore, CD276 has become an ideal and promising target for cancer treatment. The present analysis showed that HCC patients with high CD276 expression have poorer OS and PFI. Analysis of immune infiltration indicated that the proportions of CD4+ and CD8+ T cells were significantly reduced in HCC patients with high CD276 expression. The positive correlation between CD276 and immune exhaustion indicators confirms the immune inhibitory role of CD276. The results support the hypothesis that CD276 functions as an immune checkpoint in cancer progression and may be an effective target to enhance the immune system’s ability to fight cancer.
The strong correlation between CD276 and the expression of immune marker genes suggests that CD276 regulates immune cell infiltration and interact within the tumor microenvironment. We found a positive relationship between CD276 and macrophage polarization. Macrophages are essential innate immune cells that play a crucial role in HCC progression by regulating the expression of cytokines and chemokines to promote tumor growth.Citation49 Existing research has predominantly focused on the biological effects of CD276 within tumor cells, and further exploration of its functional patterns in the complex microenvironment of HCC is needed. In this study, we investigated whether the protumorigenic effects of CD276 in HCC are mediated by its involvement in macrophage-induced progression by transfecting PLC/PRF/5 and HCCLM3 cells with NC or siCD276 and co-culturing them with THP-1–derived macrophage cells in a non-contact co-culture model using a Transwell chamber. THP-1–derived macrophages significantly promoted HCC cell proliferation and invasion. However, silencing CD276 significantly inhibited M2 marker expression in THP-1–derived macrophage while increasing M1 marker expression. Interestingly, simultaneous silencing of CD276 and co-culture with THP-1 cells further regulated macrophage polarization, inhibiting macrophage-induced cell proliferation and invasion. Collectively, the present results confirm that increased expression of CD276 promotes the proliferation and migration of HCC cells and suggest that this protumorigenic effect of CD276 is mediated by the regulation of macrophage M2 polarization, a previously unidentified mechanism. CD276 could represent a potential therapeutic target for cancers characterized by an M2 macrophage-mediated immunosuppressive tumor microenvironment.
However, this study had several limitations. Firstly, the clinical sample size was not sufficiently large. Future studies with a larger sample size are needed to validate the role of CD276 in the tumor microenvironment of HCC and its relationship with macrophage polarization. Secondly, the mechanisms by which CD276 affects macrophage polarization remain incompletely understood. In the future, it will be essential to address these shortcomings, as they are critical for the use of CD276 antibodies in animal tumor models and preclinical experiments.
Conclusion
In summary, this study performed a comprehensive analysis of the relationship between CD276 and HCC using the ESTIMATE algorithm based on TCGA database, and the results suggest that CD276 has the potential to serve as a prognostic biomarker for HCC. We found that CD276 is involved in the regulation of immune cell infiltration and interaction within the tumor microenvironment, thereby playing an important role in HCC progression. In addition, we showed that CD276 affects macrophage polarization, highlighting its involvement in TAM-induced tumor progression. All of these findings contribute to a better understanding of the role of CD276 in HCC and support the development of inhibitors or antibodies targeting CD276 as an effective strategy against HCC.
Abbreviations
HCC, hepatocellular carcinoma; TME, tumor microenvironment; GSEA, gene set enrichment analysis; APCs, antigen-presenting cells; IHC, immunohistochemistry; DEG, differential gene expression; logFC, logFoldChange; GSEA, Gene set enrichment analysis; TMB, tumor mutation load; TIDE, Tumor ImmunoDysfunction and Elimination; PMA, phorbol-12-myristate-13-acetate; DMEM, Dulbecco’s Modified Eagle Medium; FBS, fetal bovine serum; CCK-8, Cell Counting Kit 8; siRNA, short interfering RNA; OS, overall survival; TAMs, tumor-associated macrophages; EMT, epithelial-mesenchymal transition; TILs, tumor-infiltrating lymphocytes.
Ethics Approval and Informed Consent
This study was conducted in accordance with the ethical guidelines of the Declaration of Helsinki and was approved by the institutional ethics committee of Zhongshan Hospital, Fudan University (Approval No. B2022-164). Informed consent for all patients was waived by the committee due to the retrospective nature of this study. All included patients’ personal information is strictly confidential.
Disclosure
The authors declare that the research was conducted in the absence of any commercial or financial relationships that could be construed as a potential conflict of interest.
Data Sharing Statement
The data will be available from the corresponding author.
Additional information
Funding
References
- Torre LA, Bray F, Siegel RL, et al. Global cancer statistics, 2012. CA Cancer J Clin. 2015;65(2):87–108. doi:10.3322/caac.21262
- Xia C, Dong X, Li H, et al. Cancer statistics in China and United States, 2022: profiles, trends, and determinants. Chin Med J. 2022;135(5):584–590. doi:10.1097/CM9.0000000000002108
- Yang JD, Hainaut P, Gores GJ, et al. A global view of hepatocellular carcinoma: trends, risk, prevention and management. Nat Rev Gastroenterol Hepatol. 2019;16(10):589–604. doi:10.1038/s41575-019-0186-y
- Kudo M. Systemic therapy for hepatocellular carcinoma: 2017 update. Oncology. 2017;93:135–146. doi:10.1159/000481244
- Llovet JM, Real MI, Montaña X, et al. Arterial embolisation or chemoembolisation versus symptomatic treatment in patients with unresectable hepatocellular carcinoma: a randomised controlled trial. Lancet. 2002;359(9319):1734–1739. doi:10.1016/S0140-6736(02)08649-X
- Bolondi L, Burroughs A, Dufour JF, et al. Heterogeneity of patients with intermediate (BCLC B) Hepatocellular Carcinoma: proposal for a subclassification to facilitate treatment decisions. Semin Liver Dis. 2012;32(4):348–359. doi:10.1055/s-0032-1329906
- Zhou C, Liu C, Liu W, et al. SLFN11 inhibits hepatocellular carcinoma tumorigenesis and metastasis by targeting RPS4X via mTOR pathway. Theranostics. 2020;10(10):4627–4643. doi:10.7150/thno.42869
- Rizzo A, Ricci AD, Brandi G. Trans-arterial chemoembolization plus systemic treatments for hepatocellular carcinoma: an update. J Pers Med. 2022;12(11):1788. doi:10.3390/jpm12111788
- Rizzo A, Mollica V, Tateo V, et al. Hypertransaminasemia in cancer patients receiving immunotherapy and immune-based combinations: the MOUSEION-05 study. Cancer Immunol Immunother. 2023;72(6):1381–1394. doi:10.1007/s00262-023-03366-x
- Aoki T, Nishida N, Ueshima K, et al. Higher enhancement intrahepatic nodules on the hepatobiliary phase of Gd-EOB-DTPA-Enhanced MRI as a poor responsive marker of anti-PD-1/PD-L1 monotherapy for unresectable hepatocellular carcinoma. Liver Cancer. 2021;10(6):615–628. doi:10.1159/000518048
- Pinato DJ, Mauri FA, Spina P, et al. Clinical implications of heterogeneity in PD-L1 immunohistochemical detection in hepatocellular carcinoma: the Blueprint-HCC study. Br J Cancer. 2019;120(11):1033–1036. doi:10.1038/s41416-019-0466-x
- Han Y, Chen Z, Yang Y, et al. Human CD14+CTLA-4+ regulatory dendritic cells suppress T-cell response by cytotoxic T-lymphocyte antigen-4-dependent IL-10 and indoleamine-2,3-dioxygenase production in hepatocellular carcinoma. Hepatology. 2014;59(2):567–579. doi:10.1002/hep.26694
- Ruiz de Galarreta M, Bresnahan E, Molina-Sánchez P, et al. β-Catenin activation promotes immune escape and resistance to anti-PD-1 therapy in hepatocellular carcinoma. Cancer Discov. 2019;9(8):1124–1141. doi:10.1158/2159-8290.CD-19-0074
- Hack SP, Spahn J, Chen M, et al. IMbrave 050: a Phase III trial of atezolizumab plus bevacizumab in high-risk hepatocellular carcinoma after curative resection or ablation. Future Oncol. 2020;16(15):975–989. doi:10.2217/fon-2020-0162
- Rizzo A, Ricci AD, Brandi G. Immune-based combinations for advanced hepatocellular carcinoma: shaping the direction of first-line therapy. Future Oncol. 2021;17(7):755–757. doi:10.2217/fon-2020-0986
- Guven DC, Sahin TK, Erul E, et al. The association between albumin levels and survival in patients treated with immune checkpoint inhibitors: a systematic review and meta-analysis. Front Mol Biosci. 2022;9:1039121. doi:10.3389/fmolb.2022.1039121
- Weber JS, Kähler KC, Hauschild A. Management of immune-related adverse events and kinetics of response with ipilimumab. J Clin Oncol. 2012;30(21):2691–2697. doi:10.1200/JCO.2012.41.6750
- Ren Z, Xu J, Bai Y, et al. ORIENT-32 study group. Sintilimab plus a bevacizumab biosimilar (IBI305) versus sorafenib in unresectable hepatocellular carcinoma (ORIENT-32): a randomised, open-label, Phase 2–3 study. Lancet Oncol. 2021;22(7):977–990. doi:10.1016/S1470-2045(21)00252-7
- Seaman S, Zhu Z, Saha S, et al. Eradication of tumors through simultaneous ablation of CD276/B7-H3-positive tumor cells and tumor vasculature. Cancer Cell. 2017;31(4):501–515.e8. doi:10.1016/j.ccell.2017.03.005
- Wang C, Li Y, Jia L, et al. CD276 expression enables squamous cell carcinoma stem cells to evade immune surveillance. Cell Stem Cell. 2021;28(9):1597–1613.e7. doi:10.1016/j.stem.2021.04.011
- Kontos F, Michelakos T, Kurokawa T, et al. B7-H3: an attractive target for antibody-based immunotherapy. Clin Cancer Res. 2021;27(5):1227–1235. doi:10.1158/1078-0432.CCR-20-2584
- Flem-Karlsen K, Tekle C, Andersson Y, et al. Immunoregulatory protein B7-H3 promotes growth and decreases sensitivity to therapy in metastatic melanoma cells. Pigm Cell Melanoma Res. 2017;30(5):466–467. doi:10.1111/pcmr.12599
- Lichtman EI, Du H, Shou P, et al. Preclinical evaluation of B7-H3-specific chimeric antigen receptor T Cells for the treatment of acute myeloid leukemia. Clin Cancer Res. 2021;27(11):3141–3153. doi:10.1158/1078-0432.CCR-20-2540
- Bachawal SV, Jensen KC, Wilson KE, et al. Breast cancer detection by B7-H3-targeted ultrasound molecular imaging. Cancer Res. 2015;75(12):2501–2509. doi:10.1158/0008-5472.CAN-14-3361
- Shi X, Day A, Bergom HE, et al. Integrative molecular analyses define correlates of high B7-H3 expression in metastatic castrate-resistant prostate cancer. NPJ Precis Oncol. 2022;6(1):80. doi:10.1038/s41698-022-00323-2
- Miyamoto T, Murakami R, Hamanishi J, et al. B7-H3 suppresses antitumor immunity via the CCL2-CCR2-M2 macrophage axis and contributes to ovarian cancer progression. Cancer Immunol Res. 2022;10(1):56–69. doi:10.1158/2326-6066.CIR-21-0407
- Yamato I, Sho M, Nomi T, et al. Clinical importance of B7-H3 expression in human pancreatic cancer. Br J Cancer. 2009;101(10):1709–1716. doi:10.1038/sj.bjc.6605375
- Ingebrigtsen VA, Boye K, Nesland JM, et al. B7-H3 expression in colorectal cancer: associations with clinicopathological parameters and patient outcome. BMC Cancer. 2014;14:602. doi:10.1186/1471-2407-14-602
- Zang X, Thompson RH, Al-Ahmadie HA, et al. B7-H3 and B7x are highly expressed in human prostate cancer and associated with disease spread and poor outcome. Proc Natl Acad Sci U S A. 2007;104(49):19458–19463. doi:10.1073/pnas.0709802104
- Li H, Zhang B, Liu Y, et al. EBP50 inhibits the migration and invasion of human breast cancer cells via LIMK/Cofilin and the PI3K/Akt/mTOR/MMP signaling pathway. Med Oncol. 2014;31(9):162. doi:10.1007/s12032-014-0162-x
- Geraldo LH, Xu Y, Jacob L, et al. SLIT2/ROBO signaling in tumor-associated microglia and macrophages drives glioblastoma immunosuppression and vascular dysmorphia. J Clin Invest. 2021;131(16):e141083. doi:10.1172/JCI141083
- El Hage A, Dormond O. Combining mTOR inhibitors and T cell-based immunotherapies in cancer treatment. Cancers. 2021;13(6):1359. doi:10.3390/cancers13061359
- Jiang B, Zhang T, Liu F, et al. The co-stimulatory molecule B7-H3 promotes the epithelial-mesenchymal transition in colorectal cancer. Oncotarget. 2016;7(22):31755–31771. doi:10.18632/oncotarget.9035
- Nunes-Xavier CE, Karlsen KF, Tekle C, et al. Decreased expression of B7-H3 reduces the glycolytic capacity and sensitizes breast cancer cells to AKT/mTOR inhibitors. Oncotarget. 2016;7(6):6891–6901. doi:10.18632/oncotarget.6902
- Wang R, Ma Y, Zhan S, et al. B7-H3 promotes colorectal cancer angiogenesis through activating the NF-κB pathway to induce VEGFA expression. Cell Death Dis. 2020;11(1):55. doi:10.1038/s41419-020-2252-3
- Xie C, Liu D, Chen Q, et al. Soluble B7-H3 promotes the invasion and metastasis of pancreatic carcinoma cells through the TLR4/NF-κB pathway. Sci Rep. 2016;6:27528. doi:10.1038/srep27528
- Chen X, Meng X, Foley NM, et al. Activation of the TLR2-mediated downstream signaling pathways NF-κB and MAPK is responsible for B7-H3-augmented inflammatory response during S. pneumoniae infection. J Neuroimmunol. 2017;310:82–90. doi:10.1016/j.jneuroim.2017.07.002
- Liu H, Tekle C, Chen YW, et al. B7-H3 silencing increases paclitaxel sensitivity by abrogating Jak2/Stat3 phosphorylation. Mol Cancer Ther. 2011;10(6):960–971. doi:10.1158/1535-7163.MCT-11-0072
- Oura K, Morishita A, Tani J, et al. Tumor immune microenvironment and immunosuppressive therapy in hepatocellular carcinoma: a Review. Int J Mol Sci. 2021;22(11):5801. doi:10.3390/ijms22115801
- Ho DW, Tsui YM, Chan LK, et al. Single-cell RNA sequencing shows the immunosuppressive landscape and tumor heterogeneity of HBV-associated hepatocellular carcinoma. Nat Commun. 2021;12(1):3684. doi:10.1038/s41467-021-24010-1
- Murai H, Kodama T, Maesaka K, et al. Multiomics identifies the link between intratumor steatosis and the exhausted tumor immune microenvironment in hepatocellular carcinoma. Hepatology. 2023;77(1):77–91. doi:10.1002/hep.32573
- Sun Y, Wang Y, Zhao J, et al. B7-H3 and B7-H4 expression in non-small-cell lung cancer. Lung Cancer. 2006;53(2):143–151. doi:10.1016/j.lungcan.2006.05.012
- Cai D, Li J, Liu D, et al. Tumor-expressed B7-H3 mediates the inhibition of antitumor T-cell functions in ovarian cancer insensitive to PD-1 blockade therapy. Cell Mol Immunol. 2020;17(3):227–236. doi:10.1038/s41423-019-0305-2
- Mao Y, Chen L, Wang F, et al. Cancer cell-expressed B7-H3 regulates the differentiation of tumor-associated macrophages in human colorectal carcinoma. Oncol Lett. 2017;14(5):6177–6783. doi:10.3892/ol.2017.6935
- Yonesaka K, Haratani K, Takamura S, et al. B7-H3 negatively modulates CTL-mediated cancer immunity. Clin Cancer Res. 2018;24(11):2653–2664. doi:10.1158/1078-0432.CCR-17-2852
- Prasad DV, Nguyen T, Li Z, et al. Murine B7-H3 is a negative regulator of T cells. J Immunol. 2004;173(4):2500–2506. doi:10.4049/jimmunol.173.4.2500
- Liu C, Liu J, Wang J, et al. B7-H3 expression in ductal and lobular breast cancer and its association with IL-10. Mol Med Rep. 2013;7(1):134–138. doi:10.3892/mmr.2012.1158
- Bejarano L, Kauzlaric A, Lamprou E, et al. Interrogation of endothelial and mural cells in brain metastasis reveals key immune-regulatory mechanisms. Cancer Cell. 2024;42(3):378–395.e10. doi:10.1016/j.ccell.2023.12.018
- Hezaveh K, Shinde RS, Klötgen A, et al. Tryptophan-derived microbial metabolites activate the aryl hydrocarbon receptor in tumor-associated macrophages to suppress anti-tumor immunity. Immunity. 2022;55(2):324–340.e8. doi:10.1016/j.immuni.2022.01.006