
Abstract
Purpose:
We hypothesized that low estrogen levels aggravate obesity-related complications. Diet-induced obesity can cause distinct pathologies, including impaired glucose tolerance, inflammation, and organ injury that leads to fatty liver and chronic kidney diseases. To test this hypothesis, ovariectomized (OVX) rats were fed a high-fat style diet (HFSD), and we examined structural changes and inflammatory response in the kidney and liver.
Methods:
Sprague-Dawley female rats were ovariectomized or sham-operated and divided into four groups: sham-operated rats fed a normal diet (ND); ovariectomized rats fed a normal diet (OVX-ND); sham-operated rats fed a HFSD; ovariectomized rats fed a high-fat style diet (OVX-HFSD). Mean blood pressure and fasting blood glucose were measured on weeks 0 and 10. The rats were sacrificed 10 weeks after initiation of ND or HFSD, the kidney and liver were harvested for histological, immunohistochemical and immunofluorescence studies.
Results:
HFSD-fed rats presented a significantly greater adiposity index compared to their ND counterparts. Liver index, fasting blood glucose and mean blood pressure was increased in OVX-HFSD rats compared to HFSD rats at study terminal. Histological and morphometric studies showed focal interstitial mononuclear cell infiltration in the kidney of HFSD rats with mesangial expansion being greater in the OVX-HFSD rats. Both HFSD fed groups showed increased expressions of renal inflammatory markers, namely TNF-alpha, IL-6 and MCP-1, and infiltrating M1 macrophages with some influence of ovarian hormonal status. HFSD-feeding also caused hepatocellular steatosis which was aggravated in ovariectomized rats fed the same diet. Furthermore, hepatocellular ballooning was observed only in the OVX-HFSD rats. Similarly, HFSD-fed rats showed increased expressions of the inflammatory markers and M1 macrophage infiltration in the liver; however, only IL-6 expression was magnified in the OVX-HFSD.
Conclusion:
Our data suggest that some of the structural changes and inflammatory response in the kidney and liver of rats fed a HFSD are exacerbated by ovariectomy.
Introduction
Obesity-related metabolic complications such as insulin resistance, hypertension, fatty liver and kidney diseases form the major cause of morbidity and mortality globally.Citation1 The driving force of these obesity-related pathologies is inflammation since obesity is associated with a chronic low-grade inflammation.Citation2 Adipose tissue (AT) dysfunction is considered a key initiating factor and the main source of inflammation in obesity-related metabolic alterations.Citation3 Adipocyte hypertrophy leads to intracellular stress which in turn activates inflammatory pathways.Citation4 Furthermore, infiltration of macrophages in AT plays an integral role in increasing the pro-inflammatory mediators such as interleukin-6 (IL-6), tumor necrosis factor-alpha (TNF-α) and macrophage chemoattractant protein-1 (MCP-1).Citation5 The persistence release of these inflammatory mediators can adversely affect various non-adipose tissues such as heart, liver and kidney. Cardiac complications, fatty liver and nephropathy are common complications of obesity.Citation6,Citation7
Obesity unequivocally contributes to development of renal injury indirectly because obesity links with many chronic kidney diseases (CKD) risk factors such as hypertension and insulin resistance. On the other hand, obesity may also directly lead to CKD even when excluding variables such as diabetes and hypertension. Studies have demonstrated that individuals with morbid obesity develop proteinuria with changes to the renal architecture such as podocyte hypertrophy, mesangial expansion, glomerular enlargement, and focal segmental glomerulosclerosis in the absence of diabetes and hypertension.Citation8,Citation9 Previous reports have shown a strong correlation between renal lipid accumulation and increased inflammatory cytokines such as IL-6 and TNF-α that play a key role in mediating the deleterious changes in kidney function.Citation10,Citation11
The liver frequently develops obesity-related complications, and non-alcoholic fatty liver (NAFLD), ranging from benign steatohepatitis to non-alcoholic steatohepatitis (NASH), represents the most common hepatic disorder in adults with morbid obesity.Citation12 NAFLD is supposed to be a hepatic symptom of metabolic disorder and is closely associated with increased cardiovascular risk as well as insulin resistance. Free fatty acid delivery from overnutrition or increased free fatty acid liberation from white AT due to increased lipolysis accounts for almost two-third of fat accumulation in the liver.Citation13 Elevation in triglyceride, inflammation and mitochondrial dysfunction levels in obesity can lead to the progression of non-alcoholic fatty liver disease in obesity.Citation14–Citation16 Thus, structural changes, lipid accumulation, polarization of macrophages and increased inflammatory cytokines in the liver are integral in assessing cardiovascular risk factors.
Estrogen promotes subcutaneous fat accumulation, however estrogen deficiency in menopause or ovariectomy in experimental animals appears to favour the incidence of metabolic syndrome, starting with facilitation of visceral AT deposition.Citation17 Adipose tissue pathogenicity distinctly differs according to location of AT deposition (visceral vs subcutaneous).Citation18 Visceral fat is a highly metabolic tissue and is apparently more susceptible to lipolysis than subcutaneous AT.Citation19 Excess accumulation of AT in the visceral compartment seems to independently predict impaired glucose tolerance,Citation20 increased blood pressureCitation21,Citation22 and dyslipidemia.Citation23,Citation24 Moreover, visceral AT is associated with higher production of inflammatory cytokines including TNF-α,Citation19,Citation25 IL-6 and C-reactive proteinCitation26 which appear to be the common denominator of obesity-related pathologies such as nephropathy and fatty liver.
Reports have shown that estrogen has a protective effect against the progression of NAFLD and renal diseases in both humans and in mice.Citation27,Citation28 Furthermore, absence of estrogen as in menopause or ovariectomy induces and accelerates the development of obesity-related pathologies including NAFLD and renal diseases.Citation27,Citation29 The protective effects of estrogen may be linked to its anti-inflammatory effect although some data show that the effects of estrogen on the inflammatory process are contradictory. The inflammatory pathway is downstream of many signaling pathways which are influenced by diet, sex and aging potentially masking the distinct effects of estrogen on inflammation.Citation30,Citation31 Estrogen has been reported to suppress inflammation by down-regulation of pro-inflammatory molecules such as cytokines and adhesion molecules.Citation32,Citation33 Nonetheless, other clinical studies have shown estrogen as a pro-inflammatory modulator in autoimmune diseases.Citation34 Studies investigating the relationship between obesity and development of inflammation in renal and liver lesions in conditions of low levels of estrogen are scarce. The present study was designed to investigate the structural changes and inflammatory status in the kidney as well as in the liver of female rats fed a HFSD in the absence of ovarian hormones. In addition, we evaluated nuclear factor kappa-light-chain-enhancer of activated B cells (NF-κB) expressions, and macrophage polarization from M2 to M1 phenotype in the kidneys and liver of these animals.
Materials and Methods
Chemicals
Phosphate buffered saline, buffered 10% formalin, Triton-X 100 Tween 20, tri-sodium citrate dehydrate and acid alcohol were purchased from Sigma-Aldrich (Steinheim, Germany), ethanol (HmbG Chemicals, Germany), xylene (Fisher Scientific, USA), hematoxylin and eosin (BDH, Germany), DPX (R&M Chemicals, UK), absolute propylene glycol solution and glycerin jelly M-12 (Rowley Biochemical Inc., USA), Peroxidazed 1 (BioCare Medical, USA), Blocking One (Histo Nacalai Tesque, Inc, Japan), ImmunoCruz ABC Staining and Ultra-Cruz Mounting Media were obtained from Santa Cruz Biotechnology (Santa Cruz, CA, USA). All other chemicals used were of analytical grade.
Experimental Design and Induction of Obesity-Induced Hypertension in Animals
The present animal study followed the guidelines stated in the “Guide for the Care and Use of Laboratory Animals” (National Academies Press, Washington, 2011), and all experimental procedures were approved by the Faculty of Medicine Institutional Animal Care and Use Committee (FOM IACUC), University of Malaya, Malaysia (Ethics Reference Number: 2014–05-07PHAR/R/NAA). Female Sprague Dawley rats weighing 80–100 g (n = 48, 3 weeks old) were purchased from Invivos Pte. Ltd., Singapore and were housed in standard cages (3 animals per cage) placed on ventilated racks that provided filtered air directly to the cage, in a temperature- and humidity-controlled satellite animal facility (21–23°C and 40–60% relative humidity) with a 12-h:12-h light-dark cycle, food and water available ad libitum. The satellite animal facility is approved by IACUC and accredited by the Association for Assessment and Accreditation of Laboratory Animal Care International (AAALAC). One week after acclimatization, female rats were either sham-operated (n = 24) or bilaterally ovariectomized (n = 24) to eliminate the endogenous sex steroid hormones as previously described.Citation35,Citation36 For the ovariectomy, the animals were anesthetized with a mixture of 5 mg kg−1 of xylazine and 50 mg kg−1 of ketamine intraperitoneally (Xylazil-20 and Ketamil, Troy Laboratories Pty Limited, Australia). Short dorso-lateral incisions were then made, and the ovaries were gently removed. After surgery, the muscles and skin layers were individually sutured. Diclofenac sodium (25 mg kg−1, Fenac, L.B.H. Laboratory, Thailand) and ceftriaxone sodium (25 mg kg−1, Trixone, L.B.H. Laboratory, Thailand) were administered intramuscularly to provide further analgesia and to prevent infection respectively. In the sham-operated animals, the same surgical procedures were applied, but the ovaries were not removed. Rats were randomly assigned to four groups after two weeks of recovery and were fed with normal diet (ND) (Teklad Research Diet, Harlan laboratories, Madison, WI, USA) or high-fat style diet based on the following assigned groups: (1) sham-operated ovary-intact animals fed a ND, n = 12 (2) sham-operated ovary-intact animals fed a high-fat style diet (HFSD), n = 12 (3) ovariectomized animals (OVX) fed a ND, n = 12 and (4) ovariectomized animals (OVX) fed a HFSD, n = 12 as previously described.Citation37 Obesity was induced by feeding the rats with a high-fat style diet that consisted of 3.4 kcal g−1 of total gross energy with calories from protein (32.3% kcal), saturated fat (42.6% kcal), carbohydrate (27.8% kcal) and sodium (0.6g/100g) for ten weeks. Origin and composition of normal and high-fat style diet can be found in Supplementary File.
Measurement of Mean Blood Pressure and Fasting Blood Glucose
Tail-cuff method (CODA, Kent Scientific Corporation, Torrington, CT, USA) was utilized to measure initial and final mean blood pressure (MBP) on weeks 0 and 10 respectively. Animals were fasted for 12 h a day after measurement of MBP and initial as well as final fasting blood glucose (FBG) levels were detected using a glucometer (Accu- Chek®Performa, Roche Diagnostics, Germany).
Animal Tissue Collection and Kidney, Liver and Adiposity Index Measurement
At the end of the study, rats were euthanized via overdose administration of α-chloralose-urethane anesthesia. Next, kidneys, liver and total abdominal adipose tissues were excised, rinsed in phosphate-buffered saline (pH 7.4, Sigma-Aldrich, Germany), patted dry and weighed to determine the percentage of kidney index [100 × kidney weight (g)/body weight (g)], percentage of liver index [100 × liver weight (g)/body weight (g)] and percentage of adiposity index [100 × total abdominal adipose tissue weight (g)/body weight (g)] at the terminal of the study. Then, harvested liver tissues were embedded in an optimal cutting temperature (OCT) compound and formation of bubbles were prevented. The OCT embedded block was wrapped in aluminum foil and stored at −80°C for later cryosectioning for Oil Red O staining. The kidneys and remaining liver were fixed in a 10% buffered formalin solution (Sigma Aldrich, Germany, HT-501128) for histological analysis, immunohistochemical and immunofluorescence staining.
Histopathological Analysis
Periodic Acid–Schiff (PAS) Staining
Formalin-fixed kidney tissues were embedded in paraffin and sliced into 5-µm sections. The histological sections were dewaxed in xylene, rehydrated through an ethanol series, and stained with Periodic acid-Schiff’s reaction-hematoxylin as described previously.Citation38 The slides were examined and graded (modified from Dobrian et alCitation39 criteria) in a blinded fashion by a pathologist assessing the glomerular changes. Images were obtained under bright field LEICA DM 2000 microscope with the utilization of LEICA ICC50 HD camera (Leica Microsystems, Germany).
Hematoxylin and Eosin (H&E) Staining
Formalin-fixed liver tissues were processed using an automated tissue processor (Leica, Germany), embedded in paraffin, sliced into 5-µm tissue sections, and sections were dewaxed in xylene, rehydrated through an ethanol series and eventually stained with hematoxylin and eosin (H&E). Histological changes were assessed by brightfield microscopy (LEICA DM 2000) and representative pictomicrographs were obtained using a LEICA ICC50 HD camera (Leica Microsystems, Germany).
Oil Red O Staining
Frozen liver tissues were cryosectioned, and sections were immersed in absolute propylene glycol for 2 minutes and stained with Oil Red O for an hour. Then, the sections were differentiated in 85% propylene glycol solution for 1 minute, stained with hematoxylin, differentiated with acid alcohol and neutralized in weak ammonia water, and eventually mounted with glycerin jelly. Images were obtained under bright field LEICA DM 2000 microscope with the utilization of LEICA ICC50 HD camera (Leica Microsystems, Germany) and the hepatic mean intensities of Oil Red O-stained positive areas were quantitatively evaluated by using Image Pro-Premier version 9.1 (Media Cybernetics, Rockville, MD).
Immunohistochemical Staining of Inflammatory Mediators in Kidneys and Liver
Kidney and liver tissue sections were deparaffinized by immersion in xylene and rehydrated through an ethanol series. The sections were then incubated in a microwave in 0.01 M citrate buffer (pH 6.0, 10 min, 95–100°C) for antigen retrieval. To eliminate endogenous peroxidase activity, the sections were incubated with 3% hydrogen peroxide solution (Peroxidazed 1; Biocare Medical, Pacheco, California). Following incubation with a blocking solution (Blocking One Histo; Nacalai Tesque, Inc, Japan) for 1 h to prevent non-specific binding, the sections were incubated with primary rabbit IL-6 (1:200, sc-1265), MCP-1 (1:200, sc-1785) or TNF-α antibodies (1:200, sc-52746, Santa Cruz Biotechnology, California, USA) overnight at 4°C. The sections were subsequently washed and incubated with appropriate HRP conjugated polyclonal biotinylated secondary antibodies (1:400, sc-2004, Santa Cruz Biotechnology, California, USA and #P0447, Dako, Denmark). The sections were visualized with 3,3ʹ-diaminobenzidine tetrahydrochloride (DAB) substrate, counter-stained with hematoxylin and examined by brightfield microscopy (LEICA DM 2000) and images were obtained with a LEICA ICC50 HD camera (Leica Microsystems, Germany). All the immunohistochemical expressions were quantitatively evaluated by using Image Pro-Premier version 9.1 (Media Cybernetics, Rockville, MD).
Detection of M1-M2 Infiltration in Kidneys and Liver by Immunofluorescence
After deparaffinized, rehydration and antigen retrieval, tissue sections were cooled at room temperature and rinsed in PBS for 5 minutes. After blocking with a blocking solution (Blocking One Histo; Nacalai Testique, Japan) for 1 h to prevent non-specific binding, the sections were incubated with primary rabbit anti-CD68 antibody (#ab125212) as M1 marker and rabbit anti-CD163 antibody as M2 marker (#ab182422) (Abcam, Cambridge, USA) overnight at a dilution of 1:200 in 5% BSA at 4°C. The sections were subsequently incubated with secondary antibody, Alexa-Fluor 647—conjugated goat anti-rabbit IgG (H+L) cross-adsorbed (A-21244) and Alexa-Fluor 488—conjugated donkey anti-rabbit IgG (H+L) highly cross-adsorbed (A-21206) secondary antibodies (Thermo Scientific, USA) respectively at a dilution of 1:400 in 5% BSA for 1 h at room temperature. Sections were washed with PBS prior and after the incubation of secondary antibodies. After washing, sections were mounted in UltraCruz Mounting Media (DAPI) (Santa Cruz, CA, USA). Finally, the slides were then observed under a fluorescence microscope (Olympus BX61, USA) and photomicrographs were taken. All the intensities of immunofluorescence expressions were quantitatively evaluated by using Image Pro-Premier version 9.1 (Media Cybernetics, Rockville, MD).
Immunofluorescence Staining of Nuclear Factor Kappa-Light-Chain-Enhancer of Activated B Cells (NF-κB) and Phosphorylated NF-κB (p-NF-κB) in Kidneys
The deparaffinized, rehydrated, antigen retrieved sections were incubated with 0.8% of NaCl and followed by PBS for 5 minutes each. Next, slides were incubated in 0.1% Triton-X 100 in PBS for 30 minutes and followed by incubation in PBS thrice. Then, sections were incubated in a blocking solution of 2% BSA in PBS with 0.05% Tween 20 for 30 minutes. Primary antibody was diluted with blocking solution at dilution factor of 1:200 and sections were incubated in the diluted first primary antibody namely, p-NF-κB p65 (ser 536, sc-101752, Santa Cruz Biotechnology, California, USA) overnight at 4°C. The next day, sections were washed with blocking solution twice and then followed by incubation with corresponding conjugated first secondary antibody, namely Alexa-Fluor 488—conjugated donkey anti-rabbit IgG (H+L) highly cross-adsorbed (A-21206, Thermo Scientific, USA) at a dilution of 1:200 in blocking solution at room temperature in dark for 60 minutes. Thereafter, sections were washed in blocking solution twice and followed by incubation in second primary antibody, namely NF-κB p65 antibody (sc-8008, Santa Cruz Biotechnology, California, USA) that was diluted in blocking solution at dilution factor of 1:200 for 60 minutes at room temperature. Then, the sections were washed with the blocking solution twice and followed by incubation with conjugated second secondary antibody, namely Alexa-Fluor 647—conjugated goat anti-mouse IgG (H+L) cross-adsorbed secondary antibody (A-21235, Thermo Scientific, USA) for 60 minutes. Next, sections were mounted with UltraCruz Mounting Media (DAPI) (Santa Cruz, California, USA) and edges of the cover slip were sealed by using clear nail polish. Fluorescent signals were visualized by using a confocal laser scanning fluorescence microscope (Leica TCS SP5 II, Leica Microsystems, Wetzlar, Germany) with argon/krypton laser and all the intensities of immunofluorescence expressions were quantitatively evaluated by using Image Pro-Premier version 9.1 (Media Cybernetics, Rockville, MD).
Statistical Analysis
Data are expressed as means ± S.E.M, and graphical as well as statistical analyses were undertaken using IBM SPSS statistical software package (IBM SPSS Statistics for Windows; Version 23.0, IBM Corporation, Armonk, NY, USA). Kidneys, liver and adiposity indices, and quantitative evaluation of the immunohistochemical as well as immunofluorescence stainings’ intensities were analyzed using univariate two-way ANOVA, followed by a Bonferroni post hoc test with statistical significance defined as P < 0.05 for the comparison between groups. MBP as well as FBG were analyzed using univariate three-way repeated measures ANOVA followed by a Bonferroni post hoc test with statistical significance defined as P < 0.05 for the comparison between groups.
Results
Adiposity and Kidney Indices
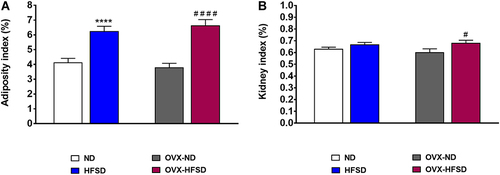
shows that the adiposity index was greater by 75% (P < 0.001) in OVX-HFSD rats and 51% (P < 0.001) in HFSD rats compared to the OVX-ND rats and ND rats respectively. There was no difference in adiposity index among ovary intact HFSD fed rats and ovariectomized HFSD fed rats. Kidney index was slightly increased in OVX-HFSD rats compared to OVX-ND rats by 13% (P < 0.05) (). However, kidney indices were statistically indistinguishable in HFSD rats and OVX-ND rats compared to ND rats.
Figure 1 Adiposity (A) and kidney indices (B) of normal diet (ND)- and high fat style diet (HFSD)-fed rats with and without ovariectomy (OVX). Data are expressed as mean ± SEM (n = 12 per group). ****P < 0.001 vs. ND; #P < 0.05 or ####P < 0.001 vs. OVX-ND.
Fasting Blood Glucose and Mean Blood Pressure
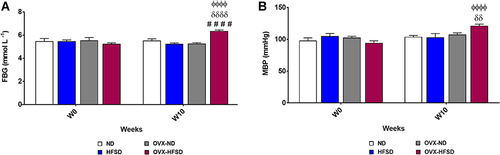
and show the initial (week 0) as well as final (week 10) fasting blood glucose (FBG) and mean blood pressure (MBP) of all the groups respectively. FBG was increased significantly in only OVX-HFSD rats as compared to OVX-ND and HFSD rats (both P < 0.001) by 20.9% and 21.1% respectively on week 10. Furthermore, the FBG on week 10 was greater (P < 0.001) than the FBG on week 0 in OVX-HFSD rats by 21.4%. Similarly, a significant increase (P < 0.01) in MBP was observed in only OVX-HFSD rats as compared to HFSD rats at the end of the study by 17.8%. Similar to FBG, the MBP on week 10 was greater (P < 0.001) than the MBP on week 0 in OVX-HFSD rats by 28.4%.
Figure 2 Fasting blood glucose (A) and mean blood pressure (B) of high-fat style diet (HFSD)-fed intact and ovariectomized rats (OVX). Data are expressed as mean ± SEM (n = 12 per group). ####P < 0.001 vs. OVX-ND, δδP < 0.01 or δδδδP < 0.001 vs. HFSD, ϕϕϕϕP < 0.001 vs. week 0 of the corresponding group. FBG, fasting blood glucose; MBP, mean blood pressure.
Histopathological Changes in Rats’ Kidney and Liver
PAS Staining
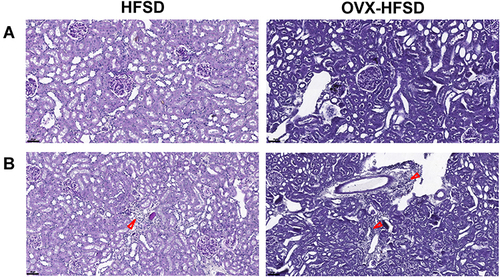
and illustrate the PAS-stained kidneys of HFSD-fed rats, with and without ovariectomy. Morphometric grading of the PAS-stained kidneys of ND rats and OVX-ND rats revealed a normal-appearing glomerulus (Grade 0). Subtle structural changes in the form of mild expansion of mesangial matrix and no occlusion in the glomerular capillaries (Grade 1) were detected in kidneys of HFSD rats whereas greater expansion of the mesangial matrix (Grade 2) was observed in kidneys of OVX-HFSD rats (). In addition, focal interstitial mononuclear cell infiltration was observed in both HFSD fed groups (HFSD and OVX-HFSD) and was absent in both ND groups (ND and OVX-ND) ().
Figure 3 Mesangial expansion (A) and mononuclear cell infiltration (B) of PAS stained kidneys of high fat style diet (HFSD)-fed rats, with and without ovariectomy (OVX) (n = at least 4 per group). Red arrow indicates the mononuclear cell infiltration. Magnification: 400×.
H&E Staining
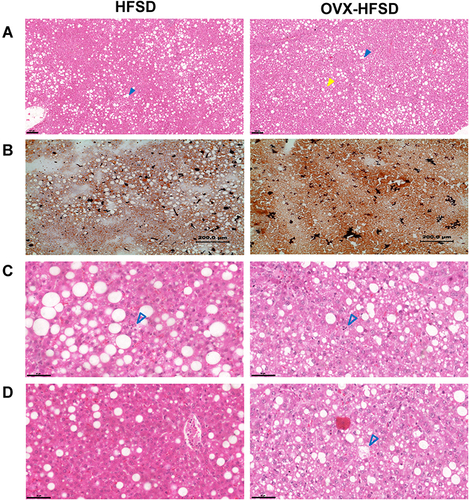
, and illustrate H&E-stained liver of intact and ovariectomized rats fed with HFSD. Both macrovesicular and microvesicular steatosis were observed in the liver of rats fed the HFSD (). Macrovesicular steatosis is characterized by hepatocytes containing a single large vacuole of fat filling up the hepatocyte which engorge the hepatocyte thus displacing the nucleus towards the cell’s periphery. In contrast, microvesicular steatosis is characterized by the presence of numerous small vesicles of fat in hepatocytes without engorgement of the hepatocytes. Hepatocellular steatosis (microvesicular and macrovesicular) was more extensive in OVX-HFSD rats’ liver as compared to HFSD rats’ liver (). Hepatocellular steatosis was not detected in the liver of ND fed rats. Lobular infiltrates were observed in the liver of HFSD and OVX-HFSD rats to the same degree (). Hepatocytes changes, namely hepatocellular ballooning, was observed in the liver of OVX-HFSD rats only and was absent in the other experimental groups ().
Figure 4 Hepatic steatosis (H&E stained) (A), lipid accumulation (Oil Red O stained) (B), lobular infiltrates (C), hepatocytes ballooning (D) in H&E stained liver of high fat style diet (HFSD)-fed rats, with and without ovariectomy (OVX) (n = at least 4 per group). Magnification: 8× (A), 10× (B). Yellow color closed arrow indicates microvesicular steatosis and blue color closed arrow indicates macrovesicular steatosis.
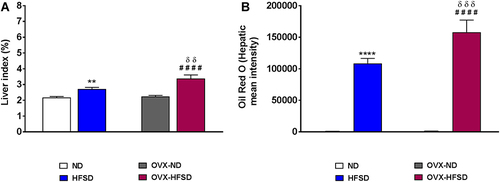
Oil Red O Staining and Liver Index
illustrates Oil Red O staining in the liver of intact and ovariectomized rats fed with HFSD. The red and orange colors indicate lipid while the blue color indicates nuclei. Lipid droplets visualized by Oil Red O staining were evident in liver of both HSFD and OVX-HFSD rats and the stained areas were apparently large, while lipid droplets were not present in liver of the other experimental groups, ie, intact and ovariectomized ND-fed rats. and show the quantification of mean pixel intensities of Oil Red O staining in liver; and liver index of ND- and HFSD-fed rats with and without ovariectomy respectively. The mean pixel intensities of Oil Red O staining in liver of HFSD and OVX-HFSD rats were significantly increased (P < 0.001) compared to that of their control counterparts and mean pixel intensities of Oil Red O staining in liver of OVX-HFSD rats were significantly greater (P < 0.005) in OVX-HFSD rats. Similarly, liver index revealed the same trend as the lipid content in which the liver index was increased significantly in both HFSD (P < 0.01) and OVX-HFSD rats (P < 0.005) by 25% and 51% respectively compared to that of their control ND rats. Additionally, the liver index in OVX-HFSD rats was significantly higher (P < 0.01) than that of HFSD rats by 24%.
Figure 5 Quantification of mean pixel intensities of Oil Red O staining in liver (A) and liver index (B) of normal diet (ND)- and high fat style diet (HFSD)-fed rats with and without ovariectomy (OVX) (n = 12 per group). **P < 0.01 or ****P < 0.001 vs. ND; ####P < 0.001 vs. OVX-ND; δδP < 0.01 or δδδP < 0.005 vs. HFSD.
Expression of Inflammatory Mediators in Kidneys
Expression of IL-6 in Kidney
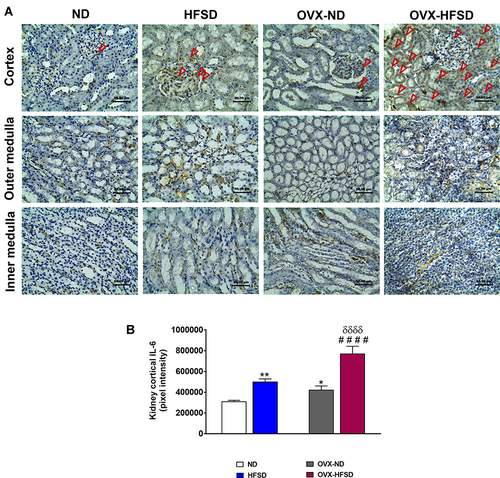
and demonstrate the immunohistochemical staining of IL-6 in different regions of experimental rats’ kidneys and quantitative mean pixel intensities of IL-6 staining in the cortex of all the experimental groups, respectively. IL-6 proteins were significantly expressed in all kidney regions and predominantly in the cortex of both the intact HFSD and OVX-HFSD rats as compared to kidneys of intact ND and OVX-ND respectively. However, at the outer medulla and the inner medulla, the expression of IL-6 was moderate and mild, respectively. The quantification of mean pixel intensities of IL-6 was significantly higher in the cortex of HFSD as well as OVX-HFSD rats’ kidney compared to their control counterparts by 61% (P < 0.01) and 82% (P < 0.001) respectively (). Of note, OVX-ND rats revealed higher IL-6 mean pixel intensities in the cortex region of the kidney compared to ND rats by 36% (P < 0.05). Furthermore, IL-6 inflammatory marker’s mean pixel intensity in the cortex region of OVX-HFSD fed rats’ kidney was higher by 54% (P < 0.001) compared to that of HFSD rats’ kidney. Mild staining of IL-6 was observed at the cortex as well as outer and inner medulla regions across all the ND experimental groups ().
Figure 6 Immunohistochemical staining of IL-6 in kidneys in the cortex, outer medulla and inner medulla regions (A) and quantification of mean pixel intensities of kidney cortical IL-6 staining (B) of normal diet (ND)- and high fat style diet (HFSD)-fed rats, with and without ovariectomy (OVX) (n = 12 per group) at 40X magnification. Dark red arrow indicates the positive immunohistochemical stainings. *P < 0.05 or **P < 0.01 vs. ND; ####P < 0.001 vs. OVX-ND; δδδδP < 0.001 vs. HFSD.
Expression of TNF-α in Kidney
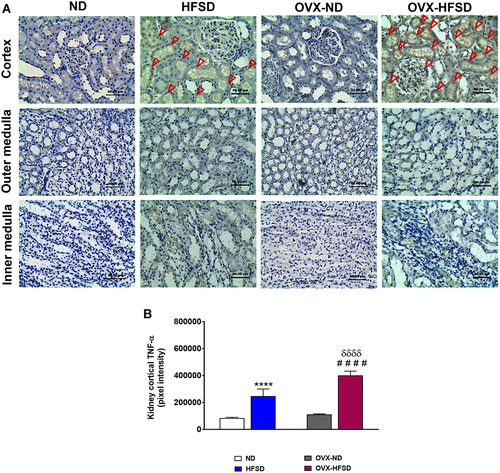
and reveal the immunohistochemical staining and quantitative mean pixel intensities of TNF-α in different regions of experimental rats’ kidney respectively. Distribution of TNF-α protein levels was higher distinctly in the cortex region but was milder in the outer medulla region in both HFSD groups of rats compared to ND groups of rats. By contrast, lesser distribution of TNF-α proteins were observed at the inner medulla region in both HFSD groups of rats compared to ND groups of rats (). The quantification of mean pixel intensities of TNF-α was significantly increased in the cortex of HFSD as well as OVX-HFSD rats compared to their control counterparts by 190% and 260% (both P < 0.001) respectively (). There was a markedly higher TNF-α inflammatory markers’ mean pixel intensities in the cortex region of OVX-HFSD rats’ kidney by 62% (P < 0.001) compared to that of in the cortex region of HFSD rats’ kidney. Very little TNF-α distribution was observed at the cortex region while none was found at the outer and inner medulla in all ND experimental groups ().
Figure 7 Immunohistochemical staining of TNF-α in kidneys in the cortex, outer medulla and inner medulla regions (A) and quantification of mean pixel intensities of kidney cortical TNF- α staining (B) of normal diet (ND)- and high fat style diet (HFSD)-fed rats, with and without ovariectomy (OVX) (n = 12 per group) at 40X magnification. Dark red arrow indicates the positive immunohistochemical stainings. ****P < 0.001 vs. ND; ####P < 0.001 vs. OVX-ND; δδδδP < 0.001 vs. HFSD.
Expression of MCP-1 in Kidney
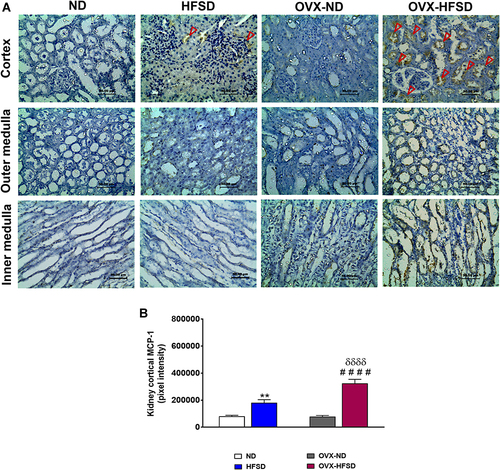
and reveal the immunohistochemical staining of MCP-1 in different regions of the kidney of experimental rats and quantitative mean pixel intensities of MCP-1 staining in the cortex of all the experimental groups, respectively. Mild distribution of MCP-1 proteins was observed at the cortex region while none was found at the outer and inner medulla across all experimental groups fed with HFSD (). Nevertheless, very slight distribution of MCP-1 was observed at the inner medulla region of the kidney of OVX-HFSD rats. The quantification of mean pixel intensities of MCP-1 was significantly increased in the cortex of HFSD as well as OVX-HFSD rats’ kidney compared to their control counterparts by 124% and 316% (both P < 0.001) respectively (). There was a markedly higher mean pixel intensity of MCP-1 in the cortex region of OVX-HFSD rats’ kidney by 79% (P < 0.001) compared to that in the cortex region of HFSD rats’ kidney. Very little or no distribution of MCP-1 was observed in all the kidney regions, namely, cortex, outer and inner medulla across all the ND experimental groups ().
Figure 8 Immunohistochemical staining of MCP-1 in kidneys at the cortex, outer medulla and inner medulla regions (A) and quantification of mean pixel intensities of kidney cortical MCP-1 staining (B) of normal diet (ND)- and high fat style diet (HFSD)-fed rats, with and without ovariectomy (OVX) (n = 12 per group) at 40X magnification. Dark red arrow indicates the positive immunohistochemical stainings. **P < 0.01 vs. ND; ####P < 0.001 vs. OVX-ND; δδδδP < 0.001 vs. HFSD.
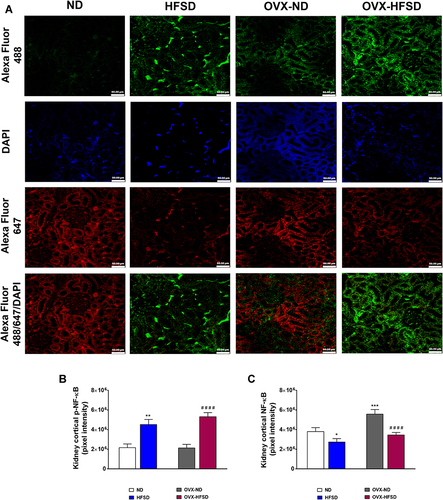
p-NF-κB Expression Was Increased in Kidneys of Both HFSD-Fed Intact and Ovariectomized Female Rats
illustrates the double immunofluorescence staining of p-NF-κB (green colored fluorescence) and NF-κB (red colored fluorescence) in the renal cortical region of all the experimental groups. and displays quantification of mean pixel intensities of NF-κB, and phosphorylated NF-κB respectively in the cortical region of kidney in ND- and HFSD-fed rats, with and without ovariectomy. In both HFSD-fed rats, the distribution of phosphorylated NF-κB proteins in the kidney increased by 120% (HFSD; P < 0.001) and 147% (OVX-HFSD; P < 0.001) compared to their respective control groups of rats (). By contrast, mean pixel intensities of total NF-κB in kidney was reduced in both HFSD-fed groups of rats by 30% (HFSD; P < 0.05) and 40% (OVX-HFSD; P < 0.001) compared to their corresponding control groups of rats (). On the other hand, the mean pixel intensity of total NF-κB in the kidney was increased in OVX-ND compared to ND by 47% (P < 0.005). Of note, there was no significant difference in mean pixel intensities of total NF-κB as well as phosphorylated NF-κB in the kidney between HFSD and OVX-HFSD rats.
Figure 9 Double immunofluorescence staining of p- NF-κB (indicated in green color) and NF-κB (indicated in red color) (A) in kidneys, and quantification of mean pixel intensities of kidney cortical p-NF-κB (B) and NFκB (C) of normal diet (ND)- and high fat style diet (HFSD)-fed rats, with and without ovariectomy (OVX) (n = 12 per group) at 40X magnification. p-NF-κB, phosphorylated nuclear factor kappa-B; NF-κB, total nuclear factor kappa-B. *P < 0.05, **P < 0.01 or ***P < 0.005 vs. ND; ####P < 0.001 vs. OVX-ND.
Expression of Inflammatory Mediators in Liver
Expression of IL-6 in Liver
illustrates the immunohistochemical staining of IL-6 in liver of ND- and HFSD-fed rats, with and without ovariectomy (OVX) and shows the quantitative mean pixel intensities of IL-6 staining in the liver of all the experimental groups. Higher hepatic distribution of IL-6 was observed in intact HFSD- and ovariectomized HFSD-fed rats (OVX-HFSD) as compared to their corresponding control ND rats, respectively. Mean pixel intensities of IL-6 were higher in the liver of HFSD as well as OVX-HFSD rats by 99% and 44% (both P < 0.01) respectively, compared to the liver of their corresponding control groups of rats (). Of note, the liver of OVX-ND rats revealed higher IL-6 mean pixel intensities as compared to ND rats’ liver by 85% (P < 0.01). Furthermore, IL-6 mean pixel intensities in the liver of OVX-HFSD rats was higher by 35% (P < 0.05) compared to that in the liver of HFSD rats. Mild staining of IL-6 was shown in the liver across all the ND fed experimental groups ().
Figure 10 Immunohistochemical staining of IL-6 (A), TNF-α (B) and MCP-1 in liver (C) and quantification of mean pixel intensities of hepatic IL-6 (D), TNF-α (E) and MCP-1 (F) staining of normal diet (ND)- and high fat style diet (HFSD)-fed rats, with and without ovariectomy (OVX) (n = 12 per group) at 40X magnification. Dark red arrow indicates the positive immunohistochemical stainings. **P < 0.01 or ****P < 0.001 vs. ND; ##P < 0.01 or ####P < 0.001 vs. OVX-ND; δP < 0.05 vs. HFSD.
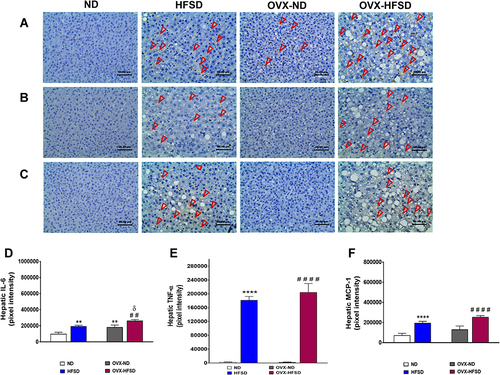
Expression of TNF-α in Liver
illustrates the immunohistochemical staining of TNF-α in liver of ND- and HFSD-fed rats, with and without ovariectomy (OVX) and shows the quantitative mean pixel intensities of TNF-α staining in the liver of all the experimental groups. Higher hepatic distribution of TNF-α was observed in intact HFSD and ovariectomized HFSD-fed rats (OVX-HFSD) compared to their respective control ND rats. The quantification of mean pixel intensities of TNF-α was higher in the liver of HFSD as well as OVX-HFSD rats (both P < 0.001) compared to their control counterparts (). There was a slightly higher TNF-α mean pixel intensity in the liver of OVX-HFSD rats compared to that of in the liver of HFSD rats but could not be statistically distinguished. Very little distribution of TNF-α was observed in the liver across all the ND-fed experimental groups ().
Expression of MCP-1 in Liver
illustrates the immunohistochemical staining of MCP-1 in liver of ND- and HFSD-fed rats, with and without ovariectomy (OVX) and shows the quantitative mean pixel intensities of MCP-1 staining in the liver of all the experimental groups. Higher distribution of MCP-1 was observed in the liver of intact (HFSD) and ovariectomized HFSD (OVX-HFSD) rats as compared to liver of their corresponding control ND rats respectively. Mean pixel intensities of MCP-1 were higher in the liver of HFSD as well as OVX-HFSD rats (both P < 0.001) as compared to their control counterparts by 167 and 95%, respectively (). There was a slightly higher expression of MCP-1 in the liver of OVX-HFSD rats as compared to that in HFSD rats but could not be distinguished statistically. Very little distribution of MCP-1 was observed in the liver across all the experimental groups fed with ND ().
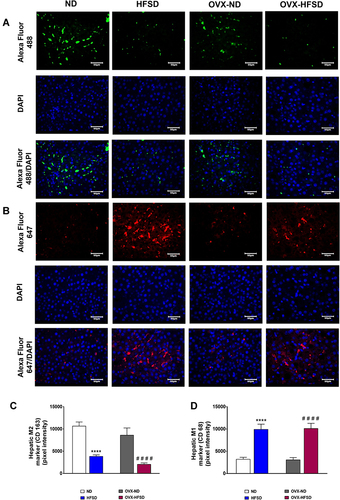
M2 Macrophages Polarized into M1 Macrophages in Kidneys and Liver of HFSD-Fed Intact and Ovariectomized Female Rats
and and and display the immunofluorescence staining of M1 (red colored fluorescence) and M2 (green colored fluorescence) macrophages, respectively in the cortical region of kidneys, and liver of rats in all the experimental groups respectively. and and and demonstrate the quantitative mean pixel intensities of M1 and M2 macrophages staining in the cortical region of kidneys and liver of all the experimental groups respectively. The mean pixel intensities of the M1 (CD68) marker was greater in kidneys of both HFD-fed groups of rats compared to the corresponding kidneys of control groups of rats (all P < 0.001, ). However, the mean pixel intensities of M2 macrophages was significantly decreased by 53% (P < 0.001) in kidney of OVX-HFSD rats and by some 7%, albeit non-significant (P > 0.05), in kidney of HFSD rats compared to the corresponding kidney of control counterparts (). Of note, mean pixel intensities of M2 macrophages in the kidney of OVX-HFSD rats was lower by 52% (P < 0.001) compared to that in the kidney of HFSD rats. Similar to the kidney, the mean pixel intensities of the M1 (CD68) marker was greater in the liver of both HFD-fed groups of rats compared to the corresponding liver of control groups of rats (all P < 0.001, ). By contrast, the mean pixel intensities of the M2 (CD163) marker in the liver was significantly decreased by 64% and 76% (both P < 0.001) in HFSD and OVX-HFSD rats respectively ().
Figure 11 Immunofluorescence staining of M1 (indicated in red color fluorescent) (A), M2 (indicated in green color fluorescent) (B) macrophages in kidneys, and quantification of mean pixel intensities of kidney cortical M1 (C) and M2 markers (D) of normal diet (ND)- and high fat style diet (HFSD)-fed rats, with and without ovariectomy (OVX) (n = 12 per group) at 40X magnification. ****P < 0.001 vs. ND; ####P < 0.001 vs. OVX-ND; δδδδP < 0.001 vs. HFSD.
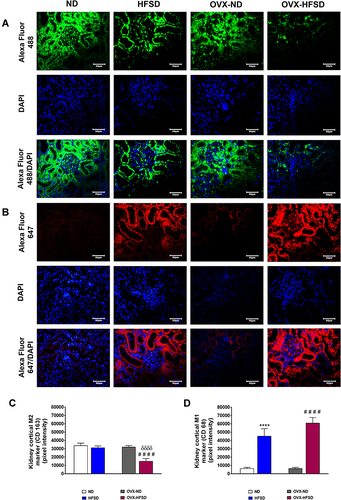
Figure 12 Immunofluorescence staining of M1 (indicated in red color) (A), M2 (indicated in green color) (B) macrophages in liver, and quantification of mean pixel intensities of hepatic M1 (C) and M2 markers (D) of normal diet (ND)- and high fat style diet (HFSD)-fed rats, with and without ovariectomy (OVX) (n = 12 per group) at 40X magnification. ****P < 0.001 vs. ND; ####P < 0.001 vs. OVX-ND.
Discussion
Obesity is an independent risk factor for serious pathological conditions, including diabetes, hypertension, liver disease and CKD. Metabolism is closely linked to the immune system and in that matter prolonged nutrient overload results in chronic activation of the immune system and associated inflammation.Citation40 In addition to low-grade systemic inflammation, there is significant adipose inflammation. Adipose, particularly visceral adipose inflammation appears to be the common denominator of obesity-related pathologies.Citation41,Citation42 The triggers for adipose inflammation are not fully understood, however hypoxia due to adipose hypertrophy and polarization of macrophage phenotype from anti-inflammatory M2 to pro-inflammatory M1 likely play critical roles.Citation43 Both M1 macrophages and adipocytes produce significant amounts of pro-inflammatory cytokines and chemokines due to fatty acid binding or as a result of adipocyte apoptosis. It is now recognized that adipose inflammation culminates in systemic disease, as it amplifies systemic inflammation.Citation9 Indeed, inflammation is associated with organ dysfunction in mice and humans and contributes directly to liverCitation44 and kidney diseases.Citation45
Ovarian hormone loss in women due to age as in menopause or in ovariectomized animals increases the susceptibility to obesity and its associated comorbidities, particularly, inflammation.Citation46,Citation47 Furthermore, estrogens are demonstrated to be protective against the metabolic syndrome and obesity-induced organ injury in rodents and in humans.Citation17,Citation27,Citation28,Citation48 The purpose of the present study is to test the hypothesis that structural and inflammatory changes in rats’ kidney and liver was aggravated in HFSD-fed ovarian hormones deprived rat model. To this end, ovaries intact and ovariectomized female rats were fed a HFSD for 10 weeks and the structural changes and presence of inflammation in rats’ kidneys and liver were explored. The major findings are that the association of a HFSD and ovariectomy in rats, leads to metabolic changes including increased blood pressure and fasting blood glucose. In addition, histological changes in the glomeruli, renal M2 macrophages reduction and expressions of inflammatory markers in renal cortex are exacerbated in the OVX-HFSD in comparison to HFSD animals. Likewise, HFSD fed rats’ liver are infiltrated with fat droplets and expressed an increase in IL-6 to a slightly greater extent in the absence of ovarian hormones.
In the present study, ovariectomy alone did not lead to fat mass accumulation and our data corroborates with another study.Citation49 Contrarily, ovariectomized rats fed the HFSD throughout 10 weeks gained fat mass; in addition, no difference in fat mass was observed between OVX-HFSD and HFSD groups. This finding is in complete contrast with previous studies in which ovariectomized rats fed a high-fat diet gained more fat mass than the corresponding intact rats fed the same diet.Citation29,Citation49 The reason behind this discrepancy is not clear but the duration of feeding in our study was relatively shorter.
Despite similar gain in adiposity between OVX-HFSD and HFSD rats, the present finding showed that HFSD feeding of ovariectomized rats resulted in increased fasting blood glucose and mean blood pressure. This observation suggests that HFSD feeding compounded by loss of ovarian hormones leads to alteration in glucose homeostasis and regulation of blood pressure. Numerous studies suggest that obesity-induced inflammation plays a causative role in generation of insulin resistance, defective insulin secretion, and disruption of other aspects of energy homeostasis.Citation50 Another report demonstrated that reduced insulin sensitivity in ovariectomized mice coincides with increased adipocyte death and inflammatory activation in the abdominal adipose tissue depot; and that ovarian hormones deprivation may directly affect white adipose tissue inflammatory cell activation and may even predict systemic reductions in insulin tolerance without alterations in adiposity.Citation51 Furthermore, 17-beta-estradiol treatment reverses the impaired glucose tolerance, hyperglycaemia and reduced insulin release caused by lack of ovarian hormones in ovariectomized rats.Citation52 In postmenopausal women, there is an increased in the prevalence of obesity, insulin resistance and type 2 diabetes; and estrogens are suggested to protect against the development of the metabolic syndrome.Citation17 Apart from insulin resistance, obesity-induced adipocyte dysfunction also results in chronic vascular inflammation, oxidative stress, activation of the renin-angiotensin-aldosterone system and sympathetic overdrive, eventually leading to hypertension.Citation53,Citation54 It is now well-established that prevalence of hypertension is generally lower in premenopausal compared with age-matched men.Citation55 On the other hand, menopause, a state characterized by visceral obesity and hormonal changes, in particular a reduction in estrogens, is associated with progressive increases in blood pressure. These observations suggest an association between blood pressure regulation and levels of estrogen. The precise mechanisms by which estrogens contribute to the regulation of blood pressure are still not completely understood. Accumulating evidence suggests that modulating locally active hormones is one of the major mechanisms by which estrogens exert their effects on target organs, including the vasculature, kidneys and immune system.Citation55 Thus, it may be construed that estrogens could have negated the effect of HFSD on blood pressure in the present study and the absence of this hormone in HFSD-fed ovariectomized animals leads to an increased in mean blood pressure.
Obesity-induced inflammation is distinct in that it involves multiple organs, including liver, kidneys, pancreas, skeletal muscle, heart and brain. Apart from systemic inflammation, studies have shown ectopic lipid deposition in organs such as the kidney and suggest the role of fat accumulation and renal inflammation in the development of CKD.Citation56 Furthermore, previous epidemiological studies in humans suggest that obesity is one of the risk factors for the development of CKD independent of cardiovascular abnormalities, diabetes or metabolic syndrome.Citation57,Citation58 Apart from causing tissue injury, renal inflammation leads to sodium retention due to local production of angiotensin II by immune cells, such as macrophages and T cells thus altering blood pressure.Citation59 Additionally, infiltration of fat and inflammatory response in the kidney has been documented to be the cause of dysregulation of baroreflex control of renal sympathetic nerve activity by high- and low-pressure baroreceptors in male rats.Citation60 One of the findings in the present study is that HFSD feeding for 10 weeks induced significant mild morphological changes in the kidneys, which was characterized by enhanced renal inflammation, focal interstitial mononuclear cell infiltration and mesangial expansion. This finding corroborates with previous studies which showed that HFD-dependent obesity is related to many alterations in kidney,Citation61–Citation63 albeit, the structural changes in the kidneys which include dilatation of blood vessels and Bowman’s space, mononuclear cell infiltration, glomerulosclerosis and tubular defects, and an increase in the connective tissue in those kidneys were more severe than in the present study. In addition to the structural changes in the kidneys of HFSD-fed rats, we observed increased expression of inflammatory mediators namely, TNF-α, IL-6 and MCP-1. Accompanying the increased expression of inflammatory mediators was a reduction in M2 macrophages and a concomitant increase in pro-inflammatory M1 macrophages thus reinforcing inflammation within the kidney. Generally, there are two distinct polarization states of macrophages, M1 and M2; the M1-polarized macrophages are responsible for upregulating pro-inflammatory cytokines and increasing the production of reactive nitrogen and reactive oxygen species and are associated with tissue injury.Citation64 On the other hand, M2-polarized macrophages attenuate the inflammatory process and is considered to promote tissue repair following inflammation and injury.Citation64 Further, the present study demonstrates that renal inflammation and mesangial expansion was amplified in HFSD-fed ovariectomized rats. Renal M2 macrophages were further reduced and M1 macrophages showed a tendency to increase. It is known that augmented inflammation in adipose and kidney tissues promotes the progression of kidney damage in obesity.Citation56 Previous studies revealed that macrophages are increased in renal cortex of obese ovariectomized rats.Citation29 Moreover, reports have shown that ovariectomy hastens kidney disease in various animal models,Citation65–Citation68 while administration of exogenous oestradiol diminishes the disease,Citation65,Citation66,Citation69,Citation70 indicating that estrogen might have protective effect against renal injury. The mechanism by which estrogens protect obesity-related renal injury is obviously complex but modulation of inflammatory process could play a contributory role. There is a general consensus that estrogens dampen inflammation related to metabolic dysfunction either indirectly through metabolic amelioration or directly through regulation of inflammatory pathways.Citation71
One of the key signaling nodes in metabolic inflammation is NF-κB, a redox-sensitive pro-inflammatory transcription factor the expression of which is increased by HFD.Citation72 Furthermore, it has been documented that HFD-fed ovariectomized rats show increased expression of NF-κB p65 in interstitial area and in the nucleus of the tubular cells of renal cortex. Likewise, expression of NF-κB in a rat model of obesity and aging is increased.Citation73 In fact, NF-κB activation plays a vital role in triggering the synthesis of inflammatory mediators such as cytokines, growth factors and chemotactic factors for macrophages and monocytes,Citation74 which cause kidney damage. For this reason, expressions of phosphorylated and total NF-κB were explored in the present study to confirm that the inflammation was in part due to activation of NF-κB signaling pathway. Expression ratio of phosphorylated NF-κB to total NF-κB was high in rats fed the HFSD, suggesting that HFSD is associated with increased activation of the NF-κB signaling pathway.
Although adipose tissue is an important site of metabolic inflammation in obesity, the liver also plays a role in the development of this type of inflammation.Citation75 Furthermore, hepatic lipid accumulation is a risk factor for hepatic inflammation and hepatic or peripheral insulin resistance.Citation76,Citation77 Both obesity and insulin resistance are risk factors for NAFLD, a disease spectrum that includes hepatic steatosis (non-alcoholic fatty liver, NAFL), non-alcoholic steatohepatitis (NASH), fibrosis, and cirrhosis.Citation78 The present data show that liver index and hepatic lipid accumulation were increased in rats fed a HFSD and to a greater extent in OVX-HFSD rats. Hepatic inflammation was apparent in HFSD-fed rats; expressions of TNF-α, IL-6 and MCP-1 were increased and more so for IL-6 in the OVX-HFSD rats. Additionally, lobular mononuclear cell infiltration and polarization of M2 macrophages to M1 macrophages were detected in both intact and ovariectomized HFSD fed rats. Lipid accumulation in the liver is purported to be an early and critical step in the manifestation of NAFLD.Citation78 In fact, the attribute of NAFLD is that lipid accumulation and inflammatory processes occur simultaneously, furthermore mediators that are involved in the development of inflammation and liver fibrosis, such as pro-inflammatory cytokines are also involved in insulin resistance.Citation78 In the present study, besides hepatic inflammation, HFSD feeding led to microvesicular as well as macrovesicular hepatocellular steatosis which was more prominent in the ovariectomized rats. Of note, hepatocytes ballooning was detected only in OVX-HFSD rats. In a previous study, liver of obese rats presented with an enlargement of microvilli, ballooning degeneration in hepatocyte cytoplasm and mitochondrial degeneration.Citation79 Furthermore, it is postulated that lobular inflammation, hepatocellular ballooning, portal fibrosis and pericellular fibrosis could be due to oxidative stress and mitochondrial dysfunction in NAFLD.Citation80 The present data also indicate that ovarian deprivation through ovariectomy aggravated hepatic inflammation and injury and this data is supported by a previous study.Citation27 Numerous studies indicate that estrogen has a hepatoprotective effect against the progression of NAFLD in both humans and mice;Citation81–Citation83 and the prevalence of NAFLD increases with obesity and postmenopausal status.Citation84 Additionally, studies showed that absence of estrogen signaling increases hepatic lipid infiltration and fat accumulation in humans with estrogen receptor α (ERα) mutations, ovariectomized rodents, mice with global ERα knockout, and mice lacking aromatase.Citation84–Citation88 Thus, the present data suggest that loss of estrogen coupled with nutrients overload may cause excessive accumulation of hepatic fat which culminates in enhanced inflammation and aggravation of liver injury.
Limitations
We acknowledge several limitations in the present study. We have performed ovariectomy in very young female rats (4 weeks old) although menopause (permanent cessation of ovarian follicular function) coincides with aging. The reason for performing the ovariectomy in very young female rats is to negate the aging factor when assessing the extent of inflammation and structural changes in the kidney and liver at the end of the 10-weeks study. Epidemiological and experimental studies have shown that besides known risk factors, vascular ageing are closely linked with inflammatory processes.Citation89,Citation90 Second, ideally, we should have measured estrogen levels in ovariectomized animals since after ovariectomy the production of estrogen is shifted from ovary to extragonadal sites. However, these extra-gonadally synthesized estrogens are small in amount and are thought to act and be metabolized locally, which limits their systemic effects.Citation91 Ovariectomy has been performed in many experimental studies to induce loss of ovarian hormones, nonetheless we do not rule out the influence of the extragonadal estrogens on the inflammation and structural changes that occurred in the kidney and liver in the present study. Third, in order to confirm that the difference observed between the ovary-intact HFSD-fed and ovariectomized HFSD-fed rats with respect to inflammation and structural changes within the kidney and liver was due to estrogen deprivation, estradiol administration to the estrogen-deprived group is warranted. However, this would require a comprehensive study since excessive doses of estradiol may instead cause organ damage including the heart and kidney.Citation92
Conclusion
The present findings suggest that 10-weeks of HFSD consumption induce an inflammatory microenvironment in the kidney and liver of rats that is associated with morphological changes and excessive M1 macrophages infiltration. Furthermore, some of these effects are exacerbated in ovarian hormone deprivation suggesting a protective role of estrogen. The organs injury seen in the present study may not be that profound but may be sufficient to eventually lead to CKD and NAFLD respectively. Moreover, CKD and NAFLD are commonly associated with blood pressure increase and insulin resistance respectively. The fact that so many organ systems including the kidney and liver are afflicted by inflammation during obesity especially in postmenopausal state necessitate a better understanding of this process to bring forth new therapeutic approaches for treatment of obesity-related organ diseases especially in the setting of estrogen deprivation.
Author contributions
All authors contributed to data analysis, drafting or revising the article, have agreed on the journal to which the article will be submitted, gave final approval of the version to be published, and agree to be accountable for all aspects of the work.
Acknowledgments
Associate Professor Dr. Azlina Ahmad Annuar from Department of Biomedical Sciences, Faculty of Medicine, Universiti Malaya is gratefully acknowledged for her expertise in advising the quantification of the immunohistochemical and immunofluorescence expressions. A certified statistician, Dr. Mahmoud Danaee from the Department of Social Preventive Medicine, Faculty of Medicine, Universiti Malaya is also gratefully acknowledged for his expertise in advising the data analysis.
Funding
The authors fully acknowledge the Fundamental Research Grant Scheme (FRGS) grant (FP006-2017A), University Malaya Research Fund Special Assistance (BKS) grant (BKS072-2017) and Postgraduate Research Fund (PPP) grant (PG122-2016A) provided by the Universiti Malaya, Malaysia.
Disclosure
The authors declare that this study was conducted in the absence of any commercial or financial relationships that could be construed as a potential conflict of interest.
References
- Jiang S-Z, Lu W, Zong X-F, Ruan H-Y, Liu Y. Obesity and hypertension. Exp Ther Med. 2016;12(4):2395–2399. doi:10.3892/etm.2016.3667
- Ellulu MS, Patimah I, Khaza’ai H, Rahmat A, Abed Y. Obesity and inflammation: the linking mechanism and the complications. Arch Med Sci. 2017;13(4):851–863. doi:10.5114/aoms.2016.58928
- Krotkiewski M, Björntorp P, Sjöström L, Smith U. Impact of obesity on metabolism in men and women. Importance of regional adipose tissue distribution. J Clin Invest. 1983;72(3):1150–1162. doi:10.1172/JCI111040
- Gregor MF, Hotamisligil GS. Inflammatory mechanisms in obesity. Annu Rev Immunol. 2011;29(1):415–445. doi:10.1146/annurev-immunol-031210-101322
- Guilherme A, Virbasius JV, Puri V, Czech MP. Adipocyte dysfunctions linking obesity to insulin resistance and type 2 diabetes. Nat Rev Mol Cell Biol. 2008;9(5):367–377. doi:10.1038/nrm2391
- Musaad S, Haynes EN. Biomarkers of obesity and subsequent cardiovascular events. Epidemiol Rev. 2007;29(1):98–114. doi:10.1093/epirev/mxm005
- Pi-Sunyer FX. The obesity epidemic: pathophysiology and consequences of obesity. Obes Res. 2002;10(Suppl 2):97s–104s. doi:10.1038/oby.2002.202
- Serra A, Romero R, Lopez D, et al. Renal injury in the extremely obese patients with normal renal function. Kidney Int. 2008;73(8):947–955. doi:10.1038/sj.ki.5002796
- Börgeson E, Sharma K. Obesity, immunomodulation and chronic kidney disease. Curr Opin Pharmacol. 2013;13(4):618–624. doi:10.1016/j.coph.2013.05.011
- Saja MF, Cook HT, Ruseva MM, et al. A triglyceride-rich lipoprotein environment exacerbates renal injury in the accelerated nephrotoxic nephritis model. Clin Exp Immunol. 2018;192(3):337–347. doi:10.1111/cei.13111
- Muller CR, Leite APO, Yokota R, et al. Post-weaning exposure to high-fat diet induces kidney lipid accumulation and function impairment in adult rats. Front Nutr. 2019;6:60. doi:10.3389/fnut.2019.00060
- Fazel Y, Koenig AB, Sayiner M, Goodman ZD, Younossi ZM. Epidemiology and natural history of non-alcoholic fatty liver disease. Metabolism. 2016;65(8):1017–1025. doi:10.1016/j.metabol.2016.01.012
- Donnelly KL, Smith CI, Schwarzenberg SJ, Jessurun J, Boldt MD, Parks EJ. Sources of fatty acids stored in liver and secreted via lipoproteins in patients with nonalcoholic fatty liver disease. J Clin Invest. 2005;115(5):1343–1351. doi:10.1172/JCI23621
- Adams JM, Pei H, Sandoval DA, et al. Liraglutide modulates appetite and body weight through glucagon-like peptide 1 receptor-expressing glutamatergic neurons. Diabetes. 2018;67(8):1538–1548. doi:10.2337/db17-1385
- Poniachik J, Csendes A, Díaz JC, et al. Increased production of IL-1alpha and TNF-alpha in lipopolysaccharide-stimulated blood from obese patients with non-alcoholic fatty liver disease. Cytokine. 2006;33(5):252–257. doi:10.1016/j.cyto.2006.02.006
- Wieckowska A, Papouchado BG, Li Z, Lopez R, Zein NN, Feldstein AE. Increased hepatic and circulating interleukin-6 levels in human nonalcoholic steatohepatitis. Am J Gastroenterol. 2008;103(6):1372–1379. doi:10.1111/j.1572-0241.2007.01774.x
- Shi H, Clegg DJ. Sex differences in the regulation of body weight. Physiol Behav. 2009;97(2):199–204.
- Lafontan M, Berlan M. Do regional differences in adipocyte biology provide new pathophysiological insights? Trends Pharmacol Sci. 2003;24(6):276–283. doi:10.1016/S0165-6147(03)00132-9
- van Harmelen V, Dicker A, Rydén M, et al. Increased lipolysis and decreased leptin production by human omental as compared with subcutaneous preadipocytes. Diabetes. 2002;51(7):2029–2036. doi:10.2337/diabetes.51.7.2029
- Hayashi T, Boyko EJ, Leonetti DL, et al. Visceral adiposity and the risk of impaired glucose tolerance: a prospective study among Japanese Americans. Diabetes Care. 2003;26(3):650–655. doi:10.2337/diacare.26.3.650
- Bacha F, Saad R, Gungor N, Janosky J, Arslanian SA. Obesity, regional fat distribution, and syndrome X in obese black versus white adolescents: race differential in diabetogenic and atherogenic risk factors. J Clin Endocrinol Metab. 2003;88(6):2534–2540. doi:10.1210/jc.2002-021267
- Rattarasarn C, Leelawattana R, Soonthornpun S, et al. Regional abdominal fat distribution in lean and obese Thai type 2 diabetic women: relationships with insulin sensitivity and cardiovascular risk factors. Metabolism. 2003;52(11):1444–1447. doi:10.1016/S0026-0495(03)00257-9
- Katsuki A, Sumida Y, Urakawa H, et al. Increased visceral fat and serum levels of triglyceride are associated with insulin resistance in Japanese metabolically obese, normal weight subjects with normal glucose tolerance. Diabetes Care. 2003;26(8):2341–2344. doi:10.2337/diacare.26.8.2341
- Nieves DJ, Cnop M, Retzlaff B, et al. The atherogenic lipoprotein profile associated with obesity and insulin resistance is largely attributable to intra-abdominal fat. Diabetes. 2003;52(1):172–179. doi:10.2337/diabetes.52.1.172
- Bertin E, Nguyen P, Guenounou M, Durlach V, Potron G, Leutenegger M. Plasma levels of tumor necrosis factor-alpha (TNF-alpha) are essentially dependent on visceral fat amount in type 2 diabetic patients. Diabetes Metab. 2000;26(3):178–182.
- You T, Nicklas BJ, Ding J. The metabolic syndrome is associated with circulating adipokines in older adults across a wide range of adiposity. J Gerontol a Biol Sci Med Sci. 2008;63(4):414–419. doi:10.1093/gerona/63.4.414
- Jeong YH, Hur HJ, Jeon EJ, et al. Honokiol improves liver steatosis in ovariectomized mice. Molecules. 2018;23(1):194. doi:10.3390/molecules23010194
- Zhang X, Jia Y, Jackson EK, Tofovic SP. 2-Methoxyestradiol and 2-ethoxyestradiol retard the progression of renal disease in aged, obese, diabetic ZSF1 rats. J Cardiovasc Pharmacol. 2007;49(1):56–63. doi:10.1097/FJC.0b013e31802cb88e
- Amaral LS, Silva JA, Trindade TM, et al. Renal changes in the early stages of diet-induced obesity in ovariectomized rats. Physiol Res. 2014;63(6):723–732. doi:10.33549/physiolres.932619
- Giugliano D, Ceriello A, Esposito K. The effects of diet on inflammation: emphasis on the metabolic syndrome. J Am Coll Cardiol. 2006;48(4):677–685. doi:10.1016/j.jacc.2006.03.052
- Novella S, Pérez-Cremades D, Mompeón A, Hermenegildo C. Mechanisms underlying the influence of oestrogen on cardiovascular physiology in women. J Physiol. 2019;597(19):4873–4886. doi:10.1113/JP278063
- Störk S, von Schacky C, Angerer P. The effect of 17beta-estradiol on endothelial and inflammatory markers in postmenopausal women: a randomized, controlled trial. Atherosclerosis. 2002;165(2):301–307. doi:10.1016/S0021-9150(02)00242-3
- Kip KE, Marroquin OC, Shaw LJ, et al. Global inflammation predicts cardiovascular risk in women: a report from the women’s ischemia syndrome evaluation (WISE) study. Am Heart J. 2005;150(5):900–906. doi:10.1016/j.ahj.2005.02.002
- Cutolo M, Capellino S, Sulli A, et al. Estrogens and autoimmune diseases. Ann N Y Acad Sci. 2006;1089(1):538–547. doi:10.1196/annals.1386.043
- Khajuria DK, Razdan R, Mahapatra DR. Description of a new method of ovariectomy in female rats. Rev Bras Reumatol. 2012;52(3):462–470.
- Riant E, Waget A, Cogo H, Arnal JF, Burcelin R, Gourdy P. Estrogens protect against high-fat diet-induced insulin resistance and glucose intolerance in mice. Endocrinology. 2009;150(5):2109–2117. doi:10.1210/en.2008-0971
- Sucedaram Y, Johns EJ, Husain R, et al. Comparison of high-fat style diet-induced dysregulation of baroreflex control of renal sympathetic nerve activity in intact and ovariectomized female rats: renal sympathetic nerve activity in high-fat style diet fed intact and ovariectomized female rats. Exp Biol Med (Maywood). 2020;245(9):761–776. doi:10.1177/1535370220915673
- Al-Hussaini H, Kilarkaje N. Trans-resveratrol mitigates type 1 diabetes-induced oxidative DNA damage and accumulation of advanced glycation end products in glomeruli and tubules of rat kidneys. Toxicol Appl Pharmacol. 2018;339:97–109. doi:10.1016/j.taap.2017.11.025
- Dobrian AD, Davies MJ, Prewitt RL, Lauterio TJ. Development of hypertension in a rat model of diet-induced obesity. Hypertension. 2000;35(4):1009–1015. doi:10.1161/01.HYP.35.4.1009
- Donath MY, Dalmas É, Sauter NS, Böni-Schnetzler M. Inflammation in obesity and diabetes: islet dysfunction and therapeutic opportunity. Cell Metab. 2013;17(6):860–872. doi:10.1016/j.cmet.2013.05.001
- Donath MY, Shoelson SE. Type 2 diabetes as an inflammatory disease. Nat Rev Immunol. 2011;11(2):98–107.
- McNelis JC, Olefsky JM. Macrophages, immunity, and metabolic disease. Immunity. 2014;41(1):36–48. doi:10.1016/j.immuni.2014.05.010
- Masoodi M, Kuda O, Rossmeisl M, Flachs P, Kopecky J. Lipid signaling in adipose tissue: connecting inflammation & metabolism. Biochim Biophys Acta. 2015;1851(4):503–518.
- Finelli C, Tarantino G. What is the role of adiponectin in obesity related non-alcoholic fatty liver disease? World J Gastroenterol. 2013;19(6):802–812. doi:10.3748/wjg.v19.i6.802
- Sharma K. The link between obesity and albuminuria: adiponectin and podocyte dysfunction. Kidney Int. 2009;76(2):145–148. doi:10.1038/ki.2009.137
- Kaaja RJ. Metabolic syndrome and the menopause. Menopause Int. 2008;14(1):21–25. doi:10.1258/MI.2007.007032
- Hong J, Stubbins RE, Smith RR, Harvey AE, Núñez NP. Differential susceptibility to obesity between male, female and ovariectomized female mice. Nutr J. 2009;8(1):11. doi:10.1186/1475-2891-8-11
- Louet JF, LeMay C, Mauvais-Jarvis F. Antidiabetic actions of estrogen: insight from human and genetic mouse models. Curr Atheroscler Rep. 2004;6(3):180–185. doi:10.1007/s11883-004-0030-9
- Ludgero-Correia A Jr, Aguila MB, Mandarim-de-lacerda CA, Faria TS. Effects of high-fat diet on plasma lipids, adiposity, and inflammatory markers in ovariectomized C57BL/6 mice. Nutrition. 2012;28(3):316–323. doi:10.1016/j.nut.2011.07.014
- Saltiel AR, Olefsky JM. Inflammatory mechanisms linking obesity and metabolic disease. J Clin Invest. 2017;127(1):1–4. doi:10.1172/JCI92035
- Vieira Potter VJ, Strissel KJ, Xie C, et al. Adipose tissue inflammation and reduced insulin sensitivity in ovariectomized mice occurs in the absence of increased adiposity. Endocrinology. 2012;153(9):4266–4277. doi:10.1210/en.2011-2006
- Godsland IF. Oestrogens and insulin secretion. Diabetologia. 2005;48(11):2213–2220. doi:10.1007/s00125-005-1930-0
- Dorresteijn JA, Visseren FL, Spiering W. Mechanisms linking obesity to hypertension. Obes Rev. 2012;13(1):17–26. doi:10.1111/j.1467-789X.2011.00914.x
- Cheung BMY, Li C. Diabetes and hypertension: is there a common metabolic pathway? Curr Atheroscler Rep. 2012;14(2):160–166. doi:10.1007/s11883-012-0227-2
- Maric-Bilkan C, Gilbert EL, Ryan MJ. Impact of ovarian function on cardiovascular health in women: focus on hypertension. Int J Womens Health. 2014;6:131–139. doi:10.2147/IJWH.S38084
- Declèves AE, Sharma K. Obesity and kidney disease: differential effects of obesity on adipose tissue and kidney inflammation and fibrosis. Curr Opin Nephrol Hypertens. 2015;24(1):28–36. doi:10.1097/MNH.0000000000000087
- Wang Y, Chen X, Song Y, Caballero B, Cheskin LJ. Association between obesity and kidney disease: a systematic review and meta-analysis. Kidney Int. 2008;73(1):19–33. doi:10.1038/sj.ki.5002586
- McPherson KC, Shields CA, Poudel B, et al. Impact of obesity as an independent risk factor for the development of renal injury: implications from rat models of obesity. Am J Physiol Renal Physiol. 2019;316(2):F316–f327. doi:10.1152/ajprenal.00162.2018
- Rodriguez-Iturbe B, Vaziri ND, Herrera-Acosta J, Johnson RJ. Oxidative stress, renal infiltration of immune cells, and salt-sensitive hypertension: all for one and one for all. Am J Physiol Renal Physiol. 2004;286(4):F606–616. doi:10.1152/ajprenal.00269.2003
- Khan SA, Sattar MZA, Abdullah NA, et al. Improvement in baroreflex control of renal sympathetic nerve activity in obese Sprague Dawley rats following immunosuppression. Acta Physiol (Oxf). 2017;221(4):250–265. doi:10.1111/apha.12891
- Altunkaynak ME, Ozbek E, Altunkaynak BZ, Can I, Unal D, Unal B. The effects of high-fat diet on the renal structure and morphometric parametric of kidneys in rats. J Anat. 2008;212(6):845–852. doi:10.1111/j.1469-7580.2008.00902.x
- Handa K, Kreiger N. Diet patterns and the risk of renal cell carcinoma. Public Health Nutr. 2002;5(6):757–767. doi:10.1079/PHN2002347
- Jiang T, Wang Z, Proctor G, et al. Diet-induced obesity in C57BL/6J mice causes increased renal lipid accumulation and glomerulosclerosis via a sterol regulatory element-binding protein-1c-dependent pathway. J Biol Chem. 2005;280(37):32317–32325. doi:10.1074/jbc.M500801200
- Gordon S, Martinez FO. Alternative activation of macrophages: mechanism and functions. Immunity. 2010;32(5):593–604. doi:10.1016/j.immuni.2010.05.007
- Mankhey RW, Bhatti F, Maric C. 17Beta-estradiol replacement improves renal function and pathology associated with diabetic nephropathy. Am J Physiol Renal Physiol. 2005;288(2):F399–405. doi:10.1152/ajprenal.00195.2004
- Maric C, Sandberg K, Hinojosa-Laborde C. Glomerulosclerosis and tubulointerstitial fibrosis are attenuated with 17beta-estradiol in the aging Dahl salt sensitive rat. J Am Soc Nephrol. 2004;15(6):1546–1556. doi:10.1097/01.ASN.0000128219.65330.EA
- Elliot SJ, Karl M, Berho M, et al. Estrogen deficiency accelerates progression of glomerulosclerosis in susceptible mice. Am J Pathol. 2003;162(5):1441–1448. doi:10.1016/S0002-9440(10)64277-0
- Antus B, Hamar P, Kokeny G, et al. Estradiol is nephroprotective in the rat remnant kidney. Nephrol Dial Transplant. 2003;18(1):54–61. doi:10.1093/ndt/18.1.54
- Sakemi T, Tomiyoshi Y, Miyazono M, Ikeda Y. Estrogen replacement therapy with its physiological dose does not eliminate the aggravating effect of ovariectomy on glomerular injury in hypercholesterolemic female Imai rats. Nephron. 1998;80(3):324–330. doi:10.1159/000045193
- Catanuto P, Doublier S, Lupia E, et al. 17 beta-estradiol and tamoxifen upregulate estrogen receptor beta expression and control podocyte signaling pathways in a model of type 2 diabetes. Kidney Int. 2009;75(11):1194–1201. doi:10.1038/ki.2009.69
- Monteiro R, Teixeira D, Calhau C. Estrogen signaling in metabolic inflammation. Mediators Inflamm. 2014;2014:615917. doi:10.1155/2014/615917
- Sanz AB, Sanchez-Niño MD, Ramos AM, et al. NF-kappaB in renal inflammation. J Am Soc Nephrol. 2010;21(8):1254–1262. doi:10.1681/ASN.2010020218
- Percy CJ, Brown L, Power DA, Johnson DW, Gobe GC. Obesity and hypertension have differing oxidant handling molecular pathways in age-related chronic kidney disease. Mech Ageing Dev. 2009;130(3):129–138. doi:10.1016/j.mad.2008.10.003
- Guijarro C, Egido J. Transcription factor-kappa B (NF-kappa B) and renal disease. Kidney Int. 2001;59(2):415–424. doi:10.1046/j.1523-1755.2001.059002415.x
- Sheedfar F, Di Biase S, Koonen D, Vinciguerra M. Liver diseases and aging: friends or foes? Aging Cell. 2013;12(6):950–954. doi:10.1111/acel.12128
- Byrne CD. Dorothy Hodgkin lecture 2012: non-alcoholic fatty liver disease, insulin resistance and ectopic fat: a new problem in diabetes management. Diabet Med. 2012;29(9):1098–1107. doi:10.1111/j.1464-5491.2012.03732.x
- Byrne CD. Ectopic fat, insulin resistance and non-alcoholic fatty liver disease. Proc Nutr Soc. 2013;72(4):412–419. doi:10.1017/S0029665113001249
- Chiang DJ, Pritchard MT, Nagy LE. Obesity, diabetes mellitus, and liver fibrosis. Am J Physiol Gastrointest Liver Physiol. 2011;300(5):G697–702. doi:10.1152/ajpgi.00426.2010
- Altunkaynak B, Özbek E. Histological assessment of obesity induced NAFLD in female obese rats. Paper presented at: 17th National Electron Microscopy Congress; 2005.
- Neuschwander-Tetri BA, Caldwell SH. Nonalcoholic steatohepatitis: summary of an AASLD single topic conference. Hepatology. 2003;37(5):1202–1219. doi:10.1053/jhep.2003.50193
- Luo F, Ishigami M, Achiwa K, et al. Raloxifene ameliorates liver fibrosis of nonalcoholic steatohepatitis induced by choline-deficient high-fat diet in ovariectomized mice. Dig Dis Sci. 2015;60(9):2730–2739. doi:10.1007/s10620-015-3660-6
- Maffei L, Murata Y, Rochira V, et al. Dysmetabolic syndrome in a man with a novel mutation of the aromatase gene: effects of testosterone, alendronate, and estradiol treatment. J Clin Endocrinol Metab. 2004;89(1):61–70. doi:10.1210/jc.2003-030313
- Nemoto Y, Toda K, Ono M, et al. Altered expression of fatty acid-metabolizing enzymes in aromatase-deficient mice. J Clin Invest. 2000;105(12):1819–1825. doi:10.1172/JCI9575
- Ribas V, Nguyen MT, Henstridge DC, et al. Impaired oxidative metabolism and inflammation are associated with insulin resistance in ERalpha-deficient mice. Am J Physiol Endocrinol Metab. 2010;298(2):E304–319. doi:10.1152/ajpendo.00504.2009
- Bryzgalova G, Gao H, Ahren B, et al. Evidence that oestrogen receptor-alpha plays an important role in the regulation of glucose homeostasis in mice: insulin sensitivity in the liver. Diabetologia. 2006;49(3):588–597. doi:10.1007/s00125-005-0105-3
- Jones ME, Thorburn AW, Britt KL, et al. Aromatase-deficient (ArKO) mice have a phenotype of increased adiposity. Proc Natl Acad Sci U S A. 2000;97(23):12735–12740. doi:10.1073/pnas.97.23.12735
- Deshaies Y, Dagnault A, Lalonde J, Richard D. Interaction of corticosterone and gonadal steroids on lipid deposition in the female rat. Am J Physiol. 1997;273(2 Pt 1):E355–362. doi:10.1152/ajpendo.1997.273.2.E355
- Picard F, Deshaies Y, Lalonde J, et al. Effects of the estrogen antagonist EM-652.HCl on energy balance and lipid metabolism in ovariectomized rats. Int J Obes Relat Metab Disord. 2000;24(7):830–840. doi:10.1038/sj.ijo.0801240
- Seals DR, Jablonski KL, Donato AJ. Aging and vascular endothelial function in humans. Clin Sci (Lond). 2011;120(9):357–375. doi:10.1042/CS20100476
- Najjar SS, Scuteri A, Lakatta EG. Arterial aging: is it an immutable cardiovascular risk factor? Hypertension. 2005;46(3):454–462. doi:10.1161/01.HYP.0000177474.06749.98
- Barakat R, Oakley O, Kim H, Jin J, Ko CJ. Extra-gonadal sites of estrogen biosynthesis and function. BMB Rep. 2016;49(9):488–496. doi:10.5483/BMBRep.2016.49.9.141
- Meng X, Dai X, Liao TD, et al. Dose-dependent toxic effects of high-dose estrogen on renal and cardiac injury in surgically postmenopausal mice. Life Sci. 2011;88(3–4):178–186. doi:10.1016/j.lfs.2010.11.008