
Lin S, Chen Q, Zhang L, et al. J Inflamm Res. 2021;14:3637–3649.
The authors have advised on page 3641 is incorrect. Due to an error at the time of figure assembly Control and BMSCWT+LPS in the 0 h row in figure part C were duplicated. The correct is shown below.
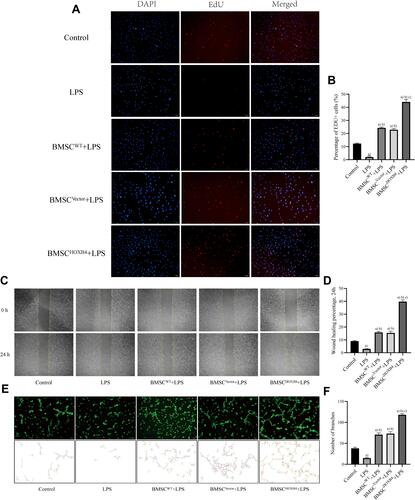
Figure 2 BMSCHOXB4 coculture promotes the proliferation, migration, and tube formation ability of ECs. (A) EdU was measured for EC proliferative capacity, of which the blue color indicated the nuclear localization and the red color indicated the proliferation-active cells (magnification 100×). (B) Quantitative analysis was conducted by calculating the percentage of proliferation-active cells, and the results suggested that BMSCHOXB4 coculture dramatically promoted EC proliferation capacity after LPS-induced injury compared to BMSCWT and BMSCVector coculture groups. (C) The scratch assay was conducted to assess the migration capability of EC, and representative images of the scratches at different time points at 0 h and 24 h are shown (magnification 40×). (D) Quantitative analysis of the changes in the scratched areas was performed using Image J software, and results suggested that the migration ability of ECs was significantly increased in the BMSCHOXB4 coculture group compared to BMSCWT and BMSCVector coculture groups. (E) Tube formation assay was performed to detect EC angiogenic capacity, and Calcein AM fluorescent dye was used to enhance the visibility of tube and network formation in Matrigel (magnification 100×), along with the trajectories of tubes and networks were also depicted accordingly. (F) Quantitative analysis suggested that coculture with BMSCHOXB4 significantly promoted the EC tube formation ability compared to that in BMSCWT and BMSCVector coculture groups. Data were expressed as mean±SD (n=3). a)Compared to control group, P <0.01; b)compared to LPS group, P <0.01; c)compared to BMSCWT+LPS group, P <0.01.
The authors apologize for this error and advise it does not affect the results of the paper.