
Abstract
Purpose
Accumulating evidence revealed the predictive value of tumor-infiltrating lymphocytes (TILs) for neoadjuvant chemoradiotherapy (nCRT) response in solid tumors. This study quantified TILs density using hematoxylin and eosin (H&E) stained whole-slide images (WSIs) and investigated the predictive value of TILs density on nCRT response in locally advanced rectal cancer (LARC) patients.
Patients and Methods
Two hundred and ten patients diagnosed with LARC were enrolled in this study. The density of TILs in the stroma region was quantified by a semi-automatic method in WSIs. Patients were stratified into low-TILs and high-TILs groups using the median value as the threshold. The tumor regression grade (TRG) was used to assess the response to nCRT in tumor resected specimens. Based on TRG, patients were classified into major-responder (TRG 0–1) and non-responder (TRG 2–3) groups.
Results
The TILs density was significantly correlated with the nCRT response. Specifically, patients with high-TILs tend to have a higher major-responder rate than the low-TILs group (63.8% vs 47.6%, P = 0.026). Univariate analysis showed the TILs density was a predictor for the nCRT response (high vs low, odds ratio [OR] =1.94, 95% confidence interval 1.12–3.37, P = 0.019), and multivariate analysis further confirmed the correlation (adjusted odds ratio [AOR] = 2.41, 1.28–4.56, P = 0.007).
Conclusion
Patients with a high-TIL density have a higher major-responder rate than the low-TILs group, indicating patients with a strong immune response benefit more from nCRT. This semi-automatic method can facilitate the individualized preoperative prediction of the TRG for LARC patients before nCRT.
Introduction
Colorectal cancer (CRC) is the second deadly and the third incident cancer in the world.Citation1 In CRC, the locally advanced rectal cancer (LARC) has a high local recurrence rate and poor prognosis. For LARC patients, as a clinical standard treatment strategy, neoadjuvant chemoradiotherapy (nCRT) combined with radical surgery means a better therapeutic effect. However, not all patients benefit from nCRT. To make matters worse, patients may lose the best time of surgery. As reported,Citation2,Citation3 only a few patients achieve the pathological complete response (pCR) after nCRT, while a large part of patients have no or partial response. Therefore, before treatment, it is crucial to identify patients who will not benefit from nCRT treatment, avoiding ineffective treatment.
Currently, the most accurate way to identify pCR patients is still the evaluation of specimens after total mesorectal excision (TME) surgery. Meanwhile, several biomarkers have been proved as potential predictors of nCRT response, for instance, gene (such as microRNA-19b) and radiology (such as radiomics signature),Citation4,Citation5 while lacking further validation before clinical application. Despite these biomarkers cannot accurately predict pCR, serving as nCRT pre-predictors remains valuable. Developing and validating robust biomarkers with high accuracy and interpretability is still needed.
Previous studies have confirmed that radiotherapy response is related to immune capacity.Citation6,Citation7 The involvement in tumor immune processes suggests that the density of tumor-infiltrating lymphocytes (TILs) is a good potential predictor of nCRT. As one of the most important components of the tumor microenvironment, TILs provide important information regarding prognosis, prediction of treatments response, and tumor behavior in diverse solid tumor types, including carcinomas of the lung, colon, breast, brain, melanoma, and mesothelioma.Citation8–Citation12 Several studies have suggested the assessment of stromal TILs is more important about discriminating biological behavior for patients than intra-tumoral TILs,Citation13,Citation14 prompting the necessity and feasibility of accurately quantifying the stromal TILs in LARC.
For evaluating TILs, various digital pathology-based methods have been developed. Some studies have obtained significant results in evaluating TILs visually using hematoxylin and eosin (H&E) stained whole-slide images (WSIs), with qualitative or semiquantitative scoring methods that are determined according to tumor type.Citation15 Despite the standardization effort is successful, it is slow and has limited accuracy in evaluating TILs. Thus, computational image analysis methods are required to efficiently and reproducibly evaluate TILs from H&E-stained WSIs scanned using preoperative biopsy slices in LARC.
This study aims to calculate the density of TILs within the tumor stroma region in H&E-stained WSIs obtained before nCRT, further provides evidence of the predictive value for nCRT response.
Patients and Methods
Patient Cohort
This was a retrospective study with data from the Sixth Affiliated Hospital of Sun Yat-sen University, and informed consent was waived. Two hundred and ten consecutive patients who were diagnosed with LARC (cT3–4b or any T, N+, M0) and underwent nCRT followed by resection between November 2012 and November 2017 were included. Exclusion and inclusion criteria are listed in the Supplementary Material. The specific plans of nCRT were as follows: long-course radiotherapy (45–50 Gy in 25–28 fractions) included capecitabine, infusional 5-fluorouracil, or bolus 5-fluorouracil/leucovorin, and mono chemotherapy (25 Gy in 5 fractions) included FOLFOX (folinic acid, fluorouracil, and oxaliplatin) or CAPEOX (capecitabine and oxaliplatin). The following clinicopathological data were collected from the medical records: Age, sex, pathological classification of colonoscopy biopsy, preoperative differentiation degree of biopsy, the distance between the lower margin of lesion and anus on magnetic resonance imaging (MRI) examination, tumor-node-metastasis (TNM) stage of newly diagnosed clinical treatment, pretreatment cancer antigen 19–9 (CA19–9, cutoff = 27 U/mL, normal = 0–27 U/mL), and pretreatment carcinoembryonic antigen (CEA, cutoff = 5 ng/mL, normal = 0–5 ng/mL).
Evaluation of nCRT Response
The pathologist graded the tumor regression based on the residual tumor component and the fibrotic component of the post-operative sample. To assess patients’ nCRT response more accurately, the tumor regression of all tumor resected specimens was evaluated by a professional pathologist according to the eighth edition of the four-tier tumor regression grade (TRG) system as defined by the American Joint Council on Cancer (AJCC). The four-tier TRG system was as follows: TRG 0, no residual tumor cells; TRG 1, moderate tumor regression, with only single or small tumor cells observed microscopically; TRG 2, slight tumor regression with tumor residue but less than fibrotic stroma; TRG 3, no tumor regression, no or only a small number of tumor cells were killed, and a large number of tumor remnants.
Image Acquisition
Two hundred and ten patients received biopsy before treatment; usually, the biopsy tissue was fixed with formalin and embedded with paraffin, and then it was cut into 4μm slices, and finally stained with hematoxylin and eosin. After stained, all sections were scanned by digital whole-slide scanning (Leica, Aperio-AT2, USA) at 40× magnification and 0.25μm/pixel resolution. In all scanned WSIs, tumor epithelial tissue regions were delineated using green lines and tumor areas were delineated by yellow lines via ImageScope (version 12.4.3, Leica, USA) by a professional pathologist with over 10-year experience.
Image Preprocess
The regions of tumor stroma were extracted with the following steps ().The first step was to extract tissue region: RGB-encoded images were converted to grayscale images. The grayscale images were blurred by Gaussian filter (standard deviation = 15) to reduce the level of detail at first, and then used the OTSU method to get global threshold thereby getting the mask of tissue (MASKtissue). The second step was to extract the rough tumor region (including tumor epithelial and tumor stroma) annotated by a pathologist (over 10-year experience) with yellow lines, generating the rough tumor mask (MASKtumor). The third step was to extract tumor epithelial tissue (MASK epithelium) by reading the green line marked area. Finally, the stroma region was calculated as: MASKstroma = MASKtissue & MASKtumor - MASKepithelium.
Figure 1 Image preprocessing. (A) The process of extracting tumor stroma. (B) The tumor stroma and corresponding mask were dissected into patches (512×512 pixels).
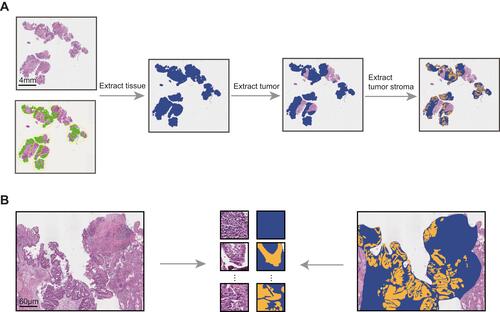
WSIs are large gigapixel images, while the work of calculating the TILs density relied on pixel. Thus, to make computation feasible, WSIs and the mask of the extracted tumor stroma were divided into patches (512 × 512 pixels, 40×) without overlapping as direct inputs to analyze ().
TILs Density Calculation Process
Before segmenting nuclei, to acquire detailed nuclei information, color deconvolution was used to extract hematoxylin-stained channel images, avoiding the interference of eosin stain (). More attention was paid to the segmentation of adhered/overlapping nuclei rather than the region contour. Therefore, a nuclei segmentation method based on preservation and subdivision was presented in this work.
Firstly, we adopted a watershed algorithm based on distance transformation to segment overlapping nuclei. However, the choice of parameters would lead to the occurrence of over-segmentation or under-segmentation. Due to the difference between TILs and other nuclei, some regions that correspond to TILs morphology were considered to be saved through feature screening, avoiding over-segmentation of these regions, and further the rest were segmented with the watershed algorithm, which means subdivision. The nuclei area and compactness were picked out as screening features. The connected regions with an area less than 2000 pixels and compactness greater than 0.93 were retained, and the others were further divided and screened after adjusting the parameters. The above process was repeated twice. Finally, the saved patches were superimposed to obtain the segmentation result ().
Figure 2 Nuclei segmentation and heat map. (A) Process and result of nuclei segmentation. (B) A rough expression of the nuclei segmentation method based on preservation and subdivision. (C) Heat map showed the density calculation results of each patch.
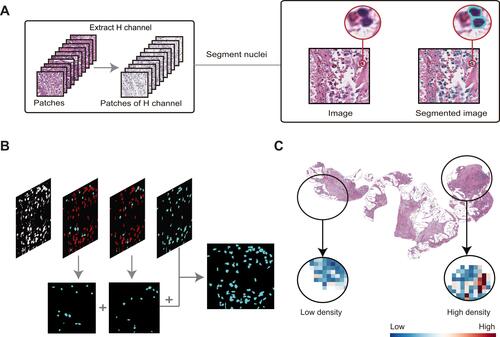
Image preprocessing and nuclei segmentation were performed on four selected WSIs. And then 61 patches were chosen randomly to be labeled the categories of nuclei in each region. In these labeled patches, 41 patches with a total of 3652 nuclei were used as the training set to train classifiers, and 20 patches with a total of 1696 nuclei were used as the test set.
Support vector machine (SVM) model with a radial basis function kernel, decision tree model, and random forest model were developed to accomplish the training nuclei classification goal respectively. The feature marker matrix was composed of six features: area, compactness, the ratio of minor axis to major axis, roundness, mean of the pixel, and contrast. Finally, according to the confusion matrix score, the best model was selected to classify nuclei.
The TILs density was defined as follows: Density = the number of TILs in the stroma region/the stromal area of the tumor. The number of TILs in each patch was calculated according to the classifier, and then added to get the number of TILs in WSI. The pixel area of tumor stroma was calculated by the mask of extracted tumor stroma. Furthermore, the difference in TILs density on each patch was shown in the heat map ().
Statistical Analysis
The association between TILs density and nCRT response was analysed using the Pearson chi-square test, and the same method was used to analyse the association between TILs and clinicopathological characteristics. Univariable and multivariable logistic regression analyses were performed to evaluate predictors of nCRT response, and multivariable analysis was used to examine variables with P < 0.05 in the univariable analysis. The statistical significance was set at 0.05. Statistical analysis was performed using R language (version 4.0.5) or SPSS (version 24.0).
Results
Patients
There were 210 eligible patients enrolled in the study, 149 males and 61 females. Pretreatment biopsies indicated poorly differentiated tumors in 8 patients (4%) and highly or moderately differentiated tumors in 202 patients (96%). The grade of tumor regression assessed by postoperative samples was as follows: TRG 0 occurred in 54 (26%) patients and 63 (30%) were TRG 1, 86 (41%) were TRG 2, 7 (3%) were TRG 3. We further classified treatment response into two categories: 117 (55.7%) patients were major-responders (TRG 0–1), 93 (44.3%) patients were non-responders (TRG 2–3).
Segmentation and Classification
The proposed method based on preservation and subdivision effectively separated the adhered/overlapping TILs (). Among the three classifier models, the random forest was chosen with the best performance in the test set, in terms of precision, recall, accuracy, and F1-score (). F1-score for the random forest on a cell level was 0.790, while the recall was 0.756, precision was 0.827, and predictive accuracy was 0.903.
Table 1 Performance of Classifiers in the Test Set
Relationship Between TILs Density and nCRT Response
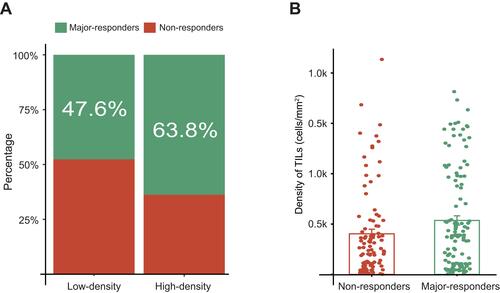
Based on the median value, 210 patients were classified into high-density group and low-density group. The high-TIL density group was more likely to have better tumor regression (63.8% vs 47.6%, P = 0.026) (). Box-plot has shown that the distribution of TILs density in major-responders and non-responders ().
Figure 3 The association between the level of TILs density and nCRT response in LARC patients. (A) In the high-density group and low-density group, the major-responders (green) and non-responders (red) have different proportions. (B) Groups of major-responders (green) and non-responders (red) showed the different TILs density.
Relationship Between TILs Density and Other Potential Factors
The relationship between TILs and clinicopathological characteristics was presented in Supplementary Table S1. A high-TIL density was associated with normal CA19-9 levels (normal vs abnormal = 86.7% vs 13.3%, P = 0.001), and independent of the grade of tumor differentiation, tumor staging, lymph node metastasis, and CEA.
TILs Density and Other Predictive Factors for nCRT Response
Univariate and multivariate logistic regression analyses were performed to analyze 11 potential predictive factors of nCRT response. Univariate analysis showed TILs density (high vs low, odds ratio [OR] = 1.94, 95% confidence interval [CI] 1.12–3.37, P = 0.019), and neoadjuvant radiotherapy dose (OR = 6.18, 95% CI 1.70–22.4, P = 0.006) were predictor of nCRT response, and multivariate analysis further confirmed the correlation between TILs density (adjusted odds ratio [AOR] = 2.41, 95% CI 1.28–4.56, P = 0.007), neoadjuvant radiotherapy dose (AOR = 6.18, 95% CI 1.57–24.4, P = 0.009) and nCRT response ().
Table 2 Uni- and Multivariate Analyses
Discussion
In this work, we presented a digital-pathology-based method to calculate TILs density semi-automatically and proved that high-TIL density was associated with better tumor regression. The density of TILs could be the predictor of nCRT in LARC and be expected to apply in clinical as a routine diagnostic method to reduce the workload of pathologists.
In recent years, the identification of reliable predictors of nCRT response in LARC has gained increasing attention in several fields, including gene, radiology, and pathology. Differential expression levels of genes, such as FOXK family members and lncRNA, showed biologically meaningful associations to nCRT response,Citation16,Citation17 while this method is expensive for patients. In addition, as a significant tool to assess the tumor stage in LARC patients,Citation18 MRI was reported to predict nCRT response (AUC: 0.895).Citation19 However, the radiomic-based approach suffered from poor interpretability and robustness.
Pathology, as the gold standard for cancer diagnosis, is more suitable for the formulation of clinical routine treatment strategies. A large number of prognostic biomarkers were extracted and proved to be associated with nCRT response in pathological images. For example, a study found that tumors with organized stroma compared to disorganized stroma showed better responses to nCRT.Citation20 With accumulating evidence showing the association between radiotherapy results and immune processes, TILs density is convincing and interpretable in predicting nCRT response. To assess the density of TILs, some researches were based on immunohistochemistry,Citation21,Citation22 which may yield better results while with prohibitive financial pressures. In our study, evaluation based on H&E-stained WSIs has been recognized as a reliable, reproducible, and an inexpensive way. However, due to the dyeing effect and the confusion from other nuclei, calculating TILs density remains a challenge on H&E-stained WSIs.
In this work, we used a method based on preservation and subdivision to segment the nuclei, which paid more attention to the segmentation of overlapping and deeply stained nuclei instead of the edges of nuclei or the lightly stained nuclei, avoiding useless work. Furthermore, random forest performed best in this study, probably as the integration of decision trees, it is more suited for feature-based nuclei classification. Some researchers used deep learning to detect TILs,Citation23,Citation24 while high accuracy is associated with more data labels and requires better computational performance. The studies based on traditional methods still have some advantages in insufficient samples training and wide application.
The nCRT response was assessed using TRG system, and we found herein is that patients with high-TILs tend to have a higher major-responder rate than the low-TILs group (63.8% vs 47.6%, P = 0.026), indicating patients with a strong immune response may benefit from nCRT. In exploring the correlation analysis of TILs density with other potential factors, the CA19-9 showed the statistically significant difference between the high-density and low-density groups. However, this finding needs further validation. What is more, univariate and multivariate analyses showed the TILs density was a predictor for the nCRT response. Actually, the correlation between tumor regression and TILs density has been validated in several other studies.Citation25,Citation26 It has been reported that tumor regression after radiotherapy largely depends on the response of TILs, and TILs priming may be a critical event in nCRT response,Citation6,Citation21 which provides evidence for explaining the predictive value of TILs density.
Compared with other methods, the semi-automatic workflow we proposed is more suitable for patients' treatment planning before nCRT with its inexpensive, repeatable, and interpretable advantages, reducing pathologists’ workload. What’s more, the high-resolution heat map explained the calculation of TILs density decision results (), strengthened the interpretability of the classification model.
The varied response to nCRT in LARC patients indicates a complex relationship between tumor biology and response.Citation18 It is difficult to accurately predict with a single factor. Therefore, in the next study, we will pay attention to exploring the combination of quantitative TILs and spatial patterns of TILs distribution and do that full-automatically instead of semi-automatically.
The study we did was retrospective and patients were recruited from a single center. A large-scale independent prospective multicenter validation cohort was needed to assess the generalizability. Second, the follow-up information was not available in current data, and the impact of TILs on the survival of LARC patients is our future direction. Third, our method of extracting tumor-stromal regions relied on pathologist marked labels. In the next step, we will get rid of labeling and realize full-automatic extraction.
Conclusion
The density of TILs was calculated by the semi-automatic method and proved to be an independent predictor of nCRT response. Compared with directly viewing the pathological images, calculating the density of TILs with the proposed semi-automatic method is simpler and repeatable, which can effectively reduce the workload of the pathologist. This method can be easily introduced into routine pathology reports and used in the clinical setting to individualize patients' treatment.
Data Sharing Statement
The datasets used and/or analyzed during the current study are available from the corresponding author (Zaiyi Liu) on reasonable request.
Ethics Approval
This retrospective study was approved by the Sixth Affiliated Hospital of Sun Yat-sen University. Informed consent was waived since the retrospective nature of this study and the data were only obtained from hospital medical records. Patient data confidentiality were kept. Moreover, this study was consistent with the Declaration of Helsinki.
Author Contributions
All authors made a significant contribution to the work reported, whether that is in the conception, study design, execution, acquisition of data, analysis and interpretation, or in all these areas; took part in drafting, revising or critically reviewing the article; gave final approval of the version to be published; have agreed on the journal to which the article has been submitted; and agree to be accountable for all aspects of the work.
Disclosure
The authors declared no conflicts of interest.
Additional information
Funding
References
- Sung H, Ferlay J, Siegel RL, et al. Global cancer statistics 2020: GLOBOCAN estimates of incidence and mortality worldwide for 36 cancers in 185 countries. CA Cancer J Clin. 2021;71(3):209–249. doi:10.3322/caac.21660
- Jung S, Parajuli A, Yu CS, et al. Sensitivity of various evaluating modalities for predicting a pathologic complete response after preoperative chemoradiation therapy for locally advanced rectal cancer. Ann Coloproctol. 2019;35(5):275–281. doi:10.3393/ac.2019.01.07
- Maas M, Nelemans PJ, Valentini V, et al. Long-term outcome in patients with a pathological complete response after chemoradiation for rectal cancer: a pooled analysis of individual patient data. Lancet Oncol. 2010;11(9):835–844. doi:10.1016/S1470-2045(10)70172-8
- Rubio J, Cristóbal I, Santos A, et al. Low MicroRNA-19b expression shows a promising clinical impact in locally advanced rectal cancer. Cancers. 2021;13(6):1456. doi:10.3390/cancers13061456
- Cui Y, Yang X, Shi Z, et al. Radiomics analysis of multiparametric MRI for prediction of pathological complete response to neoadjuvant chemoradiotherapy in locally advanced rectal cancer. Eur Radiol. 2019;29(3):1211–1220. doi:10.1007/s00330-018-5683-9
- Lee Y, Auh SL, Wang Y, et al. Therapeutic effects of ablative radiation on local tumor require CD8+ T cells: changing strategies for cancer treatment. Blood. 2009;114(3):589–595. doi:10.1182/blood-2009-02-206870
- Twyman-Saint Victor C, Rech AJ, Maity A, et al. Radiation and dual checkpoint blockade activate non-redundant immune mechanisms in cancer. Nature. 2015;520(7547):373–377. doi:10.1038/nature14292
- Hendry S, Russell PA, John T. Assessing tumor-infiltrating lymphocytes in solid tumors: a practical review for pathologists and proposal for a standardized method from the International Immunooncology Biomarkers Working Group: part 1: assessing the host immune response, TILs in invasive breast carcinoma and ductal carcinoma in situ, metastatic tumor deposits and areas for further research. Adv Anat Pathol. 2017;24:235.
- Uryvaev A, Passhak M, Hershkovits D, Sabo E, Bar-Sela G. The role of tumor-infiltrating lymphocytes (TILs) as a predictive biomarker of response to anti-PD1 therapy in patients with metastatic non-small cell lung cancer or metastatic melanoma. Med Oncol. 2018;35(3):25. doi:10.1007/s12032-018-1080-0
- Chan LF, Sadahiro S, Suzuki T, et al. Tissue-infiltrating lymphocytes as a predictive factor for recurrence in patients with curatively resected colon cancer: a propensity score matching analysis. OCL. 2020;98(10):680–688. doi:10.1159/000506706
- Millar E, Browne L, Slapetova I, et al. TILs immunophenotype in breast cancer predicts local failure and overall survival: analysis in a large radiotherapy trial with long-term follow-up. Cancers. 2020;12(9):2365. doi:10.3390/cancers12092365
- Fusco N, Vaira V, Righi I, et al. Characterization of the immune microenvironment in malignant pleural mesothelioma reveals prognostic subgroups of patients. Lung Cancer. 2020;150:53–61. doi:10.1016/j.lungcan.2020.09.026
- Jiang D, Liu Y, Wang H, et al. Tumour infiltrating lymphocytes correlate with improved survival in patients with esophageal squamous cell carcinoma. Sci Rep. 2017;7(1):44823. doi:10.1038/srep44823
- Xu B, Salama AM, Valero C, et al. Histologic evaluation of host immune microenvironment and its prognostic significance in oral tongue squamous cell carcinoma: a comparative study on lymphocytic host response (LHR) and tumor infiltrating lymphocytes (TILs). Pathol Res Pract. 2021:153473. doi:10.1016/j.prp.2021.153473
- Salgado R, Denkert C, Demaria S, et al. The evaluation of tumor-infiltrating lymphocytes (TILs) in breast cancer: recommendations by an International TILs Working Group 2014. Ann Oncol. 2015;26(2):259–271. doi:10.1093/annonc/mdu450
- Zhang Y, Xu M, Chen J, et al. Prognostic value of the FOXK family expression in patients with locally advanced rectal cancer following neoadjuvant chemoradiotherapy. Onco Targets Ther. 2020;13:9185–9201. doi:10.2147/OTT.S255956
- Zhang Y, Guan B, Wu Y, et al. LncRNAs signature associated with chemoradiotherapy response and prognosis in locally advanced rectal cancer; 2021. doi:10.21203/rs.3.rs-452503/v1.
- Ryan JE, Warrier SK, Lynch AC, Ramsay RG, Phillips WA, Heriot AG. Predicting pathological complete response to neoadjuvant chemoradiotherapy in locally advanced rectal cancer: a systematic review. Colorectal Dis. 2016;18(3):234–246. doi:10.1111/codi.13207
- Chen W, Mao L, Li L, et al. Predicting treatment response of neoadjuvant chemoradiotherapy in locally advanced rectal cancer using amide proton transfer MRI combined with diffusion-weighted imaging. Front Oncol. 2021;11:2367. doi:10.3389/fonc.2021.698427
- Wang A, Zhang J, Tan C, et al. Stromal organization as a predictive biomarker of response to neoadjuvant therapy in locally advanced rectal cancer. J Gastrointest Surg. 2021;25(8):2116–2118. doi:10.1007/s11605-021-04920-7
- Akiyoshi T, Tanaka N, Kiyotani K, et al. Immunogenomic profiles associated with response to neoadjuvant chemoradiotherapy in patients with rectal cancer. Br J Surg. 2019;106(10):1381–1392. doi:10.1002/bjs.11179
- Akiyoshi T, Gotoh O, Tanaka N, et al. T-cell complexity and density are associated with sensitivity to neoadjuvant chemoradiotherapy in patients with rectal cancer. Cancer Immunol Immunother. 2021;70(2):509–518. doi:10.1007/s00262-020-02705-6
- Shaban M, Khurram SA, Fraz MM, et al. A novel digital score for abundance of tumour infiltrating lymphocytes predicts disease free survival in oral squamous cell carcinoma. Sci Rep. 2019;9(1):13341. doi:10.1038/s41598-019-49710-z
- Linder N, Taylor JC, Colling R, et al. Deep learning for detecting tumour-infiltrating lymphocytes in testicular germ cell tumours. J Clin Pathol. 2019;72(2):157–164. doi:10.1136/jclinpath-2018-205328
- Sawada R, Akiyoshi T, Kitagawa Y, et al. Systemic inflammatory markers combined with tumor-infiltrating lymphocyte density for the improved prediction of response to neoadjuvant chemoradiotherapy in rectal cancer. Ann Surg Oncol. 2021. doi:10.1245/s10434-021-09975-z
- Shinto E, Omata J, Sikina A, et al. Predictive immunohistochemical features for tumour response to chemoradiotherapy in rectal cancer. BJS Open. 2020;4(2):301–309. doi:10.1002/bjs5.50251