
Abstract
Purpose
Despite the rise in opioid-related hospitalizations, there has been little research regarding opioid-related healthcare utilization. The objective of this study was to estimate the mean adjusted hospital costs, payments, and length of stay (LOS) for opioid-related visits for the nation and each of the nine US census regions.
Methods
An observational study of retrospective claims data from the Vizient health system database was conducted. Eligible visits had a principal diagnosis of opioid use or dependence defined by ICD, ninth and tenth revision (ICD-9/10), and occurred between January 2014 and June 2017. Separate regression models for inpatient and outpatient visits were generated to estimate the adjusted costs, payments, and LOS for opioid-related visits.
Results
A total of 193,614 (32,713 inpatient and 160,901 outpatient) visits met the inclusion criteria. The overall adjusted mean cost, payment, and LOS for an inpatient opioid-related visit were $4,383 (range between regions: $2,894–$5,835), $6,689 (range between regions: $4,038–$9,001), and 4.35 days (range between regions: 3.8–5.7 days), respectively. The overall adjusted mean cost and payment for an outpatient opioid-related visit were $533 (range between regions: $395–$802) and $374 (range between regions: $187–$574), respectively. Opioid-related hospital costs, payments, and LOS varied across the US. Data on the regional variation and national averages are necessary for hospitals to benchmark their services and more effectively manage this population.
Conclusion
Future research should examine intraregion utilization to understand the effect of prices and level of services.
Introduction
The economic burden of the opioid crisis has been well documented with recent annual estimates exceeding $100 billion and 53,000 deaths.Citation1–Citation4 Acute care hospitals are often on the frontline of the opioid crisis, and with the passage of the Affordable Care Act of 2010, hospitals are taking a more proactive approach to manage this population.Citation5 Overdose victims arrive often through the emergency department (ED), and the hospital becomes the initial treatment center.Citation6,Citation7 Overall, the rate of opioid-related inpatient stays and ED visits has increased, 76% and 117%, respectively, from 2005 to 2014.Citation8 The magnitude of increase in opioid-related visits has been shown to vary widely based on patient location.Citation9 Small metropolitan areas have seen an even larger increase (121%) in inpatient stays and ED visits over this same time period.
A wide geographic variation in opioid-related deaths and visits has been documented previously.Citation4,Citation9–Citation12 In 2015, the Northeast and Midwest regions had heroin overdose death rates about twice as high as the South and nearly three times as high as the West after controlling for population.Citation4 For instance, Arkansas and Iowa consistently rank among the lowest for ED opioid-related visits, and Iowa, Nebraska, Texas, and Wyoming rank among the lowest for opioid-related inpatient visits.Citation12 On the other hand, Connecticut and Massachusetts in the Northeast and Maryland in the Mid-Atlantic regions consistently rank among the highest in both inpatient and emergency opioid-related visits.Citation12 There was almost a sixfold difference in opioid-related inpatient stays between the state with the fewest (Iowa, 72.7 stays per 100,000) and the highest (Maryland, 403.8 stays per 100,000).Citation12 Likewise, ED visits varied nearly 10-fold (Iowa, 45.1 visits per 100,000 and Massachusetts, 450.2 visits per 100,000) across states.Citation12
One may expect to find similar geographic variation in hospital spending associated with opioid-related visits (cost and payment). Numerous studies have documented variation in pricing and services across the US.Citation13–Citation19 These studies have found that differences in pricing and utilization drive geographic variation after adjusting for patient demographics and hospital characteristics. The most recent estimates suggest that the typical hospital will lose $82 per discharge across all clinical services.Citation17 However, these estimates vary by geography with estimated loss of $236 per patient in the Northeast to a profit of $45 per visit in the West.Citation17 There is a lack of objective and recent data quantifying the scope of the opioid epidemic within the hospital including associated costs, payments, and length of stay (LOS).Citation18 This knowledge gap prevents hospitals from effective benchmarking and hinders performance improvements addressing the opioid crisis. The objective of this study was to estimate the mean adjusted hospital costs, payments, and LOS for opioid-related visits at both a national and regional level.
Materials and methods
Data source
The Vizient health system data include inpatient and hospital-based outpatient administrative claim and detailed billing data across all payers for more than 400 acute care hospitals.Citation20 The claims data include the principal diagnosis and all reported secondary diagnoses on the claim. Data are updated twice a month with a 30–45-day lag from month end and include more than 50 million visits annually. Hospitals in the Vizient health system data represent 41 states across USA and include a mix of urban and rural, large and small, and teaching and nonteaching facilities. These hospitals are primarily located in urban areas with bed sizes ranging from 16 to 2,391 (median 215). Ambulatory surgery centers and freestanding outpatient clinics are not included. These data are generally representative of the US hospital population as hospitals are predominately small to midsize, nonteaching facilities located in an urban setting.
All data used in this study were deidentified in conformance with the requirements of the Health Insurance Portability and Accountability Act (HIPAA). The institutional review board of the Xavier University exempted this study from review.
Patient visit identification
Any inpatient or outpatient visit with a principal diagnosis code related to opioid addiction, abuse, misuse, or dependence occurring between January 1, 2014, and June 30, 2017, was eligible for study inclusion. Opioid-related visits were identified using ICD, ninth and tenth revision (ICD-9/10), diagnosis codes: 304.0x, 304.7x, 305.5x, 965.0x, F11.x, and T40.0x to T40.3x. This broad definition includes both prescription and nonprescription abuse of opioids, including heroin, carfentanil, and fentanyl. This definition is intentionally broad due to the various definitions of opioid-related visits reported in the literature and is considered a better capture of true opioid-related visits compared to the reliance on secondary diagnosis codes.Citation21–Citation24 To be included in the study, a patient was required to be greater than 1 year old at the time of admission and had a principal diagnosis code noted previously. This composite definition is referred to as “opioid-related visit” in this study.
Statistical analyses
Primary outcomes of interest were visit-related costs, payments, and, for inpatient admissions, LOS. Visit costs were calculated using hospital-specific cost-to-charge ratios. All data were stratified by the nine US census regions: East North Central, East South Central, Mid-Atlantic, Mountain, New England, Pacific, South Atlantic, West North Central, and West South Central as well as by inpatient vs outpatient setting. Patient and hospital characteristics were summarized with percentages for categorical data and mean and SD for continuous data. Outcome data were summarized with mean, median, and SD.
Generalized linear regression models (GLMs) with a gamma distribution and log link were used to estimate the mean cost, payment, and LOS of opioid-related visits by the US census region. The models were constructed separately for inpatient and outpatient visits. Results were reported for the nine regions and overall USA and included the 95% CI of the adjusted estimate. A stepwise regression approach was used to include statistically significant patient and hospital characteristics. A P-value of 0.01 was used to identify statistically significant covariates due to the large sample size. Covariates included in the models were age, sex, Charlson Comorbidity Index (CCI), insurance provider, hospital bed size, teaching status, urban status, and ownership status. Discharge year was included in the model to control for changes in cost and payment over time. In addition, the following comorbidities associated with opioid use were included as model covariates: alcohol disorders, anxiety disorders, bipolar disorder, depression, hepatitis (acute and chronic), and the history of substance abuse. The CCI score was calculated using secondary diagnosis codes present on the claim as well as any previous diagnoses for that patient. All analyses were performed using SPSS v24 (IBM Corporation, Armonk, NY, USA).
Results
A total of 193,614 opioid-related visits were identified between January 1, 2014, and June 30, 2017: outpatient visits, 160,901; greatly outnumbered inpatient visits, 32,713 (). The female outpatient population ranged from a low of 42% in the New England region to a high of 60% in the East South Central and West North Central regions (). In the inpatient setting, the female population ranged from a low of 38% in New England to a high of 58% in the West North Central region. The average age was about 40 years with a range of 36.5 years (East North Central outpatient) to 48.6 years (West North Central inpatient). Generally, the patients were discharged to home; however, discharge status was unknown or missing for a significant number of visits. Inpatient visits were much more likely to leave against medical advice (range: 3%, West North Central, to 15%, Mid-Atlantic). Payer information was largely unknown except in the Mid-Atlantic region, where Medicaid was the predominant payer comprising 49% of outpatient visits and 34% of inpatient visits.
Figure 1 Attrition diagram.
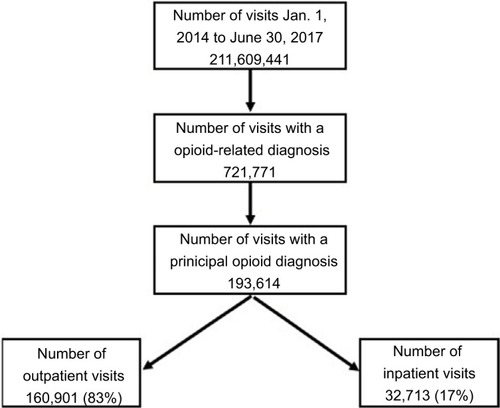
Table 1 Patient characteristics
The CCI, a measure of severity of illness, indicated that patients were healthier in the hospital outpatient department compared to those who were admitted.Citation25 The mean CCI for outpatient visits ranged from 0.4 in the East North Central region to 0.8 in the South Atlantic. Outpatient mortality ranged from 0.3% in the Pacific region to 0.1% in New England. The CCI for inpatient visits ranged from a low of 0.7 in the West South Central region to a high of 2.5 in the South Atlantic. Inpatient mortality ranged from 1.9% in the West South Central region to 4.8% in New England. Alcohol disorders, anxiety disorders, and depression were the most common comorbid conditions reported. The outpatient setting rates of hepatitis (acute and chronic) ranged from 0.4%, West North Central, to 4.0%, Mountain. Hepatitis (acute and chronic) was considerably more prevalent in the inpatient population and ranged from 4.0%, West North Central, to a high of 21.3%, New England.
The most common procedure across all regions performed for inpatient opioid-related visits was detoxification, whereas the most common procedure in the outpatient setting was injection of a therapeutic substance (ie, buprenorphine and naloxone). Inpatient opioid-related visits generally originated through the ED, and outpatient opioid-related visits were generally elective visits. Those opioid-related visits resulting in an admission had an average LOS of 4.4 days (range: 3.8–5.7).
The characteristics of the hospitals by region and care setting are summarized in . Generally, the hospitals were nonprofit, located in urban areas, and had both inpatient and outpatient opioid-related visits. Most hospitals treating opioid-related visits in the study population were nonteaching hospitals. The exception was in the East South Central region, where teaching hospitals composed 58.0% and 60.0% of hospitals treating outpatient and inpatient opioid-related visits, respectively.
Table 2 Hospital characteristics
The overall unadjusted average cost of an opioid-related visit was $532 and $6,853 for outpatient and inpatient vis its, respectively (). Correspondingly, the overall unadjusted payment was $585 for outpatient and $8,731 for inpatient visits. The East South Central region had the lowest outpatient and inpatient costs ($341 and $4,314). The highest payment was in the West South Central ($746) and Pacific ($9,873) regions for outpatient and inpatient visits, respectively. The overall average LOS was 5.5 days with a range of 4.3 (East North Central region) to 7.1 (Mid-Atlantic region).
The adjusted estimates for outpatient and inpatient opioid visits by the nine regions are reported in . The models included patient and hospital characteristics and are summarized in and as these covariates were found to be significant predictors of the outcome variables. The overall outpatient adjusted estimates were $533 and $374 for cost and payment, respectively. The Mid-Atlantic region had the lowest outpatient cost ($395), and the Mid-Atlantic region had the lowest outpatient payment ($187). The highest cost and payment regions for outpatient visits were West South Central ($802) and Pacific ($574). In the inpatient setting, the overall adjusted cost, payment, and LOS were $4,383, $6,689, and 4.4 days, respectively. The region with the lowest estimated cost and payment was East South Central at $2,894 and $4,038, respectively. The lowest LOS was found in East North Central and Mountain regions at an average of 3.8 days. The regions with the highest cost, payment, and LOS were Pacific ($6,671), Mountain, ($9,001), and Mid-Atlantic (5.7 days), respectively.
Table 3 Adjusted cost, payment, and LOS
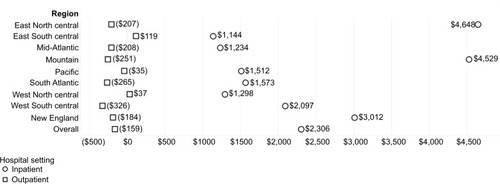
Hospital benefit or loss, the difference between adjusted mean payment and cost, varied considerably across the regions (). In the outpatient setting, hospitals were predicted to lose $159 per opioid-related visit, although there was nearly a fourfold difference between the regions with the highest profit margin (East South Central, $119) and the lowest (West South Central, $326). In the inpatient setting, the typical hospital was expected to profit $2,306 per visit. The variation across regions was similar to the outpatient setting with a fourfold difference between the regions with the highest profit margin (East North Central, $4,648) and the lowest (East South Central, $1,144).
Figure 2 Hospital net benefit/loss based on adjusted mean results.
Discussion
Not surprisingly, this study found a wide geographic variation in costs, payments, and LOS for opioid-related hospital visits even after adjusting for patient demographics and hospital characteristics. These findings provide insight into the opioid crisis in the hospital setting due to the recentness of the data and the provision of regional adjusted estimates. The requirement of an opioid-related principal diagnosis code provided a reliable depiction of the opioid crisis from the hospital perspective.Citation21–Citation24 Hospitals might use this information to benchmark their own opioid-related visits with hospitals in their region to understand the burden of the opioid epidemic.
Hospitals overall were expected to have a net loss of $159 per outpatient opioid-related visit. In five of the nine regions, the hospital outpatient department had a net loss of more than $200 per opioid visit. The high propensity of elective outpatient hospital visits combined with procedures for injecting therapeutic substances suggests that patients are receiving addiction-related treatment and the hospital received less than the amount necessary to cover their services. The data used for this analysis cannot confirm this hypothesis, but if it were true, it suggests a potent disincentive for a hospital to provide services for patients seeking treatment for opioid abuse and misuse. Further, this finding complements studies that have found significant variation in addiction-related treatment capacity.Citation26–Citation28 The hospital outpatient department may be the setting of last resort for those unable to access treatment elsewhere.
Inpatient opioid-related visits provided on average a net benefit of $2,306 per visit. The substantial net benefit appears to provide an incentive to the hospital to initiate a treatment program. Although there was a wide variation in the magnitude of the net benefit, hospitals in all nine regions received a higher payment for an opioid-related inpatient visit compared to the cost with a minimum of $1,100 after costs across all regions. The East North Central region had the highest net benefit of $4,648, closely followed by the Mountain region.
Although most patients treated in the hospital inpatient setting were discharged to home, approximately one in 10 patients, regardless of region, was likely to leave against medical advice, suggesting that he/she did not complete the detoxifi-cation treatment or his/her pain was undertreated. Further, less than 12% of inpatient opioid-related visits were discharged to a post-acute care facility to continue their treatment.
This is the first study to examine the health care utilization (cost, payment, and LOS) of opioid-related visits from the hospital perspective. This particular population is a vulnerable population with higher (ED) utilization, hospitalizations, and increased healthcare utilization compared to patients with no opioids in their system.Citation22,Citation26,Citation27 Consistent with the published research on geographic variation in healthcare utilization and spending, the findings of this study indicate a wide geographic variation in hospital-provided health care utilization for opioid-related visits.Citation29 Further, this study found that outpatient opioid-related visits may not be financially viable for the hospital. Changes in payment structure or perhaps greater availability and accessibility to less intensive sites of care for treatments related to opioid abuse may be necessary to effectively manage this population.
Limitations
The use of hospital administrative claims data incurs several noteworthy limitations. First, the data used in the analysis included 451 hospitals across the US. The hospitals are not nationally representative, although the large number of visits and hospitals in each US region compare favorably to the distribution of hospitals in the American Hospital Association Survey.Citation29 Second, the use of claims data may underreport the occurrence of opioid-related visits due to the stigma associated with drug use.Citation30 Furthermore, the primary purpose of hospital claims data is to support the financial accounting of the hospital rather than capture complete clinical data. Thus, it is possible that relevant clinical information on the severity of the visit was missing. However, we have no reason to suspect that this possible bias either overestimates or underestimates our results.Citation31,Citation32 It is also important to note that data used in this analysis did not allow examination of visits at smaller geographic levels, repeat visits, and secondary diagnoses indicating the presence of opioids or to follow the patient across the continuum of care postdischarge. Despite these limitations, hospital claims data remain an important source of health data, especially when investigating health care utilization.Citation33
Conclusion
This study demonstrated that there is significant geographic variation in the mean hospital cost, payment, and LOS for an opioid-related visit across the nine US regions after accounting for differences in patient and hospital characteristics. The estimates of cost, payment, and LOS will enable healthcare providers and policy makers to better estimate the impact of the opioid epidemic for their specific geographic region by care setting. As hospitals take a more active role in the opioid epidemic, having regional data on costs, payments, and LOS in addition to national data will allow for more effective benchmarking. Future research should examine the role of price and intensity of services to ascertain the practices, which may alleviate this significant burden on hospitals and payers.
Acknowledgments
The authors would like to thank Vizient Inc. for providing the data used in this study and Mrs Kristin Dale for her thoughtful comments to an earlier draft of this study.
Supplementary material
Table S1 Unadjusted cost, payment, and LOS
Disclosure
The authors report no conflicts of interest in this work.
References
- The Underestimated Cost of the Opioid CrisisWhite House Council of Economic Advisers (CEA)2017 Available at: https://www.whitehouse.gov/sites/whitehouse.gov/files/images/The%20Underestimated%20Cost%20of%20the%20Opioid%20Crisis.pdfAccessed November 25, 2017
- RhyanCNThe Potential Societal Benefit of Eliminating Opioid Overdoses, Deaths, and Substance Abuse Disorders Exceeds $95 Billion Per YearAnn ArborAltarum, Inc.2017
- FlorenceCSZhouCLuoFXuLThe economic burden of prescription opioid overdose, abuse, and dependence in the United States, 2013Med Care2016541090190627623005
- Drug Poisoning Mortality in the United States, 1999–2015 [Homepage on the Internet]National Center for Health Statistics (NCHS): Centers for Disease Control and Prevention Available from: https://www.cdc.gov/nchs/data-visualization/drug-poisoning-mortality/Accessed November 29, 2017
- Managing Population HealthThe Role of the HospitalHealth Research & Educational TrustChicagoManaging Population Health2012
- StevensJPWallMJNovackLMarshallJHsuDJHowellMDThe critical care crisis of opioid overdoses in the United StatesAnn Am Thorac Soc201714121803180928800256
- HsuDJMccarthyEPStevensJPMukamalKJHospitalizations, costs and outcomes associated with heroin and prescription opioid overdoses in the United States 2001-12Addiction201711291558156428191702
- HCUP Fast Stats [homepage on the Internet]Healthcare Cost and Utilization Project (HCUP)Rockville, MD, USAAgency for Healthcare Research and Quality2017 Available from: www.hcup-us.ahrq.gov/faststats/opioid/opioiduse.jsp?location1=US&characteristic1=01&setting1=IP&location2=US&characteristic2=01&setting2=ED&expansionInfoState=hide&dataTablesState=hide&definitionsState=hide&exportState=hideAccessed October 30, 2018
- WeissAJBaileyMKO’MalleyLPatient Characteristics of Opioid-Related Inpatient Stays and Emergency Department Visits Nationally and by State, 2014RockvilleAgency for Healthcare Research and Quality2017
- KruegerABWhere Have All the Workers Gone? An Inquiry into the Decline of the US Labor Force Participation RateBrookings Papers on Economic Activity (BPEA)2017187
- TopmillerMVissmanACarrozzaMDetermining Medication-Assisted Treatment (MAT) Capacity in High Need AreasPoster presented at the: North American Primary Care Research Group (NAPCRG) 45th Annual MeetingNovember 2017Montreal, Quebec
- WeissAJElixhauserABarrettMLOpioid-Related Inpatient Stays and Emergency Department Visits by State, 2009–2014Rockville, MD, USAAgency for Healthcare Research and Quality2016
- CubanskiJNeumanT homepage on the InternetThe Latest on Geographic Variation in Medicare Spending: A Demographic Divide Persists but Variation Has NarrowedWashington, DCKaiser Family Foundation2015 Available from: https://www.kff.org/medicare/report/the-latest-on-geographic-variation-in-medicare-spending-a-demographic-divide-persists-but-variation-has-narrowed/Accessed October 30, 2018
- NewhouseJPGarberAMGeographic variation in health care spending in the United States: insights from an institute of medicine reportJAMA2013310121227122824008265
- BaickerKAmitabhCSkinnerJSWho you are and where you live: how race and geography affect the treatment of medicare beneficiariesHealth Aff (Millwood)2004334415318565
- SkinnerJFisherERegional disparities in Medicare expenditures: an opportunity for reformNatl Tax J1997503413425
- BaiGAndersonGFA more detailed understanding of factors associated with hospital profitabilityHealth Aff2016355889897
- ClarkeJLSkoufalosAScrantonRThe American opioid epidemic: population health implications and potential solutions. report from the national stakeholder panelPopulation Health Management201619S1S10
- HorwitzJRMaking profits and providing care: comparing nonprofit, for-profit, and government hospitalsHealth Aff2005243790801
- IncVizientNew Hanover Regional Medical Center2017 Available from: www.vizientinc.comAccessed January 23, 2018
- ChandwaniHSStrasselsSARascatiKLLawsonKAWilsonJPEstimates of charges associated with emergency department and hospital inpatient care for opioid abuse-related eventsJ Pain Palliat Care Pharmacother201327320621323879214
- WhiteAGBirnbaumHGMarevaMNDirect costs of opioid abuse in an insured population in the United StatesJ Manag Care Pharm200511646947915998164
- HeslinKCOwensPLKaracaZBarrettMLMooreBJElixhauserATrends in opioid-related inpatient stays shifted after the US Transitioned to ICD-10-CM Diagnosis Coding in 2015Med Care2017551191892328930890
- American Psychiatric Association (APA)Diagnostic and Statistical Manual of Mental Disorders5th edWashington, DCAmerican Psychiatric Association2013
- CharlsonMSzatrowskiTPPetersonJGoldJValidation of a combined comorbidity indexJ Clin Epidemiol19944711124512517722560
- NoskaAMohanAWakemanSRichJBoutwellAManaging opioid use disorder during and after acute hospitalization: a case-based review clarifying Methadone regulation for acute care settingsJ Addict Behav Ther Rehabil201542112
- ShanahanCWBeersDAlfordDPBrigandiESametJHA transitional opioid program to engage hospitalized drug usersJ Gen Intern Med201025880380820237960
- JonesCMCampopianoMBaldwinGMccance-KatzENational and state treatment need and capacity for opioid agonist medication-assisted treatmentAm J Public Health20151058e55e63
- American Hospital Association [homepage on the Internet]AHA Hospital Statistics 2018 Edition2662018 Available from: https://www.aha.org/statistics/2016-12-27-aha-hospital-statistics-2018-editionAccessed October 30, 2018
- RuetschCEmpirical view of opioid dependenceJ Manag Care Pharm2010161 Suppl B913
- FisherESWhaleyFSKrushatWMThe accuracy of Medicare’s hospital claims data: progress has been made, but problems remainAm J Public Health19928222432481739155
- O’MalleyKJCookKFPriceMDMeasuring diagnoses: ICD code accuracyHealth Serv Res2005405 Pt 21620163916178999
- Tessier-ShermanBGalushaDTaiwoOAFurther validation that claims data are a useful tool for epidemiologic research on hypertensionBMC Public Health20131313323311702