Kaşıkcı E, Aydemir E, Bayrak ÖF, Şahin F. Onco Targets Ther. 2020;13:5763–5777.
The authors have advised that errors were made during the selection of images used for and on pages 5769 and 5774, respectively. The corrected and are shown below.
The authors wish to explain that the new images were collected from another experimental repeat which occurred on a different day to those shown in the original publication. This does not change the results or calculations as the images are only representative of the groups described. Cells were counted from all the experimental and technical repeats and the statistical analysis was performed using cell numbers from the entire slide. Counting and imaging was not done at the same time.
The authors wish to apologize for the error.
Figure 3 Snail, Slug and Twist expression lessen invasiveness. (A) Microscope images of invasive cells that passed through the Matrigel (100x magnification). (B) Graphical representation of the percentage of invasive cells shows the relative percentages of invasive cells. The number of invaded cells significantly decreases with EMT-ATF silencing (***p<0.0-1). Scale bar represents 100 μm.
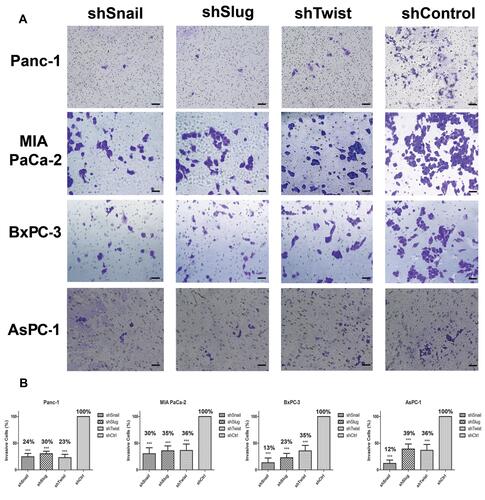
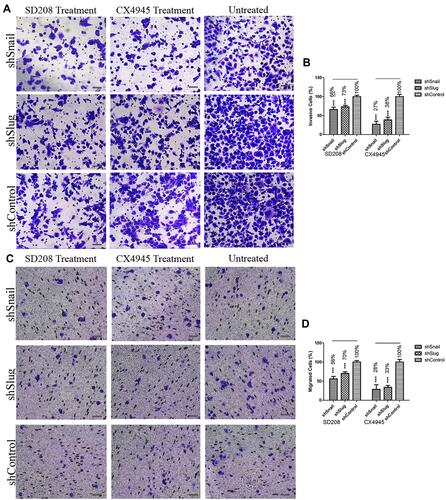
Figure 8 EMT-ATF silencing accompanied by small molecule inhibitors decreases the invasiveness and mobility of AsPC-1 cells. Microscope images of invaded (A) and migrated (C) AsPC-1 cells after different treatments. Graphical representation of invaded (B) and migrated (D) cell percentages (***p<0.001). Scale bar represents 100 μm.