 ?Mathematical formulae have been encoded as MathML and are displayed in this HTML version using MathJax in order to improve their display. Uncheck the box to turn MathJax off. This feature requires Javascript. Click on a formula to zoom.
Abstract
Objective
This study aimed to examine the expression of immune suppression factors and the mechanisms of antitumor effects of cord blood dendritic cells (DCs) stimulated by soluble cluster of differentiation 40 ligand (sCD40L) and cytokines in vitro in ovarian cancer patients.
Methods
The expression levels of interleukin (IL)-10 and transforming growth factor (TGF)-β messenger RNA in peripheral blood were detected by reverse transcription polymerase chain reaction; expression levels of CD80 and CD86 in DCs stimulated by sCD40L were detected using flow cytometry and confocal laser scanning microscopy.
Results
Expression levels of IL-10 and TGF-β genes in the peripheral blood of ovarian cancer patients were significantly increased compared with patients with benign ovarian tumors (P < 0.05). The expression levels of CD80 and CD86 in DCs cultured in the granulocyte-macrophage colony-stimulating factor + IL-4 + stem cell factor + Flt-3 ligand + sCD40L group were significantly increased compared with those in the control group, as assessed by flow cytometry and confocal laser scanning microscopy (P < 0.05).
Conclusion
A variety of cytokines in combination with sCD40L can promote the proliferation of cord blood-derived DCs and induce their maturation as well as stimulating a specific antitumor response.
Introduction
Ovarian cancer is one of the most common types of gynecological malignant tumor. It usually remains asymptomatic until the tumor grows large enough to interfere with the function of other pelvic or abdominal organs. Although the clinical treatment of ovarian cancer by surgery in combination with chemotherapy and radiotherapy is effective, no significant milestones have been achieved in improving patients’ overall survival and quality of life.Citation1 This could perhaps be attributed to the advancement of disease. Approximately 75%–80% of patients are diagnosed late and the 5-year survival rate is <30%.Citation1,Citation2 In recent years, gene immunotherapy has provided an important new direction in the treatment of cancer patients.Citation3,Citation4 The cluster of differentiation 40 ligand (CD40L) is a type II transmembrane glycoprotein and belongs to the tumor necrosis factor (TNF) superfamily.Citation5 The interaction between cluster of differentiation (CD) 40 and CD40L is central to T cell-dependent humoral immune responses. Recent work has shown that the CD40 pathway is crucial in the generation of cytotoxic T cell responses.Citation5,Citation6 Further, our previous work demonstrated that forced expression of CD40L in ovarian cancer cells resulted in growth inhibition and sensitization to apoptosis, and produced T cell-dependent systemic immunity and anti-liver-metastatic effects by upregulating the Th1 cytokines of dendritic cells (DCs).Citation7,Citation8
The CD40L has three parts: cytoplasmic area, transmembrane area, and the area outside the plasma membrane. Recent studiesCitation9,Citation10 have revealed that the outer plasma membrane section of the CD40L can be dissolved by enzymatic action and then released into the blood circulation in the form of a soluble protein, soluble cluster of differentiation 40 ligand (sCD40L), which preserves the partial biological activity of CD40L. According to recently published research,Citation11 there are differences between the sCD40L in the blood of ovarian cancer patients and healthy people. Results showed significantly increased levels of serum sCD40 and sCD40L in women with ovarian tumors in comparison to the control group (P < 0.0001).Citation11 However, the relevant mechanisms involved in the direct interaction between sCD40L and DCs and in the antitumor effect of sCD40L remain unclear.
In context of the previous work on ovarian cancers, the present study aimed to detect the expression of the immune suppression factors in the microenvironment of ovarian cancer patients and explore the feasibility of utilizing sCD40L for ovarian cancer immunotherapy.
Materials and methods
Patients
Patients with ovarian cancer and benign ovarian tumors were selected from the Department of Gynecology and Obstetrics of the Fourth Hospital of Hebei Medical University, People’s Republic of China. Thirty patients with ovarian cancer were selected: three had stage 1 ovarian cancer, three had stage 2, 18 had stage 3, and six had stage 4. The mean age of these patients was 51 years. Most ovarian cancer patients were in late stages (stages 3 and 4) at the time of diagnosis.
Materials
Cord blood was obtained from the Obstetric Department of the Fourth Hospital of Hebei Medical University and the human ovarian carcinoma cell line SKOV3 was preserved by the Research Center of the same hospital. Recombinant protein of human granulocyte-macrophage colony-stimulating factor (GM-CSF), interleukin (IL)-4, stem cell factor (SCF), Flt-3 ligand (Flt-3L), TNF-α, and sCD40L were purchased from PeproTech (PeproTech Inc., Rocky Hill, NJ, USA); phycoerythrin (PE)-labeled CD86 antibody and fluorescein isothiocyanate-labeled CD80 antibody were purchased from eBioscience (San Diego, CA, USA). A two-step reverse transcription polymerase chain reaction (RT-PCR) kit was purchased from Promega (Fitchburg, WI). An enzyme-linked immunosorbent assay (ELISA) kit for human IL-23 was purchased from ADL (ADL Biotech Inc., Mashteuiatsh, QC, Canada) and an ELISA kit for human TNF-α was purchased from R&D Systems (Minneapolis, MN, USA).
Molecular biology techniques
Separation of peripheral blood mononuclear cells (PBMCs) from blood samples
Peripheral blood (about 4 mL) was collected in ethylenediaminetetraacetic acid (EDTA) tubes from each category of patients: those with ovarian cancer and those with benign ovarian tumors. Blood samples were mixed with equal volume of phosphate-buffered saline (PBS). The mixture was then layered onto the surface of an equal volume of Ficoll-Hypaque gradient and centrifuged at 2000 rpm/min for 30 minutes at room temperature. Following this, the white blood cells concentrated in the middle layer (PBMC layer) were removed rinsed with 10 mL PBS and centrifuged at 1500 rpm/min for 30 minutes at room temperature. The supernatant was decanted and the remaining cell fraction was rinsed gently with PBS. This process was repeated twice and the PBMCs were isolated and used for further assays.
Detection of immunosuppressive cytokine (IL-10 and transforming growth factor [TGF]-β) messenger (m) RNA expression in PBMCs by RT-PCR
Total RNA was extracted from each PBMC sample according to the manual of the RNA isolation kit (Life Technologies, Carlsbad CA, USA), and the concentration and purity of RNA were determined. From each sample, 1 mg RNA was retro-transcribed into cDNA and then 2 μL of cDNA from each sample was amplified using polymerase chain reaction. For detecting IL-10, 25 μL of the amplification reaction mixture contained IL-10 2.5 μL upstream primer 5′-CCGACAG-GATGCAGAAGGAGAT-3′ and 2.5 μL downstream primer 5′-GTCAAGAAAGGG-TGTAACGCAACT-3′; the amplified fragment length was 265 bp. The pre-denaturation reaction was carried out at 95°C for 2 minutes. After denaturation at 94°C for 60 seconds, 35 cycles were performed under the following conditions for primer-mediated RT-PCR: annealing at 54°C for 60 seconds, extension at 72°C for 60 seconds, and a final extension at 72°C for 5 minutes.
For detecting human TGF-β, 25 μL of the amplification reaction mixture contained human TGF-β 2.5 μL upstream primer 5′-GAGAGGAGCGACGAAGAG-3′ and 2.5 μL downstream primer 5′-TGGACTTGAGAATCTGATATAGC-3′; the amplified fragment was 250 bp. The pre-denaturation reaction was carried at 95°C for 2 minutes. After denaturation at 94°C for 60 seconds, 35 cycles were performed under following conditions for primer-mediated RT-PCR: annealing at 55°C for 60 seconds, extension at 72°C for 60 seconds, and a final extension at 72°C for 5 minutes.
For detecting human β-actin, the amplification reaction mixture contained human β-actin upstream primer 5′-CCGA-CAGGATGCAGAAGGAGAT-3′ and downstream primer 5′-GTCAAGAAAGGGTGTAACGCAACT-3′; the amplified fragment was 238 bp. The pre-denaturation reaction was carried at 94°C for 5 minutes. After denaturation at 94°C for 50 seconds, 35 cycles were performed under following conditions for primer-mediated RT-PCR: annealing at 58°C for 50 seconds, extension at 72°C for 60 seconds, and a final extension at 72°C for 8 minutes. Gene amplification products (6.0 μL) were separated from each sample using 1.5% agarose gel (containing 0.5 mg/ethidium bromide) and scanned by Gel-Pro 3.1 analysis software (Media Cybernetics, Rockville, MD, USA).
Isolation of cord blood mononuclear cells (CBMCs)
Cord blood (approximately 60 mL) from 70 healthy full-term pregnant female patients was collected at the local obstetric hospital under sterile conditions; heparin was added as an anticoagulant. The procedure used for the isolation of the CBMCs was the same as that followed for isolation of the PBMCs. The collected CBMCs were resuspended in Roswell Park Memorial Institute (RPMI) 1640 culture medium containing 10% fetal bovine serum and the concentration was adjusted to 2 × 10⁶ cells/mL. Then 2 mL of the cell suspension was then placed in each well of a six-well culture plate and cultured in humidified incubator at 37°C with 5% CO2 atmosphere for 2 hours. After the incubation period the culture medium was gently decanted and replaced with 2 mL fresh RPMI 1640 complete medium for the induction and culture of DCs.
Biological activity variation in DCs induced by sCD40L Induction and culture of DCs in vitro
Adherent cells cultured in six-well culture plates were divided into four groups – A, B, C, and D – for treatment. Cells in A and B groups were treated with 100 ng/mL GM-CSF and 50 ng/mL IL-4 respectively, for induction of DCs. After 5 days, cells in Group A were treated with GM-CSF and IL-4 and cells in Group B were treated with TNF-α (10 ng/mL), GM-CSF, and IL-4. Cells in Groups C and D were treated with cytokines GM-CSF, IL-4, SCF (20 ng/mL), and Flt-3l (15 ng/mL) for DC induction. After 5 days, cells in Group C were treated with TNF-α (10 ng/mL), GM-CSF, and IL-4 and cells in Group D were treated with sCD40L (20 ng/mL), GM-CSF, and IL-4. Cells in each group were cultured at 37°C with 5% CO2. After 7 days, the cells were collected for subsequent experiments.
Detection of DC phenotypes by flow cytometry (FCM) and confocal laser microscopy (CLSM)
DCs cultured for 7 days were harvested and adjusted to a concentration of 1 × 10⁶/mL. Cells were rinsed twice with PBS and incubated with 10 μL PE-labeled CD86 monoclonal antibody and 10 μL fluorescein isothiocyanate-labeled CD80 monoclonal antibody for 30 minutes at room temperature, away from the light. Once rinsed with PBS, cells were analyzed by FCM and CLSM to detect the protein expression level of CD80 and CD86. A Zeiss LSM 510 confocal laser scanning microscope (Oberkochen, Germany) was used.
Detection of relative mRNA expression levels by RT-PCR
RNA was extracted from the DCs and collected as explained earlier. The mRNA expression levels of Th1 (IL-23, IL-27) cytokines, Th2 (IL-10) cytokines, immunosuppressive molecule (TGF-β), transcription factors (signal transducer and activator of transcription 4 [STAT4], T-box expressed in T cells [T-bet]), and C-C chemokine receptor type 7 (CCR7) were detected using RT-PCR. The following primer sequences were used:
IL-23 primers: upstream 5′-GGACACATGGATC-TAAGAG-3′, downstream 5′-CTTGGAATCTGCTG-AGTC-3′; the amplified fragment was 293 bp
IL-27 primers: upstream 5′-TTCATCTCCACCACG-CTTCAG-3′, downstream 5′-CTTCCTCTCCTCCTCC-TCCTC-3′; amplified fragment was 213 bp
STAT4 primers: upstream 5′-CCAATGTCAGTCAG-TTACCTAATG-3′, downstream 5′-GCAACAGCCG-TTCCTTCTC-3′; the amplified fragment was 396 bp
T-bet primers: upstream 5′-GAGGTGAACGA-CGGAGAG-3′, downstream 5′-TGGGTAGGAGA-GGAGAGTAG-3′; the amplified fragment was 262 bp
CCR7 primers: upstream 5′-TGAGGTCACGGAC-GATTAC-3′, downstream 5′-CCAGGTTGAGCAG-GTAGG-3′; the amplified fragment length was 224 bp.
Primers and reaction conditions of β-actin, IL-10, and the TGF-β gene were as described earlier in this paper. The polymerase chain reaction amplification conditions are presented in .
Table 1 Reaction conditions for reverse transcription polymerase chain reaction
Measurement of TNF-α and IL-23 cytokine expression levels by ELISA in DC culture supernatant
TNF-α and IL-23 cytokines expression levels were measured in the supernatant of DCs cultured for 7 days using the respective ELISA kit according to the manufacturer’s instructions.
Measurement of IL-12 and IL-23 cytokine expression levels using Western blot in DC culture supernatant
The total protein of logarithmic phase cells in each group was extracted, and the protein concentration was detected using Bicinchoninic acid assay. Protein (30 μg) from each group was collected and mixed with 6× sample buffer, then the mixture was boiled at 100°C for 5 minutes and subsequently separated with sodium dodecyl sulfate polyacrylamide gel electrophoresis. The sample thus obtained was transferred to polyvinylidene fluoride (PVDF) membrane and used for Western blot assay. The PVDF membrane was incubated in 5% nonfat milk for 1 hour in a horizontal shaker at room temperature. Then the PVDF membrane was sealed in a plastic bag and incubated with diluted primary antibodies (IL-23 and IL-12 subunits P19 and P35, and glyceraldehyde 3-phosphate dehydrogenase antibodies) at 4°C overnight. The primary antibodies were removed and the membrane was washed three times for 10 minutes each time with Tris-buffered saline with Tween® 20 buffer. PVDF membrane sealed in a plastic bag was incubated with diluted fluorescent secondary antibody (1:20,000 dilutions) at 37°C for 1 hour. The secondary antibody was removed and again the membrane was washed three times for 10 minutes each time with Tris-buffered saline with Tween® 20 buffer. Following this, the membrane was scanned using an Odyssey® two-color infrared fluorescence scanning system (Model No: 9120 PT002482. LI-COR Biosciences GMBH, Ransbach-Baumbach, Germany) and the results were analyzed. There were three groups: Group A, GM-CSF+IL-4; Group B, GM-CSF+IL-4+SCF+Flt-3l+TNF-α; and Group C, GM-CSF+IL-4+SCF+Flt-3l+sCD40L.
Effect of DCs induced by sCD40L on the proliferation of T cells
Preparation of T cells
Nonadherent mononuclear cells were collected as described earlier and cultured with RPMI 1640 complete medium containing 40 U/mL IL-2 cytokine. Half of the dose of culture medium was replaced with fresh medium every 2–3 days. After 7 days of culture, cells were prepared for subsequent experiments.
Mixed lymphocyte reaction
Cultured DCs were collected from each group then incubated for 45 minutes at room temperature in RPMI 1640 culture medium containing 25 μg/mL of mitomycin C as stimulator. Homogeneous suspension cells were collected as explained earlier and treated as reaction cells. Cells were cultured in a 96-well culture plate. The ratios of stimulator cell to reaction cell were as follows: 1:10, 1:20, and 1:40. Each sample was prepared for three replicate wells. The final volume of culture medium in each well was 200 μL and the cell concentration was adjusted as necessary to 2 × 10⁵ T cells per well. The control group of T cells was also prepared for replication in three wells. Cells were cultured at 37°C with 5% CO2 for 72 hours. After the incubation period, 20 μL 3-(4,5-Dimethylthiazol-2-yl)-2,5-diphenyltetrazolium bromide (MTT) (5 mg/mL) was added to each well. Then the cells were cultured for another 4 hours. The cells were harvested and centrifuged, and the supernatant was removed. Following this procedure, 150 μL dimethyl sulfoxide was added to each well and the plate was shaken for 10 minutes before using a microplate reader to detect the absorbance. The optical density (OD) value was detected at 570 nm. The result of each group was expressed by the mean value of the three replicate wells. Cell stimulation index (SI) was analyzed using the formula: SI = experimental group OD 570 nm/control group OD 570 nm.
Detection by RT-PCR of mRNA levels of Th1-type cytokine interferon (IFN)-γ secreted by T cells
Cells were cultured and treated as described earlier (Groups A, B: GM-CSF+IL-4; Groups C, D: GM-CSF+IL-4+SCF+Flt-3l). After culturing for 5 days, cells were again cultured with T lymphocytes induced from cord blood CBMCs in six-well plates at the ratio of 1:10 and IL-2 cytokine was added to each well to adjust the final concentration to 1000 U/mL. Only T cells were present in Group A; Groups B and C were treated with TNF-α, and Group D was treated with sCD40L. That is, Group A contained T cells, Group B contained GM-CSF+IL-4+TNF-α+DC+T, Group C contained GM-CSF+IL-4+SCF+Flt-3l+TNF-α+DC+T, and Group D contained GM-CSF+IL-4+SCF+Flt-3l+sCD40L+DC+T. Cells were cultured for 48 hours and collected for the extraction of the total cellular RNA, and then the IFN-γ expression level was detected by RT-PCR with the IFN-γ primers upstream 5′-ATGAAATATACAAGTTATATCTTGGCT-TT-3′ and downstream 5′-GATGCTCTTCGACCTCGAA-ACAGCAT-3′, with the amplified fragment 494 bp. In the reaction, the initial denaturation was carried out at 95°C for 2 minutes. After denaturation at 94°C for 60 seconds, 35 cycles were performed under the following conditions for primer-mediated RT-PCR: annealing at 55°C for 60 seconds, extension at 72°C for 60 seconds, and a final extension at 72°C for 7 minutes.
Culture of human ovarian carcinoma cell line SKOV3 and antigen loading of DCs
The SKOV3 cells were cultured with RPMI 1640 medium containing 10% fetal bovine serum at 37°C with 5% CO2 in an incubator. Cells were digested with 0.25% of trypsin and passaged. Cells that grew exponentially were used for subsequent experiments. The ovarian cancer SKOV3 cells were collected at logarithmic growth phase and the cell concentration was adjusted to 2 × 10⁷/mL. These cells were then repeatedly frozen in liquid nitrogen and thawed thrice in 37°C water bath. Following this procedure, cells were centrifuged at 4000 rpm/min for 20 minutes and the antigens were acquired from the supernatant by filtering through a 5 μm microporous filter membrane. DCs cultured for 5 days were treated with 100 μL tumor antigens acquired as described previously for 2 days then the cells were collected for further assays.
Killing effect of cytotoxic T lymphocytes (CTLs) on SKOV3 cells detected by MTT assay
T lymphocytes were cultured with RPMI 1640 at a concentration of 1 × 10⁶/mL. DCs with or without antigen loading were cultured at a concentration of 1 × 10⁵/mL. T lymphocytes (100 μL) and DCs (100 μL) were co-cultured with effector cells in 96-well culture plates plus cytokines (IL-2) at a final concentration of 1000 U/mL. A blank control group was set and cells were cultured at 37°C with 5% CO2 for 24 hours before adding the SKOV3 cells as target cells. Ratios of the effector cells to target cells were set as 10:1, 20:1, and 40:1. Each cell group contained three wells as follows: wells containing target cells alone; wells containing effector cells alone, which were set as control groups; and wells containing RPMI 1640 as the blank control group. Cells were cultured at 37°C with 5% CO2 for 72 hours. After the incubation period 20 μL of MTT (5 mg/mL) was added to each well and culturing was continued for another 4 hours. Following this, the cells were harvested centrifuged and the supernatant was decanted. Subsequently, 150 μL dimethyl sulfoxide was added to each well and the plates shaken for 10 minutes before using a microplate reader to detect the absorbance. The OD was recorded at 492 nm; the results for each group are expressed as the mean value of the three wells. Effector cells were divided into the following three groups: Experimental Group I: GM-CSF+IL-4+ SCF+Flt3l+sCD40L+freeze-thaw antigen+DC+T cells, Experimental Group II: GM-CSF+IL-4+SCF+Flt3l+freeze-thaw antigen+DC+T cells, and Experimental Group III: T cells alone. Cytotoxic activity was determined using the formula: killing activity (%) = [1 − (OD (E + T) − ODE)/ODT] × 100%, in which “OD (E + T)” represents the additive absorbance values of the effector cells (E) and target cells (T), “ODE” represents the absorbance value of the effector cells, and “ODT” represents the absorbance value of the target cells.
Statistical analysis
All data were statistically analyzed using SPSS statistical software (v 13.0; IBM, Armonk, NY, USA). Quantitative data are presented as
± seconds (mean ± standard deviation). Comparisons between two groups were performed using Student’s t-test, where appropriate, and comparisons between more than two groups were performed using one-way analysis of variance. Statistical significance was set at P < 0.05.
Results
IL-10 and TGF-β mRNA expression levels in peripheral blood of patients with ovarian cancer or ovarian cysts
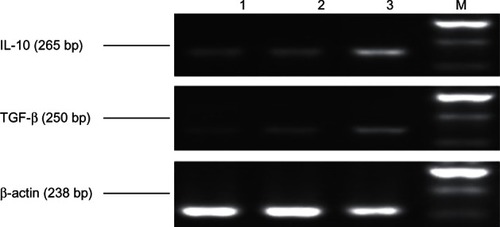
The IL-10 and TGF-β mRNA expression levels in the peripheral blood of patients with ovarian cancer were found to be 0.625 ± 0.046 and 0.325 ± 0.039, respectively, which were significantly higher than in patients with benign ovarian tumors (patients with ovarian cysts had IL-10 and TGF-β mRNA expression levels of 0.190 ± 0.023 and 0.080 ± 0.016, respectively, and patients with uterine fibroids had IL-10 and TGF-β mRNA expression levels of 0.625 ± 0.046 and 0.325 ± 0.039, respectively) (P < 0.05) (). The mRNA expression of IL-10 and TGF-β in PBMCs in the healthy controls (0.189 ± 0.041 and 0.089 ± 0.015, respectively) was not significantly different from that in patients with benign ovarian cysts but was significantly different from that in patients having ovarian cancers.
Figure 1 Expression of interleukin (IL)-10, transforming growth factor (TGF)-β messenger RNA in patients (n = 30) detected by using reverse transcription polymerase chain reaction.
Cytokine-mediated effects on the morphology, quantity, and function of DCs from cord blood
Separation, culture, and morphological observation of DCs
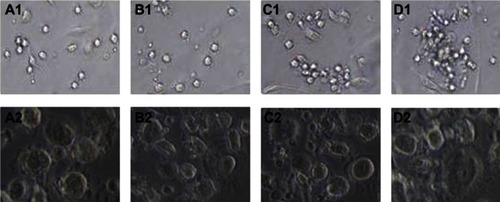
During the process of differentiation of CBMCs into DCs, morphological changes in DCs were induced by different cytokine combinations. On the first day, the majority of cells were round and adherent cells. On the third day, floating cells were observed and clusters of adherent cells began to gather and form colonies. On the fifth day, the floating cells had gradually increased in the sCD40L-induced group, were irregular in shape, and had enlarged volume, finally growing into colonies. On the seventh day, the clusters of cells were scattered and prominent burr-like protuberances were observed on the surface of the enlarged cells. Similar morphological changes were observed in cells in the TNF-α-induced group, while the cells in the immature DC (GM-CSF+IL-4) group were smaller and had fewer surface protrusions. On the seventh day, some of the cells had spindle-macrophage cell morphology. The DCs were significantly induced in those groups treated with SCF + Flt-3L compared to the untreated groups ().
Figure 2 Effect of different cytokines on the morphology of dendritic cells derived from cord blood. (A1) GM-CSF+IL-4 cultured for 5 days (×200); (A2) GM-CSF+IL-4 cultured for 7 days (×400); (B1) GM-CSF+IL-4+TNF-α cultured for 5 days (×200); (B2) GM-CSF+IL-4+TNF-α cultured for 7 days (×400); (C1) GM-CSF+IL-4+SCF+Flt-3l+TNF-α cultured for 5 days (×200); (C2) GM-CSF+IL-4+SCF+Flt-3l+TNF-α cultured for 7 days (×400); (D1) GM-CSF+IL-4+SCF+Flt-3l+sCD40L cultured for 5 days (×200); (D2) GM-CSF+IL-4+SCF+Flt-3l+sCD40L cultured for 7 days (×400).
FCM and CLSM analyses of DC surface molecule expression
FCM revealed that, after 7 days of culture, the expression levels of CD80 and CD86 on the surface of DCs induced by GM-CSF+IL-4+SCF+Flt-3l+sCD40L were 61.510% ± 1.163% and 78.160% ± 1.810%, respectively; these were significantly higher than in other groups (P < 0.05). No significant difference was observed in the expression levels of CD80 and CD86 molecules on the surface of DCs between the GM-CSF+IL-4+TNF-α- and GM-CSF+IL-4+SCF+Flt-3l+TNF-α-treated groups (P > 0.05). However, expression levels of CD80 and CD86 in both groups were significantly higher than in the GM-CSF+IL-4 control group (P < 0.05) ( and ).
Figure 3 Expression of cluster of differentiation (CD) 80 and CD86 on dendritic cells cultured with different cytokines as determined by flow cytometry. (A1) GM-CSF+IL-4 cultured with CD86; (A2) GM-CSF+IL-4 cultured with CD80; (B1) GM-CSF+IL-4+TNF-α cultured with CD86; (B2) GM-CSF+IL-4+TNF-α cultured with CD80; (C1) GM-CSF+IL-4+SCF+Flt-3l+TNF-α cultured with CD86; (C2) GM-CSF+IL-4+SCF+Flt-3l+TNF-α cultured with CD80; (D1) GM-CSF+IL-4+SCF+Flt-3l+sCD40L cultured with CD86; (D2) GM-CSF+IL-4+SCF+Flt-3l+sCD40L cultured with CD80.
Abbreviations: Flt-3l, Flt-3 ligand; GM-CSF, granulocyte-macrophage colony-stimulating factor; IL, interleukin; sCD40L, soluble CD40 ligand; SCF, stem cell factor; TNF, tumor necrosis factor.
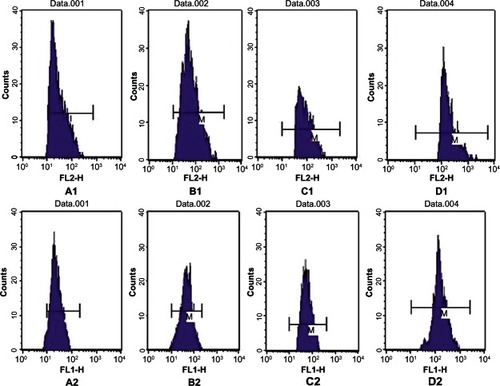
Table 2 Expression of cluster of differentiation (CD) 80 and CD86 in dendritic cells (DCs) cultured with different cytokines as determined by flow cytometry (mean % ± standard deviation)
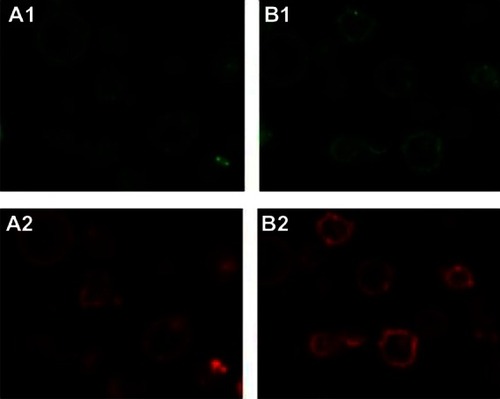
Cells were prepared for immunofluorescence assay and labeled with fluorescent antibodies for observation under CLSM. Strong green (CD80) and red fluorescence (CD86) on the surface of DCs was observed in the GM-CSF+IL-4+SCF+Flt-3l+sCD40L group ().
Figure 4 Expression of cluster of differentiation (CD) 80 and CD86 in dendritic cells surface cultured with different cytokines under laser scanning confocal microscope (×630). (A1) GM-CSF+IL-4+SCF+Flt-3l+TNF-α cultured with CD80; (A2) GM-CSF+IL-4+SCF+Flt-3l+TNF-α cultured with CD80; (B1) GM-CSF+IL-4+SCF+Flt-3l+sCD40L cultured with CD80; (B2) GM-CSF+IL-4+SCF+Flt-3l+sCD40L cultured with CD86.
RT-PCR detection of mRNA expression levels of cytokines IL-23, IL-27, STAT4, T-bet, CCR7, IL-10, and TGF-β secreted by DCs when induced with different stimulating factors
RT-PCR revealed that the mRNA expression levels of IL-23, IL-27, STAT4, T-bet, and CCR7 secreted by DCs when induced with GM-CSF+IL-4+SCF+Flt-3l+sCD40L were 0.641 ± 0.037, 0.453 ± 0.043, 1.142 ± 0.069, 1.283 ± 0.148, and 0.710 ± 0.051, respectively, which were significantly higher than in the other groups (P < 0.05) ( and ). No significant difference was observed in the expression levels of IL-23, IL-27, STAT4, T-bet, and CCR7 between the GM-CSF+IL-4+TNF-α-treated group and GM-CSF+IL-4+SCF+Flt-3l+TNF-α-treated group (P > 0.05). However, expression levels of those cytokines in both groups were significantly higher than in the GM-CSF+IL-4-induced group (P < 0.05). The mRNA expression levels of IL-10 and TGF-β secreted by DCs when induced with GM-CSF+IL-4+SCF+Flt-3l+sCD40L were 0.127 ± 0.025 and 0.090 ± 0.018, respectively, which were significantly lower than in other groups (P < 0.05) ( and ).
Figure 5 Expression of IL-23, IL-27, STAT4, T-bet, CCR7, IL-10 and TGF-β mRNA on DCs with different cytokines.
Abbreviations: CCR7, C-C chemokine receptor type 7; Flt-3l, Flt-3 ligand; GM-CSF, granulocyte-macrophage colony-stimulating factor; IL, interleukin; sCD40L, soluble cluster of differentiation 40 ligand; SCF, stem cell factor; STAT4, signal transducer and activator of transcription 4; T-bet, T-box expressed in T cells; TGF, transforming growth factor.
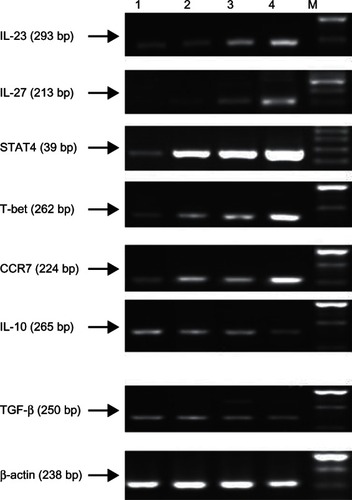
Table 3 Expression of interleukin (IL)-23, IL-27, signal transducer and activator of transcription (STAT4), T-box expressed in T cells (T-bet), C-C chemokine receptor type 7 (CCR7), IL-10, and transforming growth factor (TGF)-β messenger RNA in dendritic cells (DCs) (mean ± standard deviation)
Measurement of TNF-α and IL-23 cytokine expression levels by ELISA in DC culture supernatant when induced with different stimulating factors
ELISA revealed that expression levels of TNF-α and IL-23 when induced with GM-CSF+IL-4+SCF+Flt-3l+sCD40L were 172.15 ± 8.421 pg/mL and 24.485 ± 2.256 pg/mL, respectively, which were significantly higher than in other groups (P < 0.05). No significant difference was observed in the expression levels of TNF-α and IL-23 between the GM-CSF+IL-4+TNF-α-treated group and the GM-CSF+IL-4+SCF+Flt-3l+TNF-α-treated group (P > 0.05), but the expression levels of TNF-alpha and IL-23 were significantly higher in all other groups compared to the GM-CSF + IL4 treated group (P < 0.05) ().
Table 4 The levels of tumor necrosis factor (TNF)-α and interleukin (IL)-23 in culture supernatants from dendritic cells (DCs) with or without soluble CD40 ligand (sCD40L) (mean ± standard deviation, pg/mL)
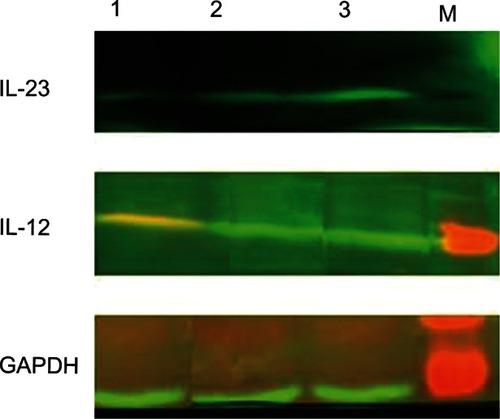
Measurement of IL-12 and IL-23 cytokine expression levels by Western blot in DC culture supernatant when induced with different stimulating factors
The Western blot results showed that P35 and P19 expression levels of IL-12 and IL-23 subunits in the GM-CSF+IL-4+SCF+Flt-3l+sCD40L group were significantly higher than in the GM-CSF+IL-4+SCF+Flt-3l+TNF-α and GM-CSF+IL-4 groups (P < 0.05) ().
Figure 6 Expression of IL-23 and IL-12 proteins on dendritic cells cultured with or without sCD40L (Western blot).
Abbreviations: Flt-3l, Flt-3 ligand; GAPDH, glyceraldehyde 3-phosphate dehydrogenase; GM-CSF, granulocyte-macrophage colony-stimulating factor; IL, interleukin; sCD40L soluble cluster of differentiation 40 ligand; SCF, stem cell factor; TNF, tumor necrosis factor.
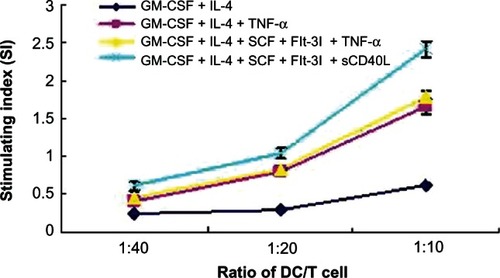
DC variation induced by sCD40L on the proliferation ability and killing effect of homogeneity variant T cells Stimulated effect of DCs induced by sCD40L on the proliferation of homogeneity variant T cells
DCs, cultured for 5 days, were collected as stimulator cells and co-cultured with homogeneity variant T cells and then T lymphocyte proliferation was detected via MTT assay. MTT assay revealed that the proliferation ability of T cells stimulated with GM-CSF+IL-4+SCF+Flt-3l+sCD40L-induced DCs was significantly higher than other groups (P < 0.05). The proliferation ability of T cells stimulated with GM-CSF+IL-4+TNF-α-induced DCs was similar to that of those stimulated with GM-CSF+IL-4+SCF+Flt-3l+TNF-α-induced DCs, but both were significantly higher than that of those stimulated with GM-CSF+IL-4-induced DCs (P < 0.05). Moreover, the proliferation ability of T cells was stronger and the SI was 2.41 ± 0.11 – this was highest when DCs were co-cultured with homogeneity variant T cells in a ratio of 1:10 and was significantly higher than that observed with the ratios 1:20 (SI = 1.04 ± 0.06) and 1:40 (SI = 0.61 ± 0.06) ().
Figure 7 Proliferation of allogenetic T lymphocytes induced by dendritic cells (DCs) stimulated with or without sCD40L.
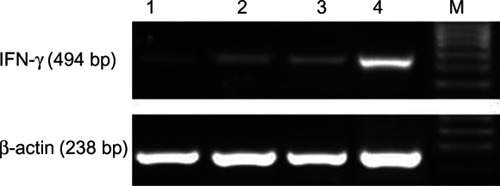
Detection of IFN-γ mRNA levels via RT-PCR when T cells were co-cultured with DCs induced with different stimulating factors
RT-PCR revealed that the IFN-γ mRNA expression level in the GM-CSF+IL-4+SCF+Flt-3l+sCD40L+DC+T group was 0.770 ± 0.080, which was significantly higher than in the other groups (P < 0.05). The IFN-γ mRNA expression levels in the GM-CSF+IL-4+DC+T group, GM-CSF+IL-4+TNF-α+DC+T group, and GM-CSF+IL-4+SCF+Flt-3l+TNF-α+DC+T group were 0.202 ± 0.011, 0.371 ± 0.373 and 0.427 ± 0.030, respectively ().
Figure 8 The expression of interferon (IFN)-γ secreted by T cells when co-cultured with dendritic cells (DCs).
Abbreviations: Flt-3l, Flt-3 ligand; GM-CSF, granulocyte-macrophage colony-stimulating factor; IL, interleukin; sCD40L, soluble cluster of differentiation 40 ligand; SCF, stem cell factor; TNF, tumor necrosis factor.
Killing effect of CTLs stimulated by DCs loaded with freeze-thaw antigen on human ovarian cancer cell line SKOV3
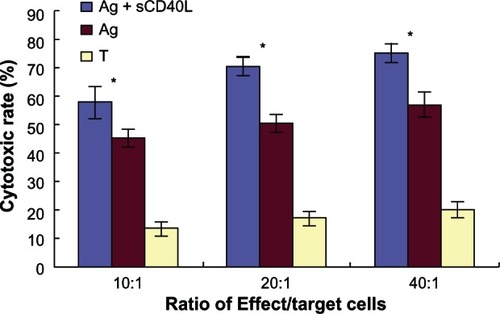
When DCs were induced with freeze-thawed antigens and sCD40L, the killing rates of DCs to stimulate CTLs against SKOV3 were 57.89% ± 5.82%, 70.69% ± 3.29%, and 75.37% ± 3.55% at effector to target cells ratios of 10:1, 20:1, and 40:1, respectively. However, when DCs were induced with freeze–thawed antigens without sCD40L, the killing rates of DCs to stimulate CTLs against SKOV3 were 45.40% ± 3.42%, 50.16% ± 3.31%, and 57.11% ± 4.46% at effector to target cells ratios of 10:1, 20:1 and 40:1, respectively. Finally, the killing rates of T cells alone against SKOV3 were 13.40% ± 2.48%, 17.05% ± 2.29%, and 20.67% ± 2.31%, at effector to target cells ratios of 10:1, 20:1 and 40:1, respectively. Hence, it was observed that with the same effector to target cells ratios, the killing rate of DCs to stimulate CTLs against SKOV3 when DCs were induced with freeze–thawed antigens and sCD40L was significantly higher than in the group containing DCs induced with freeze–thaw antigens but without sCD40L and the group containing T cells alone (P < 0.05) ().
Figure 9 The cytotoxicity of cytotoxic T lymphocytes stimulated by dendritic cells loaded with thawed antigen.
Abbreviations: Ag, antigen; sCD40L, soluble cluster of differentiation 40 ligand; T, T cells.
Discussion
The present experimental results show that IL-10 and other immunosuppressive molecules released by tumor cells were present in ovarian cancer patients. These immunosuppressive molecules can reduce the expression of CD80, CD86, and other co-stimulatory molecules on the surface of DCs. They can also reduce the secretion of IL-12 Th1-type cytokines, block T cell antitumor activity, and promote tumor angiogenesis, which ultimately affects the occurrence and development of ovarian cancer.Citation12,Citation13 In this study, RT-PCR was used to detect the expression levels of IL-10 and TGF-β in the peripheral blood of patients with ovarian cancer or ovarian cysts. The results show that expression levels of IL-10 and TGF-β immunosuppressive factors in ovarian cancer patients were significantly higher than those in patients with benign ovarian tumors. Our study results suggest that a large number of IL-10 and TGF-β immune inhibitors present in ovarian cancer patients can reduce the immune function of cancer patients. Therefore, we envisage that gene immunotherapy may be one therapy effective in improving the quality of life and survival of patients with ovarian cancer.
In recent years, much attention has been paid to DC-based gene immunotherapy, and there are numerous ways of inducing DC maturation. In this study, we first induced the generation of cord blood-derived DCs and then increased the number of DCs by inducing with SCF and Flt-3l. Further, sCD40L was added to induce the maturation of cord blood-derived DCs. Our study found that when CBMCs were cultured with an early application of the cytokines GM-CSF and IL-4 in combination with the DC-specific growth factors SCF and Flt-3l, more DCs with larger volumes and prominent burr-like surface protuberances were developed. Moreover, the survival time of the DCs was significantly prolonged with improved biological activity. These results indicate that the combination of cytokines SCF and Flt-3l can promote cord blood CD34+ stem cells to differentiate into DCs, thus leading to a significant increase in the number of DCs.
As an immune regulatory molecule in the body, CD40L can effectively stimulate the proliferation and differentiation of T cells through ligation of CD40–CD40L, thereby enhancing the role of T cells in specifically killing tumor cells.59 Previous studies have shown that when recombinant human soluble cluster of differentiation 40 ligand (rhsCD40L) is added to a culture containing immature DCs, the DC phenotypes change significantly, with a substantial increase in the expression levels of CD1α, CD80, CD83, CD86, HLA-DR, and other immune co-stimulatory molecules. Moreover, the secretion of IL-12p70 is also significantly increased.Citation14 In this study, we found the typical morphological characteristics of mature DCs, such as irregular dendritic protuberances on the surface and enlarged cell volume, when they were induced with sCD40L. Moreover, FCM and CLSM results showed that expression levels of the co-stimulatory molecules CD80 and CD86 on the surface of the DCs were significantly increased compared with groups in which DCs were induced with sCD40L (). In addition, the co-stimulatory molecules on the DC surface could bind to CD28 on the surface of T cells, thus improving the identification of T cell responses against tumor antigens and providing a second activation signal for T cell activation. Therefore, consistent with the results of previous studies,Citation7,Citation8,Citation15 our study suggests that sCD40L can promote DC maturation and expression levels of CD80 and CD86 molecules on DC surface and enhance DCs’ antigen-presenting ability.
The specific mechanism involved in the DC antitumor effect remains unclear. In this study, the RT-PCR results show that when DCs were induced with sCD40L, expression of IL-23, IL-27, IFN-γTh1-type cytokines, transcription factor STAT4, and T-bet involved in the Th0–Th1 differentiation pathway as well as secretion of the chemokine receptor CCR7 were significantly increased. Simultaneously, ELISA and Western blot assays were performed to detect the expression levels of IL-23, IL-27, and TNF-α. It has been reported that IL-23 can promote activated T cells and DCs, which induces IFN-γ and IL-12 cytokine secretion, thereby enhancing CD4+ Th1 immune response and the antitumor effect of CD8+ T cells.Citation16 IL-27 can induce the proliferation of naive T cells and also acts in synergy with IL-12-induced enhancement of naive T cells in the secretion of IFN-γ and generation of CTLs.Citation17
Previous studies have shown that the differentiation of Th0 cells to Th1 cells is mainly carried out through the STAT4/T-bet pathway,Citation18 with the STAT4 gene playing an important role in the Th1 cell differentiation process. STAT4 is the only transcription factor in the human body able to regulate the production of IFN-γ, which adversely affects IL-12 and promotes Th1 cell differentiation. The transcription factor T-bet, a member of the T-box family, is produced in cells when STAT4 is activated. T-bet mainly mediates the Th1 cell-signal pathway and contributes to the increased production of IFN-γ, adversely affecting T cells and promoting the secretion of cell-surface mole cule IL-12Rβ2. The binding of IL-12Rβ2 to IL-12 can effectively promote the activation of STAT4, forming positive feedback for Th1 differentiation.Citation19 During the differentiation process from immature to mature DCs, the antigen-uptake ability decreases while the migrating and activation ability of antigens gradually strengthens, thus expressing the receptor CCR7 that can combine with the lymphoid tissue chemokines (CCL19, CCL21).
Previous studies have shown that IL-10 itself can inhibit DC differentiation and maturation, but when co-cultured with sCD40L, it can reverse the inhibitory effect of IL-10 on DCs by inhibiting the expression of cell-surface IL-10R.Citation20 We detected expression levels of the Th2 cytokine IL-10 and the immunosuppressive molecule TGF-β in DCs when induced with sCD40L, and both were significantly lower than in the other groups. IL-10 has a major immunoinhibitory effect on Th2 cytokines. TGF-β has an inhibitory effect on the proliferation, differentiation, and antitumor activity of CD4+ and CD8+ T cellsCitation21 while promoting the production of IL-10 Th2-type cytokines and inhibiting the Th1-type immune response.Citation12 The results of our study suggest that sCD40L-induced DCs promote sCD40L-induced DCs role in gathering T cells as well as stimulating the secretion of cytokines IL-23, IL-27, and TNF-α, and promote naive T cells to differentiate into Th1-type cells via the STAT4/T-bet pathway, while enhancing IFN-γ secretion by Th1 cells and inhibiting Th2 cell function, thereby effectively regulating the cellular immune function and enhancing the antitumor immune response.
Many experiments have confirmed that DCs activated by different forms of tumor antigens can produce a strong antitumor effect. Feng et al found that when DCs were induced with freeze-thawed antigens the killing rates of DCs to stimulate CTLs against SKOV3 was significantly higher.Citation22 We induced DCs with freeze-thaw antigens in combination with sCD40L to verify whether sCD40L could enhance the inhibition effect of DCs to stimulate CTLs on the proliferation of SKOV3 cells. In this study, we acquired the antigens by repeatedly freezing and thawing SKOV3 cells. The T cells alone or CTLs generated from DCs loaded with antigens and induced with or without sCD40L were the effector cells, while SKOV3 cells were prepared as target cells. MTT assays were performed to detect the killing rate of the effector cells against the target cells. The specific killing effect of DCs to stimulate CTLs on ovarian cancer cells was obviously stronger than that in the group containing DCs induced with sCD40L and the group containing T cells alone. The higher killing rate of ovarian cancer cells was accompanied with an increased effector to target cell ratio. These results suggest that sCD40L can enhance the ability of mature DCs presenting specific tumor antigens and enhances the induction of specific CTLs, thus inhibiting the proliferation of tumor cells.
Conclusion
The results of this study demonstrate that the combined effect of sCD40L with various cytokines can promote the proliferation of cord blood-derived DCs, induce their maturation, and stimulate specific antitumor response. When combining CD40 on DC, sCD40L promoted the secretion of Th1 cytokines (IL-23, IL-27, and TNF-α) and suppressed the secretion of IL-10 and TGF-β, thereby facilitating the differentiation of T lymphocytes into Th1 through the upregulation of STAT4/T-bet. This effectively stimulated cellular immunity and antigen-stimulated tumor-specific CTL effect. IL-10 and TGF-β mRNA expression levels in the peripheral blood of patients with ovarian cancer were significantly higher than in patients with benign ovarian tumors and uterine fibroids. During the process of differentiation of CBMCs into DCs, morphological changes in DCs occurred when induced by the different cytokine combinations. The expression levels of CD80, CD86, TNF-α, and IL-23 on the surface of DCs induced by GM-CSF+IL-4+SCF+Flt-3l+sCD40L were significantly higher than in other groups. The mRNA expression levels of IL-23, IL-27, STAT4, T-bet, and CCR7 secreted by DCs when induced with GM-CSF+IL-4+SCF+Flt-3l+sCD40L were significantly higher than other groups. In addition, the P35 and P19 expression levels of IL-12 and IL-23 subunits in the GM-CSF+IL-4+SCF+Flt-3l+sCD40L group were significantly higher than in the GM-CSF+IL-4+SCF+Flt-3l+TNF-α and GM-CSF+IL-4 groups. This study represents a new and promising approach for the application of sCD40L-induced cord blood DCs in clinical immunotherapy for the prevention of ovarian cancer.
Acknowledgments
This work was supported by the Hebei Province Medical Science Research Key Task Projects, Strong Characteristic Discipline in Colleges and Universities in Hebei Province, and the Hebei Provincial Department of Health Research Project (20090166).
Disclosure
The authors declare no conflicts of interest in this work.
References
- SeamonLGRichardsonDLCopelandLJEvolution of the Gynecologic Oncology Group protocols in the treatment of epithelial ovarian cancerClin Obstet Gynecol201255113115522343234
- AACR-gynecological cancer: controlling recurrent ovarian cancerNat Rev Clin Oncol [Internet]2012 Available at http://www.nature.com/nrclinonc/journal/v9/n6/full/nrclinonc.2012.79.html
- ZhangYQTsaiYCMonieAWuTCHungCFEnhancing the therapeutic effect against ovarian cancer through a combination of viral oncolysis and antigen-specific immunotherapyMol Ther201018469269920087318
- UrbanskaKLanitisEPoussinMA universal strategy for adoptive immunotherapy of cancer through use of a novel T-cell antigen receptorCancer Res20127271844185222315351
- BennettSRCarboneFRKaramalisFFlavellRAMillerJFHeathWRHelp for cytotoxic-T-cell responses is mediated by CD40 signallingNature199839366844784809624004
- DiaconuICerulloVHirvinenMLImmune response is an important aspect of the antitumor effect produced by a CD40L-encoding oncolytic adenovirusCancer Res20127292327233822396493
- ZhangZMLiuJZhangFHInhibitory effects of enhanced expression of CD40L in ovarian cancer OVHM cells on the liver metastases in miceZhonghua Zhong Liu Za Zhi2009317505509 Chinese19950697
- ZhangZMZhangFHWangXMEnhanced expression of CD40L cDNA on ovarian cancer cell line OVHM induces the secretion of Th1 cytokines from dendritic cellsZhonghua Zhong Liu Za Zhi2008303174178 Chinese18756930
- OnaitisMWKaladyMFEmaniSAbdel-WahabZTylerDSPruittSKCD40 ligand is essential for generation of specific cytotoxic T cell responses in RNA-pulsed dendritic cell immunotherapySurgery2003134230030512947333
- KatoKTakaueYWakasugiHT-cell-conditioned medium efficiently induces the maturation and function of human dendritic cellsJ Leukoc Biol200170694194911739557
- Mielczarek-PalaczASikoraJKondera-AnaszZHauzaGImbalance in serum soluble CD30/CD30 L and CD40/CD40L systems are associated with ovarian tumorsHum Immunol2013741707423073297
- AhmadzadehMRosenbergSATGF-beta 1 attenuates the acquisition and expression of effector function by tumor antigen-specific human memory CD8 T cellsJ Immunol200517495215522315843517
- YigitRFigdorCGZusterzeelPLPotsJMTorensmaRMassugerLFCytokine analysis as a tool to understand tumour-host interaction in ovarian cancerEur J Cancer201147121883188921514148
- HernandezMGShenLRockKLCD40-CD40 ligand interaction between dendritic cells and CD8+ T cells is needed to stimulate maximal T cell responses in the absence of CD4+ T cell helpJ Immunol200717852844285217312128
- KaladyMFOnaitisMWEmaniSAbdel-WahabZTylerDSPruittSKSequential delivery of maturation stimuli increases human dendritic cell IL-12 production and enhances tumor antigen-specific immunogenicityJ Sur Res200411612431
- BelladonnaMLRenauldJCBianchiRIL-23 and IL-12 have overlapping, but distinct, effects on murine dendritic cellsJ Immunol2002168115448545412023338
- MorishimaNOwakiTAsakawaMKamiyaSMizuguchiJYoshimotoTAugmentation of effector CD8+ T cell generation with enhanced granzyme B expression by IL-27J Immunol200517531686169316034109
- WatfordWTHissongBDBreamJHKannoYMuulLO’SheaJJSignaling by IL-12 and IL-23 and the immunoregulatory roles of STAT4Immunol Rev200420213915615546391
- SchulzEGMarianiLRadbruchAHöferTSequential polarization and imprinting of type 1 T helper lymphocytes by interferon-gamma and interleukin-12Immunity200930567368319409816
- KimHJKimHOLeeKBaekEJKimHSTwo-step maturation of immature DCs with proinflammatory cytokine cocktail and poly(I:C) enhances migratory and T cell stimulatory capacityVaccine201028162877288620156531
- WanYYFlavellRARegulatory T cells, transforming growth factor-beta, and immune suppressionProc Am Thorac Soc20074327127617607012
- FengYHuaizengCXingXIn vitro anti-tumor effect of cytotoxicity T lymphocytes activated by dendritic cells loaded with freeze-thaw ovarian carcinoma antigenChin J Microbiol Immunol200424964967 Chinese