 ?Mathematical formulae have been encoded as MathML and are displayed in this HTML version using MathJax in order to improve their display. Uncheck the box to turn MathJax off. This feature requires Javascript. Click on a formula to zoom.
Abstract
Dichloroacetate (DCA), a small molecule mitochondria-targeting agent, can penetrate the blood–brain barrier, showing potential therapeutic effects on brain tumors. Considering the effects of DCA on tumor cellular metabolism, penetrating across the blood–brain barrier, as well as having potential antitumor activity on brain tumors, the purpose of this study is to investigate the antitumor activity of DCA on C6 glioma cells in vitro and in vivo. DCA inhibited C6 glioma cell proliferation, induced C6 cell apoptosis, and arrested C6 cells in S phase. DCA can inhibit the expression of heat shock proteins 70 (Hsp70) in a dose-dependent and time-dependent manner (P < 0.01). Our in vivo antitumor effect results indicated that DCA markedly inhibited the growth of C6 glioma tumors in both C6 brain tumor-bearing rats and C6 tumor-bearing nude mice (P < 0.01). DCA significantly induced the ROS production and decreased the mitochondrial membrane potential in tumor tissues. Our in vivo antitumor effect results also indicated that DCA has potential antiangiogenic effects. In conclusion, DCA may be a viable therapeutic agent in the treatment of gliomas.
Introduction
Malignant gliomas are the most common and deadly brain tumors.Citation1 Approximately 20,000 patients are diagnosed with gliomas each year in the United States.Citation2 It was reported that the median survival time of patients with malignant gliomas ranges from 14 to 40–0 weeks despite aggressive multimodality management with surgery, radiation, and chemotherapy.Citation3 Radiotherapy has been of key importance to the treatment of these tumors for decades.Citation4 Newer surgical techniques have become important in the management of malignant gliomas.Citation5,Citation6 Because of the angiogenesis in malignant gliomas,Citation7 the antivascular endothelial growth factor therapy has had significant efficacy in gliomas.Citation8 In addition, it was reported that heat shock protein 70 (Hsp70) is overexpressed in glioma cells.Citation9,Citation10 Overexpressed Hsp70 could decrease the release of cytochrome c and apoptosis inducing factor (AIF), which can then serve an antiapoptotic function.Citation11 Therefore, down-regulating Hsp70 expression would enhance the release of cytochrome c and AIF, leading to tumor cell apoptosis. It is well known that many chemotherapeutic agents have a low therapeutic index in brain tumors.Citation12 The failure of chemotherapy is due to the inability of intravenously administered anticancer agents to reach the brain tissue. The blood–brain barrier (BBB) is one of the most important obstacles for preventing the penetration of drugs into the central nervous system.Citation13 Therefore, great efforts have been made to develop various strategies for improving the penetration of drugs across the BBB, as well as for improving the targeting effect to the brain tumors, including targeting drug delivery systems or conjugates.Citation14–Citation16
Compared to the therapy of using chemotherapeutic agents or molecular-targeting therapeutic agents, an alternative antitumor approach may be to consider tumor metabolism.Citation17 Now, mitochondria are increasingly recognized as important targets in tumors because of their central roles in apoptotic pathways and in cellular metabolism.Citation18 The most common metabolic hallmark of cancer cells is their propensity to metabolize glucose to lactic acid at a high rate even in the presence of oxygen.Citation19 Tumor cells produce a clearly increased amount of their energy through glycolysis under aerobic conditions.Citation20 This metabolic switch away from mitochondrial respiration towards aerobic glycolysis in tumors could cause tumor cell transformation and suppress apoptosis.Citation21 Progress in molecular biology has revealed that energy metabolism is strictly regulated by several protein kinases. Pyruvate dehydrogenase kinase (PDK) is a gate-keeping enzyme that regulates the flux of carbohydrates (pyruvate) into the mitochondria. In the presence of activated PDK, pyruvate dehydrogenase (PDH), a critical enzyme that converts pyruvate to acetyl-CoA instead of lactate in glycolysis, is inhibited, limiting the entry of pyruvate into the mitochondria. Notably, a recent report showed that the entry of pyruvate into the Krebs cycle is inhibited in cancer cells, and aerobic glycolysis is highly increased in cancer cells.Citation22 This bioenergetic difference between cancer and normal cells would offer a very selective therapeutic target.Citation21
As many molecules with mitochondrial activity were discovered more than a decade ago, newer targeted screening strategies may uncover many additional compounds with desirable anticancer activities.Citation23 Dichloroacetate (DCA) is considered as a small molecule mitochondria-targeting agent.Citation21 Clinical studies of DCA have shown reduced lactate levels in patients with congenital lactic acidosis and sepsis.Citation24,Citation25 It has been reported that DCA activates the PDH by inhibition of PDK in a dose-dependent manner, and results in increased delivery of pyruvate into the mitochondria.Citation26 The antitumor activity of DCA on nonsmall cell lung cancer, breast cancer, glioblastomas, and endometrial and prostate cancer cells has been demonstrated.Citation26–Citation29 In addition, the oral bioavailability of DCA is almost 100%.Citation21 DCA can penetrate into the traditional chemotherapy sanctuary sites. Interestingly, it was reported that DCA could penetrate across the BBB,Citation30 exhibiting the potential activity for brain therapy.
Considering the effects of DCA on tumor cell metabolism, penetrating across the BBB, as well as potential antitumor activity on brain tumors, in this study, we investigated the antitumor activity of DCA on C6 gliomas in vitro and in vivo. The murine C6 glioma cells were selected as the cell model. The cell proliferation, cell cycle, apoptosis, and in vitro cytotoxicity of the DCA were also investigated. The effect of DCA on Hsp70 expression was analyzed in C6 cells in vitro. The antitumor activity of DCA was evaluated in C6 brain tumor-bearing rats and C6 tumor-bearing nude mice in vivo. Furthermore, the reactive oxygen species (ROS) production and mitochondrial membrane potential in tumor tissues were also investigated. In addition, the antiangiogenic activity of DCA was evaluated in C6 brain tumor-bearing rats in vivo.
Materials and methods
Materials
The DCA was obtained from Sinopharm Chemical Reagent Beijing Co, Ltd (Beijing, People’s Republic of China) and the solution was adjusted to a pH of 6.8–7.2 by 1 M NaOH solution. Sulforhodamine B (SRB) and Tris-base were purchased from Sigma-Aldrich (St Louis, MO, USA). Cell culture medium, penicillin-streptomycin, fetal bovine serum, horse serum, and L-glutamine were from Gibco®, Life Technologies (Carlsbad CA, USA). All other chemicals were of analytical grade.
Cell culture
Murine C6 glioma cells were purchased from the Institute of Material Medical, Chinese Academy of Medical Sciences and Peking Union Medical College (Beijing, People’s Republic of China). The C6 cells were routinely grown in Ham’s F-10 medium supplemented by 2.5% heat-inactivated fetal bovine serum, 15% horse serum, penicillin (100 U/mL), and streptomycin (100 μg/mL). All cells were maintained at 37°C in humidified environment with 5% CO2.
Animals
Male Sprague Dawley rats (200 ± 20 g) and male BALB/c nude mice (18–20 g) were obtained from the Experimental Animal Center of Peking University (Beijing, People’s Republic of China), and maintained under natural light/dark conditions. Animals were acclimatized for 7 days prior to the experiment and were allowed free access to a standard diet and water. The temperature and relative humidity were maintained at 25°C and 50%, respectively. All care and handling of animals were performed with the approval of the Institutional Authority for Laboratory Animal Care of Peking University.
Cell proliferation assay
The effect of DCA on C6 cell proliferation was analyzed with the SRB assay.Citation31,Citation32 Briefly, C6 cells were plated in 96-well culture plates (1 × 10⁴ cells/well). After 24 hours of incubation, the cells were treated with DCA (0 mM, 5 mM, 10 mM, 25 mM) for 48 hours. After that, cells were fixed with trichloroacetic acid, then washed and stained with SRB. Absorbance was measured at 540 nm using a 96-well plate reader (680; Bio-Rad Laboratories, Hercules, CA, USA). The percentage of surviving cells was calculated using the following formula:
(1) where A540nm is the absorbance value. Each assay was repeated a minimum of three times, with quadruplicate determinations for each dose level.
In vitro cytotoxicity
In vitro cytotoxicity was measured through the SRB method. Briefly, C6 glioma cells were seeded at a density of 5 × 10³ cells/well in 96-well transparent plates and incubated for 24 hours. The medium was then changed, and various concentrations of the DCA (0 mM, 1 mM, 2 mM, 4 mM, 8 mM, 16 mM, 32 mM, 64 mM, and 128 mM) were used. At 24 hours, the medium was removed, and then cells were fixed with trichloroacetic acid, and washed and stained with SRB. The absorbance was measured at 540 nm using a 96-well plate reader (680; Bio-Rad Laboratories). The survival percentages were calculated using the following formula:
(2) where A540n is the absorbance value. Each assay was carried out in triplicate. Finally, the drug concentration which inhibited the cell growth by 50% (IC50) was determined from semilogarithmic dose-response plots.
Cell cycle analysis
Cell cycle perturbations were analyzed by propidium iodide (PI) DNA staining. Briefly, exponentially growing C6 cells (5 × 10⁵) were treated with DCA (0 mM, 5 mM, 20 mM, 40 mM) for 24 hours. At the end of each treatment, cells were collected after a gentle centrifugation at 1000 rpm for 5 minutes and then fixed in 70% ethanol for at least 12 hours at 4°C. Ethanol-suspended cells were diluted with phosphate buffered saline (PBS) and then centrifuged at 1000 rpm for 5 minutes to remove residual ethanol. For cell cycle analysis, the pellets were suspended in 0.4 mL of PBS containing 0.02 mg/mL of PI, 1 mg/mL of DNase-free RNase A and 0.1% of Triton X-100 and incubated at 37°C for 30 minutes. The number of cells used for cell cycle flow cytometry was 10,000. Cell cycle profiles were studied using a flow cytometer (FACSCalibur; Becton Dickinson, Mountain View, CA, USA). The data were analyzed through FCS Express V3 software (De Novo Software, Los Angeles, CA, USA).
Apoptosis assay
The apoptosis was measured through the Annexin V-fluorescein isothiocyanate (FITC) Apoptosis Detection Kit (Biosea Biotechnology Co, Ltd, Beijing, People’s Republic of China) as described by the manufacturer’s instruction. After exposure to DCA (0 mM, 5 mM, 20 mM, 40 mM) for 24 hours, C6 cells were collected, washed twice with PBS, gently resuspended in Annexin V binding buffer, and incubated with Annexin V-FITC/PI in the dark for 30 minutes and analyzed by flow cytometry. In each sample, 10,000 cells were used for analysis.
Hsp70 measurement
Hsp70 were quantified using a commercial Hsp70 enzyme linked immunosorbent assay (ELISA) kit (Hyperheal Biotech Co, Ltd, Shanghai, People’s Republic of China). Briefly, C6 glioma cells were seeded at a density of 3 × 10⁶ cells/well in 175 cm2 fat-bottom static culture flasks and incubated for 24 hours. The medium was then changed and various concentrations of the DCA (0 mM, 0.05 mM, 0.5 mM, and 5 mM) were used. At 5 hours, 12 hours, or 24 hours, the medium was removed, and then cells were collected. Hsp70 were quantified using commercial Hsp70 ELISA kit as described by the manufacturer’s instruction. The detection limit of these kits for Hsp70 was 0.05 ng/mL. The control group was performed on C6 cells with absent DCA (0 mM DCA). Each sample was run in duplicate and compared with a standard curve. Each assay was carried out in triplicate.
In vivo anti-tumor effect
C6 brain tumor-bearing rats, established according to our previous research,Citation16 were randomly divided into four groups (each group contained ten animals, n = 10). Animals in group 1 were used as a control group and given distilled water. Animals in groups 2–4 were treated with DCA at the dose of 25 mg/kg, 75 mg/kg, or 125 mg/kg, respectively. DCA was administrated by oral gavage every day from day 7 after tumor inoculation, and this lasted for 17 consecutive days. On day 23 after tumor inoculation, all rats for each group were sacrificed. The tumors were harvested from the normal brain tissue and weighed. Tumor weight inhibition (TWI) was calculated by the formula:
(3) where WC and WD stand for the tumor weight of animals from the control and treatment groups, respectively.Citation33
In another separate study, the male BALB/c nude mice were inoculated subcutaneously in the right flank with 0.1 mL of serum-free Ham’s F-10 medium C6 cell suspension (4 × 10Citation6). After inoculating the C6 cells into the animals, the glioma was developed. Administration began at day 6 after inoculation, when the tumor size reached approximately 100-150 mmCitation3. On day 6 after tumor inoculation, mice were randomly divided into a control group and three DCA treatment groups. Each group was treated with sterilized water or DCA (25 kg/mg, 75 mg/kg, or 125 mg/kg for 16 consecutive days from day 6 to day 21 after inoculation), respectively. DCA was given by oral gavage. Each group consisted of seven tumor-bearing mice. Throughout the study, mice were weighed and tumors were measured with calipers every two days. Tumor volumes were calculated from the formula:
(4)
Animals were sacrificed on day 21 after tumor inoculation. The tumors were harvested and weighed. TWI was calculated using the formula:
(5) where WC and WD represent the tumor weight of animals from control and treatment groups, respectively.
ROS in tumor tissues
The ROS production in tumor tissues was assayed using the biopsy ROS kit (Genmed Scientifics, Inc, Wilmington, DE, USA). The tumor tissues of nude mice obtained from the in vivo antitumor activity experiment were cleaned to remove the residual blood and were then cut up and homogenized with a glass homogenizer. The tissue homogenate was incubated with 2′,7′-dichlorfluorescein-diacetate for 20 minutes at 37°C. Then, the fluorescence was monitored by a fluorospectrophotometer. The excitation wavelength was set at 490 nm, while the emission wavelength was 520 nm. The tumor tissue protein content was quantified by the Bradford method using bovine serum albumin as standard. The amount of ROS was expressed in μmol/mg mitochondrial protein.
MMP in tumor tissues
The determination of mitochondrial membrane potential (MMP) in tumor tissues was assayed using a biopsy MMP kit (Genmed Scientifics, Inc). The tumor tissue slices of nude mice obtained from in vivo antitumor activity experiments were immediately incubated with JC-1 at 37°C for 20 minutes. Then, these tissues were homogenized with a glass homogenizer, and the homogenate was centrifuged at 1500 g for 10 minutes to attain the supernatant. The fluorescence was monitored by a fluorospectrophotometer. The excitation wavelength was set at 490 nm, while the emission wavelength was set at 590 nm and 530 nm for red and green fluorescence, respectively. The MMP was represented by the ratio of red and green fluorescence intensity.
Assay of angiogenesis
CD31 staining was used to identify the microvessel vessel density in the tumor tissues by immunohistochemical method as per our previous research.Citation34 Briefly, after paraffin-embedded tumor tissue sections of rats obtained from in vivo antitumor activity experiments were deparaffinized in xylene and rehydrated in alcohol, sections were incubated in 0.3% H2O2 to block endogenous peroxidase activity. Each slide was incubated with normal goat serum (Santa Cruz Biotechnology, Inc, Santa Cruz, CA, USA) for 20 minutes at room temperature, and then incubated in the primary antibody at 4°C overnight. After incubation with the secondary antibody (ZSGB-BIO, Beijing, People’s Republic of China), biotinylated for 30 minutes at 37°C, each slide was rinsed in PBS and was incubated in the avidin-biotin peroxidase complex for 30 minutes at 37°C. The peroxidase was visualized with 3–3′-diamino-benzidinetetrahydrochloride solution and then counterstained with hematoxylin. Microvessel vessel density was assessed according to the international consensus report. Immunostained slides were scanned at × 100 magnification to identify the areas with the highest number of vessels (the so-called “hot spot”). Counts were performed on ten fields in the hot spot by two independent pathologists at x200 magnification.
Statistical analysis
Data are presented as the mean ± standard deviation. One-way analysis of variance was used to determine significance among groups, after which post-hoc tests with the Bonferroni correction were used for comparisons between individual groups. Statistical significance was established at P < 0.05.
Results
DCA induces cell cycle arrest and apoptosis in C6 glioma cell lines
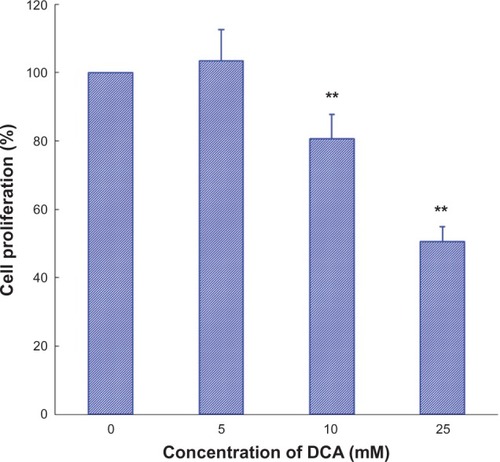
The inhibitory effect of DCA on C6 cell growth was determined by SRB assay. As shown in , DCA inhibited cell growth in the C6 cell line in a concentration-dependent manner. The value of the antiproliferative ratio (100% – variability) at 10 mM and 25 mM was 80.6% and 50.5%, respectively. According to the results of in vitro cytotoxicity, the calculated IC50 values of DCA for C6 cells were 27.0 ± 3.0 mM.
Figure 1 Effect of DCA on cell growth in C6 cells.
Abbreviations: DCA, dichloroacetate; SRB, sulforhodamine B; SD, standard deviation.
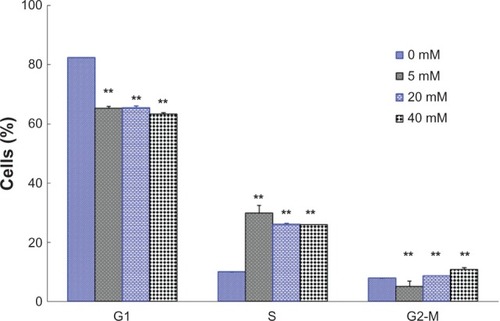
The C6 cells were incubated with DCA for 24 hours. The cells were fixed, stained with PI, and then analyzed by flow cytometry. showed the effect of DCA on the C6 cell cycle progression. It can be seen that treatment of C6 cells with DCA resulted in an enhancement of the S-G2/M cell cycle arrest. The amount of cells in the S-G2/M phase increased from ~17.7% (control cells, 0 mM DCA) to ~34.8%, 34.6%, and 36.7% for C6 cells treated with 5 mM, 20 mM, and 40 mM DCA, respectively.
Figure 2 Effects of DCA on the cell cycle of C6 cells. The percentage of cells in G1 phase, S phase, and g2-M phase were measured.
Abbreviations: DCA, dichloroacetate; SD, standard deviation.
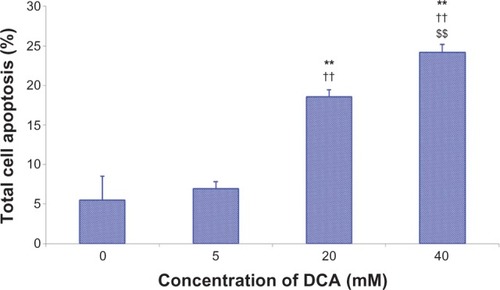
Apoptosis of C6 cells were analyzed by flow cytometry using Annexin V-FITC/PI. The data indicate that DCA increased the percentage of total apoptotic cells in a dose-dependent manner after treatment with DCA (P < 0.01), as shown in . The percentage of total apoptotic cells increased from ~5.5% (control cells, 0 mM DCA) to ~7.0%, 18.6%, and 24.2% for C6 cells treated with 5 mM, 20 mM. and 40 mM DCA, respectively.
Figure 3 DCA-induced apoptosis in C6 cells using Annexin V-FITC/PI.
Abbreviations: DCA, dichloroacetate; FITC, fluorescein isothiocyanate; Pi, propidium iodide; SD, standard deviation.
DCA inhibits Hsp70 expression in C6 cell line
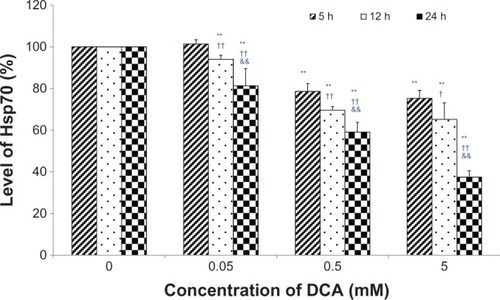
Hsp70 were quantified using a commercial Hsp70 ELISA kit. As shown in , a dose-dependent and time-dependent inhibition of DCA on the level of Hsp70 has been found. Compared with the control group (0 mM DCA), the level of Hsp70 was significantly decreased, except for 0.05 mM at the 5-hour incubation time point (P < 0.01). The level of Hsp70 after 24 hours of incubation was also significantly decreased compared with that after 5 hours or 12 hours of incubation (P < 0.01).
Figure 4 Effects of DCA on the level of hsp70 in C6 cells.
Abbreviations: DCA, dichloroacetate; ELISA, enzyme linked immunosorbent assay.
DCA inhibits C6 glioma tumor growth in vivo
In the in vivo antitumor activity experiments, the antitumor activity of DCA was evaluated by measuring the tumor weight in C6 glioma tumor-bearing rats after C6 cell implantation. In the present study, at days 19 and 21 posttumor inoculation, two tumor-bearing rats in the control group died with a tumor weight of 680 mg and 446 mg, respectively.
As shown in , DCA markedly inhibited the growth of C6 glioma tumors at doses of 25 mg/kg, 75 mg/kg, and 125 mg/kg (P < 0.01). There were no significant differences among the DCA treatment groups (25 mg/kg, 75 mg/kg, and 125 mg/kg). The average tumor weight in the distilled water, 25 mg/kg, 75 mg/kg, and 125 mg/kg DCA treatment groups at day 23 after C6 glioma cell implantation was 436 mg, 124 mg, 129 mg, and 125 mg, respectively. The values of TWI (%) in the 25 mg/kg, 75 mg/kg, and 125 mg/kg DCA treatment groups compared with that in the control group were ~71.5%, ~70.4%, and ~71.3%, respectively.
Figure 5 In vivo antitumor activity of DCA on C6 brain tumor-bearing rats and C6 tumor-bearing BALB/c nude mice. In vivo antitumor activity of DCA on (A) C6 brain tumor-bearing rats and (B and C) C6 tumor-bearing BALB/c nude mice. (A) Tumor weight at the time of sacrifice, 23 days postinoculation. DCA was administrated by oral gavage every day from day 7 after tumor inoculation, and it lasted for 17 consecutive days. Animals were sacrificed on day 23 after tumor inoculation. Control group, distilled water (n = 8); DCA treatment groups, at doses of 25 mg/kg, 75 mg/kg, or 125 mg/kg, respectively (n = 10). (B) Tumor growth inhibition with DCA; (C) tumor weight at the time of sacrifice, 21 days postinoculation. DCA was administrated by oral gavage every day from day 6 after tumor inoculation and lasted for 16 consecutive days. Throughout the study, mice were weighed and tumors were measured with calipers every 2 days. Tumor volumes were calculated from the formula:
(1)
Animals were sacrificed on day 21 posttumor inoculation. The tumors were harvested and weighed. Control group, sterilized water (n = 7); DCA treatment groups, at doses of 25 mg/kg, 75 mg/kg, or 125 mg/kg, respectively (n = 7). Columns or point, mean; bars, SD. **P < 0.01, versus control group.
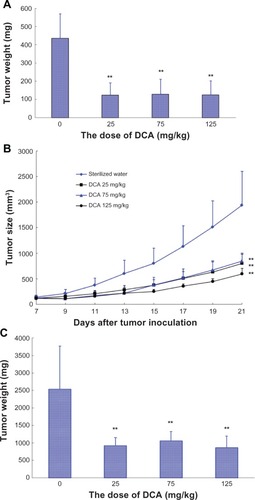
In another separate study, the male BALB/c nude mice were inoculated subcutaneously with C6 glioma cell suspension. Mice were randomly divided into a sterilized water group and three DCA treatment groups (25 mg/kg, 75 mg/kg, and 125 mg/kg). Each group consisted of seven tumor-bearing mice. As shown in , DCA markedly inhibited the growth of C6 glioma tumors at doses of 25 mg/kg, 75 mg/kg, and 125 mg/kg compared with that in sterilized water group (P < 0.01). There were also no significant differences among the DCA treatment groups (25 mg/kg, 75 mg/kg, and 125 mg/kg). At day 21 after C6 glioma cell implantation, the average tumor volume in sterilized water and DCA treatment groups (25 mg/kg, 75 mg/kg, and 125 mg/kg) was 1940 ± 441 mmCitation3, 801 ± 182 mmCitation3, 845 ± 156 mmCitation3, and 596 ± 107 mmCitation3, respectively. The average tumor weight in the sterilized water, 25 mg/kg, 75 mg/kg, and 125 mg/kg DCA treatment groups at day 21 after C6 glioma cell implantation was 2539 mg, 924 mg, 1059 mg, and 864 mg, respectively (). The values of TWI (%) in the 25 mg/kg, 75 mg/kg, and 125 mg/kg DCA treatment groups compared with that in sterilized water group were ~60.2%, ~54.5%, and ~62.9%, respectively.
DCA increases ROS production, decreases MMP, and inhibits angiogenesis in tumor tissues in vivo
The ROS production in tumor tissues after DCA administration to C6 tumor-bearing nude mice was evaluated. When C6 tumor-bearing nude mice were treated with DCA for 16 consecutive days (from day 6 to day 21), on day 21 after tumor inoculation, the ROS production in the tumor tissues was significantly increased compared with that in untreated animals (P < 0.01), as shown in . The ROS production in 25 mg/kg, 75 mg/kg, or 125 mg/kg DCA treatment groups was 2.5-, 3.1-, and 2.4-fold higher than that in the untreated group, respectively.
Figure 6 The ROS production and the MMP in nude mice tumor tissues. (A) The ROS production and (B) the MMP in nude mice tumor tissues.
Abbreviations: ROS, reactive oxygen species; MMP, mitochondrial membrane potential; RFU, relative fluorescent units; SD, standard deviation.
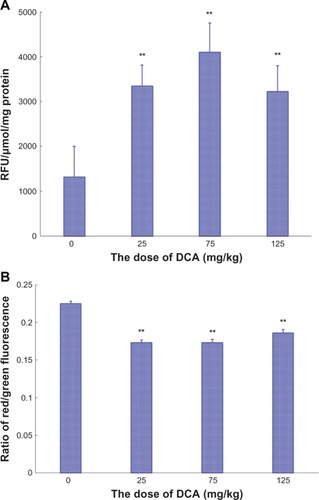
The MMP in tumor tissues after DCA administration to C6 tumor-bearing nude mice was also investigated. When tumor-bearing nude mice were treated with DCA for 16 consecutive days (from day 6 to day 21), on day 21 after tumor inoculation, the MMP in the tumor tissues was significantly decreased compared with that in untreated animals (P < 0.01), as shown in . The red/green fluorescence ratio in 25 mg/kg, 75 mg/kg, or 125 mg/kg DCA treatment groups was 77%, 77%, and 83% lower than that in the untreated group, respectively.
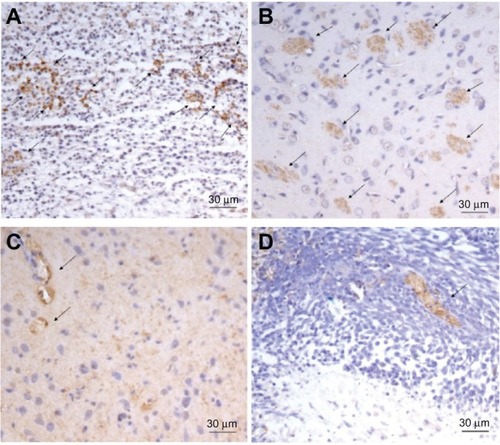
To evaluate the antiangiogenic activity of DCA in vivo, microvessel vessel density in tumor tissues after DCA administration to tumor-bearing rats was assessed by immunohistochemistry. As shown in , microvessels were easily observed by CD31 staining. The numbers of the microvessels in the DCA treatment groups (25 mg/kg, 75 mg/kg, and 125 mg/kg) were 11 ± 1.4, 2.3 ± 0.6 and 1.3 ± 0.6 respectively, which were significantly lower than the number in the untreated group (14 ± 2.8).
Figure 7 The representative micrographs of the immunohistochemical detection of CD31+ microvessels. The representative micrographs of the immunohistochemical detection of CD31+ microvessels in C6 brain tumor-bearing rats in (A) the control group, (B) the DCA treatment group at 25 mg/kg, (C) the DCA treatment group at 75 mg/kg, and (D) the DCA treatment group at 125 mg/kg.
Abbreviation: DCA, dichloroacetate.
Discussion
As a small molecule mitochondria-targeting agent, DCA can penetrate the BBB, showing potential therapeutic effects on brain tumors. In addition, the oral bioavailability of DCA is nearly 100%; therefore, the objective of the present study was to investigate the potential antitumor activity of DCA on brain tumors in vitro and in vivo.
The unique metabolism of most solid tumors integrates many proximal pathways and results in a consideration of mitochondria. The characteristic of tumor metabolism indicated that tumor cells rapidly use glucose and convert the majority of it to lactate, even in the presence of oxygen, which is the so-called aerobic glycolysis or Warburg effect. PDH is a metabolic switch that determines whether or not mitochondrial respiration or aerobic glycolysis should occur.Citation35 It converts pyruvate to acetyl-CoA.Citation36 Acetyl-CoA is fed to the Krebs cycle, producing the electron donors nicotinamide adenine dinucleotide (NADH) and flavin adenine dinucleotide (FADH2). NADH donates electrons to complex 1 of the electron transport chain. The flux of electrons down the electron transport chain is associated with the elevated production of ROS, which could depolarize MMP. Mitochondrial depolarization and increased ROS are associated with opening of the mitochondrial transition pore. Opening of the MMP-sensitive mitochondrial transition pore allows for the efflux of cytochrome c and AIF from the mitochondria into the cytoplasm and induces apoptosis.Citation26 Our previous in vitro results indicated that DCA can increase the activity of PDH, induce ROS production, and decrease MMP in C6 cells,Citation37 showing that DCA can induces the apoptosis of C6 cells through the activation of the mitochondrial pathway.
Cell cycle control represents a major regulatory mechanism of cell growth.Citation38 Blockade of the cell cycle is regarded as an effective strategy for the development of novel cancer therapies.Citation39,Citation40 It has been reported that DCA treatment resulted in an increase in the proportion of tumor cells in the S phase, showing a decrease in proliferation as well as the induction of apoptosis.Citation27,Citation41 Our cell cycle analysis results revealed that DCA-induced C6 cells in the S phase cell cycle arrest with an accompanying decrease in the G1 phase. We suggested that the results of this cell cycle arrest may partly explain DCA-inducing apoptosis and antiproliferation in C6 cells.
Heat shock proteins (HSPs) are involved in protein folding, aggregation, transport, and/or stabilization by acting as a molecular chaperone, leading to the inhibition of apoptosis by both caspase-dependent and/or independent pathways.Citation42 HSPs are overexpressed in a wide range of human cancers and are implicated in tumor cell proliferation, differentiation, invasion, and metastasis. It has been reported that Hsp70 expression was much more abundant in glioma tumor cells, such as C6 cells, than in normal brain tissues. Considering the fact that high expression of HSPs is essential for cancer survival, the inhibition of HSPs is an important strategy of anticancer therapy. Our current results indicated that DCA could down-regulate Hsp70 expression in C6 cells in a dose-dependent and time-dependent manner, showing a new pathway of DCA-induced C6 cell apoptosis.
Unlike cytotoxic chemotherapeutic agents, the half maximal inhibitory concentration (IC50) values of DCA were about 27 mM for C6 cells. Similar IC50 values of DCA (15–30 mM) for U251, SKOV-3, A549, and MDA-MB-231 cell lines were also observed (data not shown). These results indicated that DCA has unique antitumor mechanisms on tumor cell lines.
In the present research, the antitumor activity of DCA after oral administration was investigated in C6 brain tumor-bearing rats and C6 tumor-bearing nude mice in vivo. Our in vivo antitumor activity results indicated that DCA markedly inhibited the growth of C6 glioma tumor in both C6 brain tumor-bearing rats and C6 tumor-bearing nude mice (P < 0.01). We also found no significant difference in the antitumor activity among the DCA treatment groups (25, 75 and 125 mg/kg). It was reported that DCA administered at 35–50 mg/kg decreases lactate levels by more than 60% and directly activates PDH by threefold to sixfold.Citation43,Citation44 Our in vivo antitumor activity results suggested that DCA might possibly produce the antitumor activity at a dose lower than 25 mg/kg. In a clinical experiment, each of five glioblastoma patients was treated with oral DCA for up to 15 months. The starting oral dose of DCA was 12.5 mg/kg twice a day for 1 month, at which point the dose was increased to 25 mg/kg orally twice a day, if dose-limiting toxicity occurred, decreasing the dose by 50%.Citation45 The efficacy and safety of DCA on the treatment of glioblastoma was confirmed, even at a dose of 6.25 mg/kg orally twice a day.Citation45 In addition, after 5 years of continued treatment with oral DCA at a dose of 25 mg/kg, the serum DCA levels are only slightly increased compared with the levels after the first several doses, also showing its safety for oral administration at this dose.Citation46
DCA can enter the circulation rapidly after oral administration and then generate the stimulation of PDH activity generally within minutes. Our in vivo results in tumor tissues indicated that DCA significantly induced ROS production and decreased MMP in tumor tissues, showing similar mechanisms with those observed in vitro.
Histologically, glioblastomas are highly angiogenic and characterized by microvascular proliferations.Citation47 In the present research, the antiangiogenic activity of DCA was investigated in vivo by immunohistochemistry. The numbers of microvessels in the DCA treatment groups were significantly decreased, suggesting the potential antiangiogenic effect of DCA. It has been reported that early carcinogenesis often occurs in a hypoxic microenvironment. Under hypoxic conditions, hypoxia-inducible factor (HIF-1α) is activated and induces angiogenesis. In addition, HIF-1α can also induce the expression of PDK,Citation48 which can inhibit the activity of PDH. The inhibition effect of DCA on HIF-1α would decrease vascular endothelial growth factor and inhibit angiogenesis.Citation45 In addition, because the cancer cells were “normalized” following the increase in mitochondrial respiration and mitochondrial depolarization,Citation21 we suggested that the hypoxic microenvironment in or around tumor tissue would be improved. We also found that, unlike the results obtained from in vivo antitumor experiments, the antiangiogenic effect in the 25 mg/kg treatment group was lower than that in 75 mg/kg or 125 mg/kg treatment groups. Therefore, we suggested that the inhibition of DCA on HIF-1α or vascular endothelial growth factor would be further investigated.
In conclusion, DCA induces the apoptosis of C6 cells through the activation of the mitochondrial pathway, arresting the cell cycle of C6 cells in S phase and down-regulating Hsp70 expression. Our in vivo antitumor experiment results indicated that DCA markedly inhibited the growth of C6 glioma tumors in both C6 brain tumor-bearing rats and C6 tumor-bearing nude mice (P < 0.01). DCA significantly induced the ROS production and decreased the MMP in tumor tissues. Our in vivo antitumor activity results also indicated that DCA has an antiangiogenic effect.
Acknowledgments
The authors gratefully acknowledge financial support from the National Natural Science Foundation of China (No 81172992) and the National Basic Research Program of China (973 Program 2009CB930300 and 2013CB932501) and Innovation Team of the Ministry of Education (No BMU20110263).
Disclosure
The authors report no conflicts of interest in this work.
References
- Van MeirEGHadjipanayisCGNordenADShuHKWenPYOlsonJJExciting new advances in neuro-oncology: the avenue to a cure for malignant gliomaCA Cancer J Clin201060316619320445000
- KhasrawMLassmanABAdvances in the treatment of malignant gliomasCurr Oncol Rep2010121263320425605
- AvgeropoulosNGBatchelorTTNew treatment strategies for malignant gliomasOncologist19994320922410394589
- Stieber V W, Mehta M P. Advances in radiation therapy for brain tumorsNeurol Clin200725410051033 ix17964024
- SouweidaneMMLutherNEndoscopic resection of solid intraventricular brain tumorsJ Neurosurg2006105227127817219833
- StummerWPichlmeierUMeinelTWiestlerODZanellaFReulenHJALA-Glioma Study GroupFluorescence-guided surgery with 5-aminolevulinic acid for resection of malignant glioma: a randomised controlled multicentre phase III trialLancet Oncol20067539240116648043
- El HallaniSBoisselierBPeglionFA new alternative mechanism in glioblastoma vascularization: tubular vasculogenic mimicryBrain2010133Pt 497398220375132
- BuieLWValgusJBevacizumab: a treatment option for recurrent glioblastoma multiformeAnn Pharmacother200842101486149018765835
- LiuYZhengTZhaoSInhibition of heat shock protein response enhances PS-341-mediated glioma cell deathAnn Surg Oncol201219Suppl 3S421S42921732139
- FedrigoCAGrivicichISchunemannD PRadioresistance of human glioma spheroids and expression of HSP70, p53 and EGFrRadiat Oncol2011615622077956
- GarridoCGurbuxaniSRavagnanLKroemerGHeat shock proteins: endogenous modulators of apoptotic cell deathBiochem Biophys Res Commun2001286343344211511077
- KooYEReddyGRBhojaniMBrain cancer diagnosis and therapy with nanoplatformsAdv Drug Deliv Rev200658141556157717107738
- PardridgeWMBBB-Genomics: creating new openings for brain-drug targetingDrug Discov Today20016838138311301273
- GanC WFengSSTransferrin-conjugated nanoparticles of poly(lactide)-D-alpha-tocopheryl polyethylene glycol succinate diblock copolymer for targeted drug delivery across the blood-brain barrierBiomaterials201031307748775720673685
- ChertokBDavidAEYangVCPolyethyleneimine-modified iron oxide nanoparticles for brain tumor drug delivery using magnetic targeting and intra-carotid administrationBiomaterials201031246317632420494439
- KeXYZhaoBJZhaoXThe therapeutic efficacy of conjugated linoleic acid – paclitaxel on glioma in the ratBiomaterials201031225855586420430438
- PanJGMakTWMetabolic targeting as an anticancer strategy: dawn of a new era?Sci STKE20072007381pe1417426345
- SamudioIFieglMAndreeffMMitochondrial uncoupling and the Warburg effect: molecular basis for the reprogramming of cancer cell metabolismCancer Res20096962163216619258498
- PathaniaDMillardMNeamatiNOpportunities in discovery and delivery of anticancer drugs targeting mitochondria and cancer cell metabolismAdv Drug Deliv Rev200961141250127519716393
- WarburgOOn the origin of cancer cellsScience2241956123319130931413298683
- MichelakisEDWebsterLMackeyJRDichloroacetate (DCA) as a potential metabolic-targeting therapy for cancerBr J Cancer200899798999418766181
- YeungSJPanJLeeMHRoles of p53, MYC and HIF-1 in regulating glycolysis – the seventh hallmark of cancerCell Mol Life Sci200865243981399918766298
- FuldaSGalluzziLKroemerGTargeting mitochondria for cancer therapyNat Rev Drug Discov20109644746420467424
- CoudeFXSaudubrayJMDeMaugreFMarsacCLerouxJ PCharpentierCDichloroacetate as treatment for congenital lactic acidosisN Engl J Med19782992413651366714110
- StacpooleP WWrightECBaumgartnerTGA controlled clinical trial of dichloroacetate for treatment of lactic acidosis in adults. The Dichloroacetate-Lactic Acidosis Study GroupN Engl J Med199232722156415691435883
- BonnetSArcherSLAllalunis-TurnerJA mitochondria-K+ channel axis is suppressed in cancer and its normalization promotes apoptosis and inhibits cancer growthCancer Cell2007111375117222789
- WongJYHugginsGSDebiddaMMunshiNCDe VivoIDichloroacetate induces apoptosis in endometrial cancer cellsGynecol Oncol2008109339440218423823
- CaoWYacoubSShiverickKTDichloroacetate (DCA) sensitizes both wild-type and over expressing Bcl-2 prostate cancer cells in vitro to radiationProstate200868111223123118465755
- KurodaYToshimaKWatanabeTEffects of dichloroacetate on pyruvate metabolism in rat brain in vivoPediatr Res198418109369386493852
- AbemayorEKovachichGBHaugaardNEffects of dichloroacetate on brain pyruvate dehydrogenaseJ Neurochem198442138426689696
- VichaiVKirtikaraKSulforhodamine B colorimetric assay for cytotoxicity screeningNat Protoc2006131112111617406391
- HuangYChenXMZhaoBXAntiangiogenic activity of sterically stabilized liposomes containing paclitaxel (SSL-PTX): in vitro and in vivoAAPS Pharm Sci Tech2010112752759
- PetrangoliniGSupinoRPratesiGEffect of a novel vacuolar-H+-ATPase inhibitor on cell and tumor response to camptothecinsJ Pharmacol Exp Ther2006318393994616714402
- ZhaoBJKeXYHuangYThe antiangiogenic efficacy of NGR-modified PEG-DSPE micelles containing paclitaxel (NGR-M-PTX) for the treatment of glioma in ratsJ Drug Target201119538239020677914
- ShanmugamMMcBrayerSKRosenSTTargeting the Warburg effect in hematological malignancies: from PET to therapyCurr Opin Oncol200921653153619587591
- StacpooleP WHendersonGNYanZJamesMOClinical pharmacology and toxicology of dichloroacetateEnviron Health Perspect1998106Suppl 49899949703483
- ZhaoXWangXYuK FEffects of dichloroacetate on the activation of the mitochondrial pathway in C6 cells in vitroJournal of Chinese Pharmaceutical Sciences2011205460465
- –JeongH WHanDCSonKHAntitumor effect of the cinnamaldehyde derivative CB403 through the arrest of cell cycle progression in the G2/M phaseBiochem Pharmacol20036581343135012694875
- BuolamwiniJKCell cycle molecular targets in novel anticancer drug discoveryCurr Pharm Des20006437939210788588
- McDonaldER3rdEl-DeiryWSCell cycle control as a basis for cancer drug development (Review)Int J Oncol200016587188610762622
- MadhokBMYeluriSPerrySLHughesTAJayneDGDichloroacetate induces apoptosis and cell-cycle arrest in colorectal cancer cellsBr J Cancer2010102121746175220485289
- SarkarRMukherjeeSBiswasJRoyMSulphoraphane, a naturally occurring isothiocyanate induces apoptosis in breast cancer cells by targeting heat shock proteinsBiochem Biophys Res Commun20124271808522975350
- HowlettRAHeigenhauserGJHultmanEHollidge-HorvatMGSprietLLEffects of dichloroacetate infusion on human skeletal muscle metabolism at the onset of exerciseAm J Physiol19992771 Pt 1E18E2510409123
- ParolinMLSprietLLHultmanEEffects of PDH activation by dichloroacetate in human skeletal muscle during exercise in hypoxiaAm J Physiol Endocrinol Metab20002794E752E76111001755
- MichelakisEDSutendraGDromparisPMetabolic modulation of glioblastoma with dichloroacetateSci Transl Med201023131ra34
- MoriMYamagataTGotoTSaitoSMomoiMYDichloroacetate treatment for mitochondrial cytopathy: long-term effects in MELASBrain Dev200426745345815351081
- LouisDNOhgakiHWiestlerODThe 2007 WHO classification of tumours of the central nervous systemActa Neuropathol200711429710917618441
- CairnsRAPapandreouISutphinPDDenkoNCMetabolic targeting of hypoxia and HIF1 in solid tumors can enhance cytotoxic chemotherapyProc Natl Acad Sci U S A2007104229445945017517659