Abstract
Background
This study used CT (computed tomography) and magnetic resonance imaging (MRI) to identify correlations between perfusion parameters for squamous cell lung carcinoma and tumor angiogenesis in a rabbit model of VX2 lung cancer.
Methods
VX2 tumors were implanted in the lungs of 35 New Zealand White rabbits. CT and MRI perfusion scanning were performed on days 14, 17, 21, 25, and 28 after tumor implantation. CT perfusion parameters were perfusion, peak enhanced increment, transit time peak, and blood volume, and MRI perfusion parameters were wash in rate, wash out rate, maximum enhancement rate, and transit time peak. CT and MRI perfusion parameters were obtained at the tumor rim, in the tumor tissue, and in the muscle tissue surrounding the tumor.
Results
On CT perfusion imaging, t values for perfusion, peak enhanced increment, and blood volume (tumor rim versus muscle) were 16.31, 11.79, and 5.21, respectively (P < 0.01); t values for perfusion, peak enhanced increment, and blood volume (tumor versus muscle) were 9.87, 4.09, and 5.35, respectively (P < 0.01); and t values for transit time peak were 1.52 (tumor rim versus muscle) and 1.29 (tumor versus muscle), respectively (P > 0.05). On MRI perfusion imaging, t values for wash in rate, wash out rate, and maximum enhancement rate (tumor rim versus muscle) were 18.14, 8.79, and 6.02, respectively (P < 0.01); t values for muscle wash in rate, wash out rate, and maximum enhancement rate (tumor versus muscle) were 9.45, 8.23, and 4.21, respectively (P < 0.01); and t values for transit time peak were 1.21 (tumor rim versus muscle) and 1.05 (tumor versus muscle), respectively (P > 0.05).
Conclusion
A combination of CT and MRI perfusion imaging demonstrated hemodynamic changes in a rabbit model of VX2 lung cancer, and provides a theoretical foundation for treatment of human squamous cell lung carcinoma.
Introduction
Lung cancer is the leading cause of cancer mortality worldwide. In 2012, lung cancer accounted for 26% of all cancer deaths in females and 29% of all cancer deaths in males in the US.Citation1 Even with excision, radiotherapy, chemotherapy, and gene therapy, the five-year survival rate is only 15% in the US.Citation2 Early detection and treatment of lung cancer is crucial in improving patient survival.Citation3
Imaging examinations, such as magnetic resonance imaging (MRI), computed tomography (CT), or both, are commonly used for the diagnosis of lung cancer and provide a noninvasive means of tumor visualization. Detection and localization of lung cancer at the carcinoma in situ or microinvasive stage affords a good prognosis for patients.
Angiogenesis has been shown to play an important role in tumor growth and development and is related to tumor invasion and metastasis. Tumor vessels not only provide the nutrition required for tumor growth and transport of metabolites but also enable spread of tumor cells.Citation4,Citation5 A large quantity of tumor blood vessels increases the opportunity for tumor cells to penetrate into the blood circulation. The basilar membrane of a new vessel is slit-shaped, and more mature blood vessels are easily penetrated by cancer cells that result in tumor metastasis because the vessels leak easily.Citation6,Citation7 With the rapid development of spiral CT and MRI technologies, early tumor detection by imaging and identification of changes in hemodynamics and local tissue function has become possible by measuring the perfusion of local tissue. Angiogenesis in tumors can be assessed by CT and MRI perfusion techniques because of the changes that occur in vascular perfusion, blood volume, and permeability.Citation8–Citation11
Rabbit tumor models are used widely because of their many advantages, including our extensive background in understanding their lung physiology, as well as these animals being easy to handle, readily available, and large enough to study lung mechanics, and the ability to use the animals as their own controls. In addition, their respiratory system is similar to that of humans. The usefulness of the rabbit as a species to study lung biology in order to understand human lung conditions has been highlighted.Citation12 In this study, we used CT and MRI perfusion parameters to identify hemodynamic changes during angiogenesis in a rabbit model of VX2 lung cancer. Our aim was to assess hemodynamic changes in rabbits with VX2 lung cancer using these functional imaging methods in combination.
Materials and methods
Animal model
Animal care and all experimental procedures were performed with the approval of the animal welfare council of Baotou Cancer Hospital, Inner Mongolia Autonomous Region, People’s Republic of China. Sixty New Zealand White rabbits (mean weight 2.7 ± 0.2 kg) were purchased from the Experimental Animal Center at Peking University, Beijing. Rabbits were maintained inhouse under normal conditions. VX2 squamous carcinoma cells were obtained from the Institute of Clinical Oncology at Peking University and cultured under the recommended conditions. The VX2 tumors were grown in the hind limb muscle of a rabbit. When the tumors reached a diameter of 2–3 cm, they were harvested and minced into pieces approximately 1 mm3 in size. The pieces were filtered through a metal mesh to obtain a suspension of single tumor cells. The cells were centrifuged at 1000 rpm for five minutes, and saline solution was added to make a suspension of approximately 2 × 10⁷ cells/mL. Under CT guidance, 59 rabbits were percutaneously injected with 0.5 mL of the VX2 cell suspension (2 × 10⁷ cells/mL) into the lungs. Seven days later, enhanced CT confirmed that tumor lesions 7–14 mm in diameter (mean 10.5 ± 2.2 mm) had developed in 35 (59%) of the rabbits, and were used for the following experiments.
CT and MRI perfusion imaging
Each rabbit was fasted for 12 hours before scanning and anesthetized with pentobarbital 30 mg/kg via an indwelling catheter in the auricular vein. CT and MRI perfusion scanning was performed on days 14, 17, 21, 25, and 28 after tumor implantation. A 16-slice spiral CT (Philips Brilliance, Eindhoven, The Netherlands) and an Intera 1.5 T Achieva Nova-Dual MRI device (Philips) were used for imaging. Iohexol (CT contrast agent) and Gd-DPTA (MRI contrast agent) were each injected at 0.4 mL per second via the marginal ear vein. The CT scanning parameters were: matrix 16 × 0.625 mm, slice thickness 3.0 mm, pitch 3.0 mm, 120 kV, 100 mAs, 360-degree rotation time 0.4 seconds, and scanning interval 6.5 seconds (default minimum). Diffusion-weighted imaging and apparent diffusion coefficient parameters were: FOV 150 mm, TR 2529, TED 55, T I180, NSA 16, and slice thickness 3 mm. MRI perfusion-weighted imaging parameters were: FOV 150 mm, TR 4.8, TE 2.4, Flip 10, NSA 1, and slice thickness 1 mm. All images were analyzed independently by two radiologists.
CT and MRI perfusion parameters
CT perfusion parameters were perfusion volume, peak enhanced increment, and transit time peak. MRI perfusion parameters were wash in rate, wash out rate, maximum enhancement rate, and transit time peak. Regions of interest were the tumor rim, central portion of the tumor, and the muscle surrounding the tumor. CT and MRI perfusion parameters were measured three times at each area (tumor rim, tumor, and muscle) and the mean value of these three measurements was used in the analysis.
Immunohistochemistry
Tumor rim and tumor tissues were fixed in 10% neutral buffered formalin and embedded routinely in paraffin for immunohistochemical study, with hematoxylin and eosin, vascular endothelial growth factor (VEGF), and CD34 staining. Using streptavidin peroxidase methods, VEGF expression was divided into four grades from (−) to (+++). The intensity of expression was evaluated as follows: the number of positive cells < 5% was considered as (−), 5%–25% as (+), 26%–50% as (++), and 51%–100% as (+++). Microvessel density was measured by anti-CD34 staining. All histological analyses were examined independently by two pathologists.
Statistical analysis
All data are expressed as the mean ± standard deviation. The statistical analysis was performed using Statistical Package for the Social Sciences version 13.0 software (SPSS Inc, Chicago, IL, USA), and paired t-tests were used to show differences in perfusion parameters (tumor rim versus muscle, tumor versus muscle). P < 0.05 was considered to be statistically significant.
Results
CT and MRI perfusion imaging
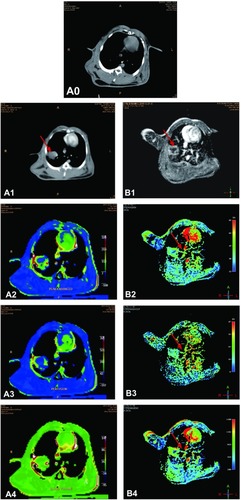
CT scanning showed normal lung tissue in the rabbits before inoculation with tumor cells, and CT and MRI enhancement scanning showed irregular soft tissue masses in the same rabbits’ lungs two weeks after inoculation. CT and MRI perfusion images showed there was an abundant supply of blood vessels in the tumor rim and that the central tumor portions were ischemic ().
Figure 1 All images are obtained from the same investigated rabbit. (A0) CT scanning image shows normal tissue in the lung before tumor inoculation. (A1) CT enhancement scanning image shows an irregular soft tissue mass in the lobe of the left lung two weeks after tumor inoculation (red arrow). CT perfusion scanning images show PEI (A2), PV (A3), and BV (A4). (B1) MRI enhanced scanning image shows an irregular soft tissue mass in the right lung two weeks after tumor inoculation (red arrow). MR perfusion scanning images show WIR (B2), WOR (B3), and MER (B4) in the tumor tissue (red arrows). There is an abundant supply of blood vessels in the tumor rim, while the central portions of the tumor are ischemic.
CT and MRI perfusion parameters
CT perfusion parameters of perfusion volume, peak enhanced increment, transit time peak, and blood volume data (tumor rim versus tumor) are shown in . MRI perfusion parameters, ie, wash in rate, wash out rate, maximum enhancement rate, and transit time peak data (tumor rim versus tumor) are shown in . The t values for perfusion volume, peak enhanced increment, and blood volume (tumor rim versus muscle) were 16.31, 11.79, and 5.21, respectively (P < 0.01). The t values for perfusion volume, peak enhanced increment, and blood volume (tumor versus muscle) were 9.87, 4.09, and 5.35, respectively (P < 0.01). The t values for transit time peak were 1.52 (tumor rim versus muscle) and 1.29 (tumor versus muscle), respectively (P > 0.05, ). The t values for wash in rate, wash out rate, and maximum enhancement rate (tumor rim versus muscle) were 18.14, 8.79, and 6.02, respectively (P < 0.01); the t values for wash in rate, wash out rate, and maximum enhancement rate (tumor versus muscle) were 9.45, 8.23, and 4.21, respectively (P < 0.01); the t values for transit time peak were 1.21 (tumor rim versus muscle) and 1.05 (tumor versus muscle), respectively (P > 0.05, ).
Figure 2 PV and BV increased when the tumor rim was in the range of 0.59–1.69 cm (0.35–2.85 cm2) in size; at 0.59–0.77 cm (0.35–0.6 cm2), PEI increased; at 1.69–1.79 cm (2.85–3.2 cm2), PV and BV decreased and PEI increased; at 1.79–2.10 cm (3.2–4.4 cm2), PV, BV, and PEI increased markedly; at 2.10–2.51 cm (4.4–6.3 cm2), PV and PEI decreased and BV stabilized (A–C). When the central portion of the tumor was in the range of 0.59–1.79 cm (0.3–3.2 cm2), PV, BV, and PEI increased significantly; at 1.79–2.19 cm (3.2–4.8 cm2), PV, BV, and PEI decreased significantly; at 2.19–2.51 cm (4.8–6.3 cm2), PV and BV increased slowly and PEI decreased slowly (D–F).
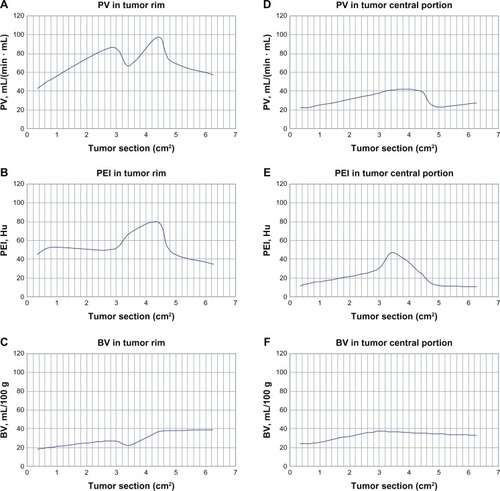
Figure 3 WIR, WOR, and MER increased significantly when the tumor rim was in the range of 0.59–0.77 cm (0.35–0.6 cm2); at 0.77–1.73 cm (0.6–3.0 cm2), WIR decreased slowly, WOR decreased markedly, and MER increased markedly; at 1.73–1.84 mm (3.0–3.4 cm2), WIR decreased, WOR decreased significantly, and MER stabilized; at 1.84–2.10 mm (3.4–4.4 cm2), WIR increased, WOR stabilized, and MER decreased markedly; at 2.10–2.19 cm (4.4–4.8 cm2), WIR decreased markedly, WOR stabilized, and WER decreased markedly; at 2.19–2.51 cm (4.8–6.3 cm2), WIR increased significantly, WOR decreased, and MER stabilized (A–C). When the central portion of the tumor was in the range of 0.59–0.77 cm (0.3–0.6 cm2), WIR, WOR, and MER increased significantly; at 0.77–1.73 cm (0.6–3.0 cm2), WIR decreased smoothly and WOR and MER increased significantly; at 1.73–1.85 cm (3.0–3.4 cm2), WIR increased smoothly, WOR decreased, and MER increased markedly; at 1.85–2.10 cm (3.4–4.4 cm2), WIR stabilized, WOR increased smoothly, and MER decreased markedly; at 2.10–2.19 cm (4.4–4.8 cm2), WIR, WOR decreased markedly, and MER increased significantly; at 2.19–2.51 cm (4.8–6.3 cm2), WIR increased significantly, WOR increased slowly, and MER stabilized (D–F).
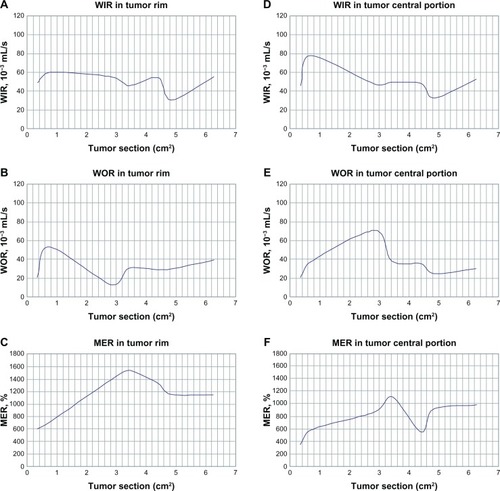
Table 1 Computed tomography perfusion parameters in a rabbit model of VX2 lung cancer
Table 2 Magnetic resonance perfusion parameters in a rabbit model of VX2 lung cancer
The following correlations were observed between tumor growth and perfusion parameters of blood flow. When tumor sizes were 0.59–0.77 cm (0.35–0.6 cm2), perfusion volume, blood volume, and peak enhanced increment increased slightly, while the wash in rate, wash out rate, and maximum enhancement rate increased markedly in the tumor rim and central portion of the tumor. Findings on imaging showed that the tumor tissue was hyperemic with a complete capsule and a smooth rim. At 1.69–1.85 cm (2.85–3.4 cm2), perfusion volume, blood volume, and wash in rate decreased, while the wash out rate increased in the tumor rim. Imaging findings indicated that the tumor was ischemic with a complete capsule and an irregular rim. Perfusion volume, peak enhanced increment, blood volume, maximum enhancement rate increased, the wash in rate stabilized, and the wash out rate decreased in central portions of the tumor, indicating that the tumor was hyperemic. At 1.85–2.10 cm (3.4–4.4 cm2), perfusion volume, blood volume, peak enhanced increment, wash in rate increased significantly, and wash out rate stabilized. Findings on imaging indicated that the tumor was hyperemic and had an incomplete capsule with a lobular and spiculated boundary. Perfusion volume, blood volume, peak enhanced increment, and maximum enhancement rate decreased markedly, the wash in rate stabilized, and the wash out rate decreased slightly in the central portion of the tumor, indicating that the tumor was ischemic. At 2.10–2.19 cm (4.4–4.8 cm2), the perfusion volume, peak enhanced increment, wash in rate, and maximum enhancement rate decreased significantly in the tumor rim, and perfusion volume, peak enhanced increment, and wash in rate decreased markedly in the central portion of the tumor, indicating that the tumor was ischemic with liquefaction necrosis. At 2.19–2.51 cm (4.8–6.3 cm2), the wash in rate increased significantly and the wash out rate increased in the tumor rim and central portion of the tumor, indicating that the tumor was in the growth and diffusion stage; lymphatic metastasis was observed, and hydrothorax and satellite nodules were present. At 1.73–1.85 cm (3.0–3.4 cm2), the wash out rate was markedly increased in the tumor rim, and lymphatic metastasis was found in eight of the rabbits investigated, indicating that metastasis was closely related to wash out rate.
Immunohistochemistry
The tumor tissue was processed for immunohistochemical analysis to demonstrate microvessel density and expression of VEGF protein. At a tumor diameter in the range of 0.59–0.77 cm (0.35–0.6 m2), VEGF expression was positive (+) in the tumor rim and positive (++) in the central portion of the tumor; at 1.85–2.10 cm (3.4–4.4 cm2), VEGF expression was positive (+++) in the tumor rim and positive (++) in the central portion of the tumor; at 2.10–2.19 cm (4.4–4.8 cm2), VEGF expression was positive (++) in the tumor rim and positive (+) in the central portion of the tumor; at 2.19–2.51 cm (4.8–6.3 cm2), VEGF expression was positive (++) in the tumor rim and central portion and positive (+) in the satellite nodules. VEGF expression and microvessel density were correlated with histological differentiation of the tumor tissue, ie, the poorer the differentiation, the higher the positive expression rate ().
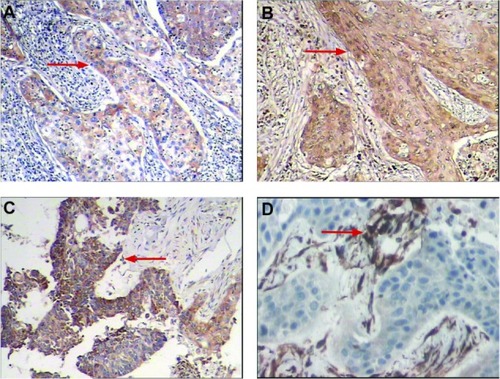
Figure 4 (A) Immunohistochemical staining for positive expression of VEGF. The cytoplasm of tumor cells was stained brown (red arrows). (A) VEGF(+)(SP × 100), (B) VEGF(++)(SP × 100), (C) VEgF(+++)(SP × 100), and (D) positive expression of CD34. Vessels were stained brown and high microvessel density was apparent (SP × 200).
Discussion
VX2 tumor cells can be implanted successfully and have stable histology, making them a suitable model for evaluation of treatment for human cancer. As reported in our previous study,Citation13 VX2 lung cancer is similar to human lung squamous cell carcinoma, showing not only strong morphological similarities on CT imaging but also similar perfusion parameters. In this study, we used a combination of CT and MRI perfusion to demonstrate hemodynamic changes in rabbits with VX2 lung cancer. Perfusion CT and MRI is a new technology that allows assessment of physiology in tumor vasculature and construction of regional maps of tumor blood flow, blood volume, mean transit time, and vascular permeability-surface area product. In addition to being noninvasive and rapidly performed, this type of study can be repeated at different time points to assess tumor response to antiangiogenic therapy and temporal changes in tumor angiogenesis.Citation14–Citation16
Therefore, development of targeted therapies requires identification of appropriate targets, ie, those known to play a key role in the growth and survival of cancer cells. Angiogenesis, ie, the formation of new capillaries, has become an important area of scientific research. It can occur abnormally around malignant tumors, and therapeutic agents targeting antiangiogenesis in cancer are currently being sought.Citation17,Citation18 Part of this search involves quantification of the stimulatory and inhibitory effects of different agents. In order for this quantification to be accurate, objective, and consistent, measurements need to be obtained using automated image analysis. De Keyzer et alCitation19 concluded that the success of treatment for solid tumors depends mainly on an increased amount of necrotic tissue and decreased perfusion in the tumor. Functional parameters, such as blood flow, microvessel permeability-surface area product, blood volume, and mean transit time, are physiological markers related to changes associated with angiogenesis. CT for simultaneous measurement of these four parameters displays each parameter as a functional image over an entire tissue slice.Citation20 The advantages of CT perfusion imaging technology include acquisition of physiological parameters that mainly reflect the blood supply to tumors and other tissues. Magnetic resonance perfusion-weighted imaging is a noninvasive technique that provides physiological information by assessing the process of vascularization and blood flow and quantitatively analyzing information on tumor hemodynamics.Citation21,Citation22 The changes in hemodynamic parameters can objectively evaluate the microcirculation in tumor tissue, new vessels, and the early response to treatment.Citation23–Citation25 This technique also has great potential for assessing the effectiveness of chemotherapy and enabling timely modification of therapy as necessary.Citation26,Citation27
In this study, metastasis to the lymph nodes was found in eight rabbits with VX2 lung cancer, in which we could observe the relationship between tumor growth and parameters of perfusion, ie, tumor growth, wash in rate, intratumoral interstitial pressure and wash out rate increased, after which the tumor invaded adjacent tissue and basement membranes.Citation6,Citation7 CT perfusion and magnetic resonance perfusion-weighted imaging can both be used to evaluate the intricacies of hemodynamics at the capillary level, but show several important differences.Citation28 When the tumor sizes were 0.59–0.77 cm (0.35–0.6 cm2), VEGF expression increased significantly in the tumor and tumor rim, indicating that magnetic resonance perfusion-weighted imaging is more sensitive than CT perfusion imaging when the tumor is smaller; at 1.85–2.19 cm (3.4–4.8 cm2), liquified regions of necrosis were found, and the values of CT quantitative perfusion parameters changed significantly, indicating that CT perfusion imaging was more accurate than magnetic resonance perfusion-weighted imaging; at 2.19–2.51 cm (4.8–6.3 cm2), lymphatic metastasis and hydrothorax occurred, and the values of the magnetic resonance perfusion-weighted imaging parameters again changed significantly, demonstrating that magnetic resonance perfusion-weighted imaging may also be more sensitive to “contamination” by large vascular structures and is limited in some areas because of susceptibility to effects from adjacent structures.
A limitation of our study is that VX2 cells are highly malignant.Citation29 In our study, long-term monitoring was not possible because local implantation of these tumor cells resulted in pleural dissemination and lymphatic metastasis. Tumor cells were initially implanted using CT-guided puncture through a coaxially inserted needle, but pleural dissemination was difficult to prevent, partly because the cells were prepared as a suspension. Coagulative necrosis was observed in these tumor lesions, and extensive malignant pleural effusion, pleural dissemination, and numerous mediastinal lymph node metastases was found at necropsy. Another limitation of our study was the mismatch between perfusion parameters and pathological measurements at an early stage, because of differences in the time points when CT and MRI scans were performed and the times when pathology measurements were done. The relationship between perfusion parameters and pathological findings in early tumor growth requires further investigation.
In conclusion, CT and MRI perfusion imaging techniques are sensitive, specific, and noninvasive. Our data suggest that a combination of CT perfusion and perfusion-weighted imaging could reflect the microvascular distribution in cancer tissue and show the passage of blood flow through the tumor vascular network. Thus, these modalities have an advantage in evaluation of angiogenesis in early human lung cancer.
Acknowledgments
This work was supported by Natural Science Foundation of Inner Mongolia autonomous region, People’s Republic of China (No. 2011MS1134) and Application Technology Research and Development Foundation of Inner Mongolia autonomous region, People’s Republic of China (No.2060402-16).
Disclosure
The authors report no conflicts of interest in this work.
References
- SiegelRNaishadhamDJemalACancer statistics, 2012CA Cancer J Clin201262102922237781
- SiegelRNaishadhamDJemalACancer statistics, 20132013163113010.3322/caac.21166 Epub2013117
- WaltersSMaringeCColemanMPLung cancer survival and stage at diagnosis in Australia, Canada, Denmark, Norway, Sweden and the UK: a population-based study, 2004–2007Thorax20136855156423399908
- HolashJMaisonpierrePCComptonDVessel cooption, regression, and growth in tumors mediated by angiopoietins and VEGFScience19992841994199810373119
- VeikkolaTKarkkainenMClaesson-WelshLAlitaloKRegulation of angiogenesis via vascular endothelial growth factor receptorsCancer Res2000602203221210786685
- RobinsonSPRijkenPFHoweFATumor vascular architecture and function evaluated by non-invasive susceptibility MRI methods and immunohistochemistryJ Magn Reson Imaging20031744545412655584
- VitellasKMTzalonikouMTBennettWFVaswaniKKBovaJGCirrhosis: spectrum of findings on unenhanced and dynamic gadolinium-enhanced MR imagingAbdom Imaging20012660161511907725
- MilesKAPerfusion CT for the assessment of tumour vascularity: which protocol?Br J Radiol200376Spec No 1S36S4215456712
- KimSJKimIJKimYSCharacterization of solitary pulmonary nodules using double phase Tc-99m methoxyisobutylisonitrile scan: Comparison of visual and quantitative analysesThoracic Cancer201234047
- MilesKAGriffithsMRFuentesMAStandardized perfusion value: universal CT contrast enhancement scale that correlates with FDG PET in lung nodulesRadiology200122054855311477267
- AronenHJGazitIELouisDNCerebral blood volume maps of gliomas: comparison with tumor grade and histologic findingsRadiolog y19941914151
- KeirSPageCThe rabbit as a model to study asthma and other lung diseasesPulm Pharmacol Ther20082172173018430597
- ZhangQShiQBLiuZXZhangMMA controlled study on comparing differences in CT perfusion imaging between rabbits inoculated with VX2 lung tumor and patients with squamous cell carcinoma of the lungClin Oncol Cancer Res20107366372
- ThoenyHCDe KeyzerFVandecaveyeVChenFSunXBosmansHEffect of vascular targeting agent in rat tumor model: dynamic contrast-enhanced versus diffusion-weighted MR imagingRadiology200511237492499 Epub200592816192323
- MilesKATumour angiogenesis and its relation to contrast enhancement on computed tomography: a reviewEur J Radiol19993019820510452718
- MilesKACharnsangavejCLeeFTFishmanEKHortonKLeeTYApplication of CT in the investigation of angiogenesis in oncologyAcad Radiol2000784085011048881
- NingTJiangMPengQLow-dose endostatin normalizes the structure and function of tumor vasculature and improves the delivery and anti-tumor efficacy of cytotoxic drugs in a lung cancer xenograft murine modelThoracic Cancer20123229238
- KerbelRFolkmanJClinical translation of angiogenesis inhibitorsNat Rev Cancer2002272773912360276
- De KeyzerFVandecaveyeVThoenyHDynamic contrast-enhanced and diffusion-weighted MRI for early detection of tumoral changes in single-dose and fractionated radiotherapy: evaluation in a rat rhabdomyosarcoma modelEur Radiol2009192663267119504109
- PurdieTGHendersonELeeTYFunctional CT imaging of angiogenesis in rabbit VX2 soft-tissue tumourPhys Med Biol2001463161317511768498
- WasserKKleinSKFinkCEvaluation of neoadjuvant chemotherapeutic response of breast cancer using dynamic MRI with high temporal resolutionEur Radiol200313808712541113
- NeemanMDafniHBukhariOBraunRDDewhirstMWIn vivo BOLD contrast MRI mapping of subcutaneous vascular function and maturation: validation by intravital microscopyMagn Reson Med20014588789811323816
- ZhouHZhangMMXiaoSXWangLJZhouMZouYDynamic contrast-enhanced computed tomography functional imaging for the evaluation of tumor angiogenesis in patient with lung carcinomaZhonghua Fangshexue Zazhi200640171175 Chinese
- ZhangJFWangRFWuJYangMInvestigation of multi-slice spiral CT (MSCT) perfusion imaging before and after transcatheter arterial embolization (TAE) in VX2 soft-tissue tumor of rabbitFangshexue Shijian200520110113 Chinese
- SahaniDVKalvaSPHambergLMAssessing tumor perfusion and treatment response in rectal cancer with multisection CT: initial observationsRadiology200523478579215734934
- PicklesMDLowryMMantonDJGibbsPTurnbullLWRole of dynamic contrast enhanced MRI in monitoring early response of locally advanced breast cancer to neoadjuvant chemotherapyBreast Cancer Res Treat20059111015868426
- SchuhmannMEberhardtRHerthFEndobronchial Ultrasound for Peripheral Lesions: A ReviewEndoscopic Ultrasound2013236
- CouttsSBSimonJETomanekAIReliability of assessing percentage of diffusion-perfusion mismatchStroke2003341681168312805485
- GoldbergSNGazelleGSComptonCCMuellerPRMcLoudTCRadiofrequency tissue ablation of VX2 tumor nodules in the rabbit lungAcad Radiol199639299358959183