Abstract
Background
Although epidermal growth factor receptor (EGFR)-tyrosine kinase inhibitors (TKIs) are widely used for EGFR mutated non-small-cell lung cancer (NSCLC) patients, tumor sample availability and heterogeneity of the tumor remain challenging for physicians’ selection of these patients. Here, we developed a serum proteomic classifier based on matrix assisted laser desorption ionization time of flight mass spectrometry (MALDI-TOF-MS) to predict the clinical outcome of patients treated with EGFR-TKIs.
Method
A total of 68 patients were included in this study. All patients received EGFR-TKIs as second or third line treatment and blood samples were collected before treatment. Using magnetic bead assisted serum peptide capture coupled to MALDI-TOF-MS, pretreatment serum from 24 NSCLC patients was analyzed to develop a proteomic classifier (training set). In a blinded test set with 44 patients, each sample was classified into “good” or “poor” groups using this classifier. Survival analysis of each group was done based on this classification.
Result
A 3-peptide proteomic classifier was developed from the training set. In the testing set, the classifier was able to distinguish patients of “good” or “poor” outcomes with 93% accuracy, sensitivity, and specificity. The overall survival and progression free survival of the predicted good group were found to be significantly longer than the poor group, not only in the whole population but also in certain subgroups, such as pathological adenocarcinoma and nonsmokers. With respect to the tumor samples available for EGFR mutation detection, all eight EGFR mutant tumors and three of the 12 wild type EGFR tumors were classified as good while nine of the 12 wild type EGFR tumors were classified as poor.
Conclusion
The current study has shown that a proteomic classifier can predict the outcome of patients treated with EGFR-TKIs and may aid in patient selection in the absence of available tumor tissue. Further studies are necessary to confirm these findings.
Introduction
Growing evidence has shown the efficacy of epidermal growth factor receptor (EGFR)-tyrosine kinase inhibitors (TKIs), such as erlotinib and gefitinib, in first line, second line, and maintenance treatment for advanced non-small-cell lung cancer (NSCLC).Citation1–Citation5 Nevertheless, only a subgroup of patients benefit from treatment with EGFR-TKIs. Extensive studies have revealed that EGFR activating mutationsCitation6–Citation8 were the primary predictors to select patients that are more likely to benefit from EGFR-TKIs. However, for recurrent/metastatic NSCLC patients in the real world practice, obtaining an adequate amount of tumor tissue for analysis can be challenging. Furthermore, intratumoral heterogeneity and change in a tumor’s characteristics after multiple lines of treatment also have a great impact on the accuracy of detection.Citation9–Citation12
Recently, studies have reported that EGFR mutations can be tested in serum genomic DNA or circulating lung cancer cells.Citation13–Citation19 These analyses were usually in the absence of reliability and standardization and could not be routinely used in clinical practice because of an expensive test fee and limited facilities in developing countries. A more sensitive and specific assay should be developed to select people who may profit from targeted therapy.
It is now widely recognized that protein expression can more accurately indicate the character and development of disease.Citation20 Moreover, it is obvious that a pattern of multiple biomarkers will contain a higher level of discriminatory information when compared to a single biomarker alone. Recently, several laboratories have demonstrated the feasibility of using proteomics to detect patients that will benefit from antitumor therapy.Citation21–Citation26
Among proteomic technologies, magnetic bead assisted peptide capture coupled with matrix assisted laser desorption ionization time of flight mass spectrometry (MALDI-TOF-MS) is a high accuracy, high throughout, and rapid technique for analyzing complex biological samples, such as serum, urine, and tissue.Citation27 The method for profiling a population of proteins in a sample is according to the size and net electrical charge of the individual proteins. This technology, in combination with bioinformatics, has been successfully applied to analyze complex serum proteins to obtain early detection of tumors, such as breast cancer,Citation28 bladder cancer,Citation29,Citation30 head and neck cancer,Citation31,Citation32 and hepatocellular carcinoma.Citation33,Citation34
Also, serum proteomic classifiers have recently been developed to predict therapeutic response using MALDI-TOF-MS. Taguchi et alCitation22 reported a MALDI-TOF-MS proteomic signature (VeriStrat), comprised of eight protein features, that was able to classify patients of NSCLC for improved progression free survival (PFS) and overall survival (OS) after treatment with EGFR-TKIs therapies. But further studies have shown that it was also applicable to other epithelial cancers, such as colorectal and head and neck squamous cell carcinomas, and to other targeted therapies, including anti-EGFR and anti-vascular endothelial growth factor.Citation26,Citation35–Citation38 It suggests that this biomarker is associated with survival benefits from EGFR pathway inhibitors and thereby can be applied to other epithelial derived malignancies.
In the present study, we aimed to analyze serum protein profiles from Asian patients who were treated with EGFR-TKIs with magnetic bead assisted serum peptide capture coupled to MALDI-TOF-MS and to develop a classification algorithm that could identify subgroups of NSCLC patients with improved survival after treatment with EGFR-TKIs. The prediction model was then validated in a blinded test set for its predictive capability. Finally, we assessed the predictive value of this proteomics classifier in the context of some clinical characteristics and the EGFR mutation status.
Materials and methods
Sample collection and study population
Pretreatment serum samples were collected from patients treated with gefitinib/erlotinib. Inclusion criteria in this study were incurable stage IIIB/IV NSCLC patient failure or intolerance to chemotherapy, Eastern Cooperative Oncology Group (ECOG) performance status 0 or 1, estimated life expectancy ≥12 weeks, and without severe underlying diseases.
All patients received gefitinib (250 mg/day) or erlotinib (150 mg/day) monotherapy until disease progression. Tumors were assessed at baseline with computed tomography scans. The second computed tomography scans of the chest and abdomen were obtained 4 weeks after treatment. The subsequent imaging was undertaken at least every 8 weeks. Responses were assessed according to Response Evaluation Criteria in Solid Tumors.Citation39
Before analysis, the patients were randomly divided into two cohorts: the training set and testing set. The training set was used for developing the classification algorithm which could discriminate benefit and nonbenefit populations. The testing set was used in a blinded fashion to validate the predictive algorithm. The patients were also divided into two groups according to the response to treatment and PFS. The good clinical outcome group consisted of two conditions: partial response (PR) and long stable disease ([SD] SD >3 months). The poor clinical outcome group consisted of progressive disease (PD) and short stable disease (SD ≤3 months).
Patients provided written informed consent for the study. Blood samples were obtained before EGFR-TKIs treatment. Serum was separated by centrifugation for 20 minutes at 4000 rpm, aliquoted, and stored at −80°C prior to running the assays.
Sample preparation
In preliminary experiments, serum samples were processed with different surface functionalities of ClinProt™ microparticle beads (Bruker Daltonik GmbH, Leipzig, Germany), such as magnetic bead (MB) immobilized metal ion affinity chromatography and MB weak cation exchange (MB-WCX). We chose MB-WCX in this study for its better capture ability of proteins or peptides. A detailed procedure for choosing the beads for serum peptide preparation was described previously. Prior to mass spectrometry (MS) analysis, serum samples were subjected to fractionation using MB-WCX kits according to the manufacturer’s instructions (Bruker Daltonik GmbH). Briefly, we mixed 10 μL binding solution and 10 μL MB-WCX beads in a polymerase chain reaction tube. Five milliliters of serum were added to the solution, mixed intensively, and incubated for 5 minutes. Then, we separated the unbound solution with the magnetic separator. After magnetic bead separation and washing three times, the bound proteins/peptides were eluted from the magnetic beads. Finally, the eluted proteome fraction was mixed with 1 mL of matrix (saturated solution of 4-hydroxy-3,5-dimethoxycinnamic acid in 50% acetonitrile with 0.5% trifluoroacetic acid) and spotted onto the AnchorChip target (Bruker Daltonics Inc, Santa Barbara, CA, USA) for analysis.
MS analysis (protein profiling)
We used a linear MALDI-TOF-MS (Microflex; Bruker Daltonics Inc) for peptidome profiling according to the protocol previously described. The settings were applied as follows: ion source 1, 20 kV; ion source 2, 18 kV; lens, 7.5 kV; pulsed ion extraction, 210 ns; and nitrogen pressure, 1,700–2,000 mbar. Ionization was achieved by irradiation with a nitrogen laser (λ =337 nm) operating at 25 Hz. Profile spectra were acquired from an average of 400 laser shots. Instrument calibration parameters were determined using standard peptide and protein mixtures (Bruker Daltonics Inc). Human serum (catalog number S7023, Sigma Chemical Co, St Louis, MO, USA) was used to evaluate the reproducibility for quality control once every 15 samples. All signals with a signal to noise ratio >5 in a mass range of 800–10,000 Da were recorded with the use of the flex control tool acquisition software (version 3.0; Bruker Daltonics Inc). Proteomic pattern recognition was processed with ClinProTools™ bioinformatics software (version 2.1; Bruker Daltonics Inc).
Data processing and statistical analysis
All signals in a mass range of 800–10,000 Da were processed for noise reduction with the top hat baseline and savitsky smoothing functions of the ClinProTools™. A signal to noise ratio =5 was set for protein peaks detection. FlexAnalysis 3.0 and ClinProTool 2.1 software (Bruker Daltonics Inc) was used for MS data processing and statistical analysis. The different expressions of the same mass to charge ratio (M/Z) protein peaks in the two groups were compared by the parametric testing (t test) and nonparametric hypothesis testing, and classification analysis was undertaken. Then we applied a genetic algorithm for global search, k nearest neighbor (KNN) algorithm for classified discrimination, and optimized the k (k =3, 5, 7, 9) values to establish a best classification model based on genetic algorithm (GA)-KNN. The classification model was then applied to identify the patients with different outcomes in the validation set. Univariate survival analysis was based on the Kaplan–Meier product limit estimate. Differences between survival curves were compared with the use of the log-rank test. The relative importance on survival of each parameter included in the univariate analysis was estimated using the Cox proportional hazards regression model. Multivariable Cox proportional hazard analysis was done to evaluate the relevance of various clinical features. All statistical tests were two-tailed, and P<0.05 was considered statistically significant.
Result
Patient population
Detailed patient characteristics of the training and validation cohorts are presented in . The training set contained 24 patients, and the prediction algorithm was applied to a validation set consisting of 44 NSCLC patients. Most of the patients included in this study were stage IV, with ECOG performance status of 1–2, and had received prior chemotherapies for recurrent or metastatic disease. The majority of patients were nonsmokers and had adenocarcinoma histology.
Table 1 Patient characteristics
Comparison of proteomic level between patients
First, we compared the different proteomic level between the good clinical outcome group and poor clinical outcome group in the training set. There were 18 peaks expressed as significantly different between the two groups (P<0.05). The mass spectra of M/Z 5965.53, 8141.66, 7009.78, 7766.58, 7877.8, 9290.1, 9183.46, 9062.55, 7675.66, 8992.56, 7600.27, 7830.22, 8863.24, and 7634.22 were more highly expressed in the poor clinical outcome group, and the mass spectra of M/Z 1618.99, 2952.01, 2933.39, and 1464.98 were highly expressed in the good clinical outcome group ( and , ).
Figure 1 Normalized median intensity matrix-assisted laser desorption ionization time of flight mass spectrometry mass spectra of serum in patients with different outcomes.
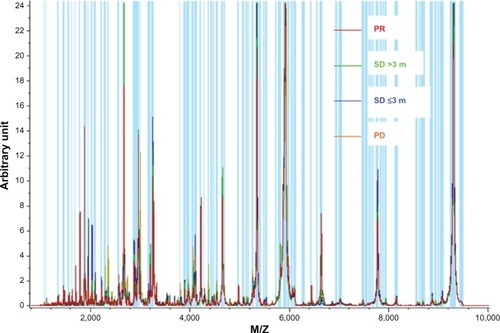
Figure 2 Intensity plots for mass to charge ratio 7766.58 in patients with different outcomes.
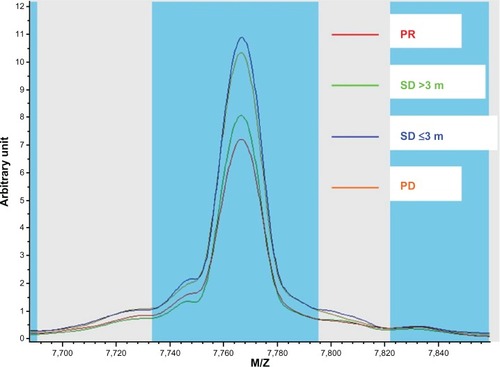
Table 2 Distinct mass to charge ratio features in patients with different outcomes
Development of a prediction model
Next we established a GA-KNN based model with the ClinProTools™ software to predict the outcome after EGFR-TKIs therapy. This model is based on three peaks with M/Z 5965.53, 7766.58, and 9062.55. In the training set, all the 14 good outcome cases and 10 poor cases were correctly classified.
Validation of the prediction model
This prediction model was then validated by a blinded test set consisting of 15 sera from poor outcome patients and 29 sera from good outcome individuals. A total of 93% (14 of 15) of poor outcome patients and 93% (27 of 29) of good outcome patients were correctly identified. The result of the cross validation was 93%.
Predictive properties of the proteomic classifier on survival
Patients classified as good outcome are expected to have a better OS or PFS than the predicted poor outcome patients. According to the 3-peptide proteomic classifier, we divided the patients of the testing sets into predicted good and poor outcome groups. Of the 44 NSCLC patients, 28 were classified as the predicted good outcome group and 16 were classified as the poor outcome group. The Kaplan–Meier survival curves for the two groups are shown in and . Patients in the predicted good group had significantly longer OS (hazard ratio [HR], 0.357; 95% confidence interval [CI], 0.186–0.688; P=0.002) and PFS (HR, 0.06; 95% CI, 0.022–0.158; P<0.001) than those in poor group ().
Figure 3 Kaplan–Meier survival curves predicting good and poor survival.
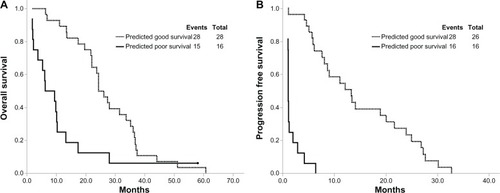
Figure 4 Kaplan–Meier survival curves for overall survival in adenocarcinoma and nonsmoker subgroups.
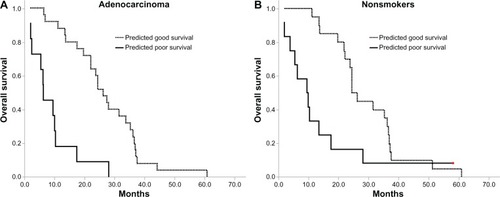
Table 3 Overall and progression free survival outcomes in the validation cohorts based on the classification
Exploratory assessment of the proteomic classifier’s predictive value in subgroups
Subsequently, we applied the proteomic classifier to predict patient subgroups with different clinical characters. In the stratified subsets of patients who were nonsmokers or had pathological adenocarcinoma, the survival of the predicted good group was significantly longer than the predicted poor one ( and ), notwithstanding these subsets of patients had been reported to be more sensitive to EGFR-TKIs. Given the relatively small sample size in other stratified factors, such as sex (male or female), squamous carcinoma, and smoking, meaningful Kaplan–Meier survival analysis was unavailable in these subsets.
In addition, we explored the association of the proteomic classifier and the EGFR status in the testing set. Tumor tissue samples were obtained for analysis of mutations in exons 18 to 21 of EGFR from 20 of all 44 patients. Six tumors had inframe deletions in exon 19, two tumors had a substitution mutation L858R in exon 21, and another 12 tumors were wild type. With the proteomic prediction model, all eight EGFR mutant tumors and three of the 12 wild type EGFR tumors were classified as good, and nine of the 12 wild type EGFR tumors as poor. The classified results based on proteomics are identical with the clinical outcomes.
Cox univariate and multivariate analyses for PFSand OS
Finally, Cox univariate and multivariate analyses of OS and PFS were done on the validation cohorts using the proteomic classification and clinicopathologic variables including histology, sex, age, and drug and smoking history (). The univariate model indicates that only the MALDI-TOF-MS data analysis algorithm classification was independently associated with survival benefit. With multivariate analysis, smoking status and proteomic classification were significantly correlated with OS.
Table 4 Results of Cox univariate and multivariate analyses for progression free survival and overall survival
Discussion
In the present study, we used magnetic bead assisted serum peptide capture coupled with MALDI-TOF-MS to compare the different proteomic levels in the different clinical outcome groups of NSCLC patients who received EGFR-TKIs therapy. To the best of our knowledge, this is the first attempt to use the method of MB based separation and MS generated profiles to predict the survival of NSCLC patients treated with targeted therapy. The patients included in this study were all Asian.
Unlike pooled data supporting the role of genomics in predicting target selectivity of EGFR-TKIs, only a few studies have been focused on the identification of protein signatures to select candidate patients. In a recent study, Okano et alCitation21 developed a set of nine protein spots, which were based on the comparison of PRs and PDs, to identify the EGFR-TKI effect in NSCLC patients. In the validation set, the proteomic classifier successfully distinguished responders (complete response [CR]/PR) from nonresponders (PD). Nevertheless, the model garnered criticism for its neglect of the SD cases since data have shown survival improvement may not be confined exclusively to patients with tumor shrinkage,Citation40 and considering that stabilization of the disease and prolonged OS are important criteria of benefit from treatment. In the present study, we specifically took the response to treatment and PFS/OS together as end points of our classifier. In the preliminary experiment, we compared all the mass spectra in the training set with visualization. It showed that the spectra curve of the long SD (SD >3 months) was close to PR, and short SD (SD ≤3 months) was close to the PD. The curves of the former two groups were distinctly deviated from the latter two groups (). Accordingly, in the training set we divided the patients with PR and long SD to the good clinical outcome group, the PD and short SD to the poor outcome group. In the validation set, the proteomic classifier acquired a relatively high predictive accuracy even within the SD population.
Nowadays, EGFR mutation status appears to be the most valid predictive biomarker for EGFR-TKIs treatment.Citation41,Citation42 Indeed, mutation testing is most relevant to treatment decision in the first line therapy setting. In second or third line treatment, the existing literature only confirms the predictive efficacy of EGFR mutations on tumor response and PFS.Citation43 However, the predictive effect of mutations on OS remains unclear. In the BR.21 trial, data showed that EGFR mutations were prognostic rather than predictive markers.Citation44 In the present study, with a novel MALDI-TOF-MS proteomic classifier, we divided 44 patients into two groups, finding that both OS and PFS in the predicted good group were significantly longer than in the poor group. The Cox proportional hazards regression model showed that the predictive algorithm had better association with survival than the other clinical features. This result was in line with the study by Taguchi et al.Citation22 They showed that the predicting algorithm, named VeriStrat, which is based on the analyses of pretreatment sera or plasma using MALDI-TOF-MS, could identify patients with improved survival and time to progression after EGFR-TKIs treatment. In subset analysis, they showed that VeriStrat was independent of clinical features, such as smoking, sex, and histology. Likewise in our experiments, the classification algorithm kept its predictive value in patients who are likely to respond to the EGFR-TKIs, such as nonsmokers and those with pathological adenocarcinoma. All eight patients harboring EGFR mutations were exactly divided into the predicted good group. The results indicate that for patients without sufficient tissue for EGFR mutation detection, a serum proteomic test can provide valuable information and assist in selecting patients who would benefit from EGFR-TKIs.
Although sensitivity to EGFR-TKIs is considered to be associated with activating mutations in the tyrosine kinase domain, for patients with the wild type EGFR gene, there is a response rate of 10%.Citation45,Citation46 Recently, several researchers have indicated novel gene alterations, such as CYP1A1*2A,Citation47 or expression of novel molecular biomarkers, like amphiregulin,Citation48 would be associated with prolonged survival in patients harboring the wild type EGFR gene. In the ECOG 3503 trial,Citation26 VeriStrat status was significantly associated with survival in patients with wild type EGFR. Our exploratory analysis also showed that, of the available tumor samples, three of the 12 EGFR wild type tumors were classified as good and nine classified as poor. The classified results are identical with the clinical outcomes. Thus, a proteomic classifier may be capable of identifying a subset of NSCLC patients with wild type EGFR who will benefit from EGFR-TKI therapy.
Furthermore, we also realized that other genetic alterations, especially Kirsten rat sarcoma viral oncogene homologue (KRAS) mutation, were associated with poor response to EGFR-TKIs.Citation49,Citation50 However, KRAS mutation is less common in Asians. In a recent study, An et alCitation51 reported a relatively low mutation rate of KRAS in Chinese NSCLC patients (5.4% of cases). In the present study, most patients are diagnosed from cytologic samples or small biopsies where there may be inadequate amounts of tumor for such biomarker assessments. Although some studies have suggested that the status of KRAS contributes to the response to EGFR-TKIs in patients with wild type EGFR,Citation49,Citation50,Citation52 at present the evidence is not strong enough for KRAS status to be used in selecting the EGFR-TKI target population even in those with wild type KRAS. Moreover, EGFR and KRAS mutations are almost mutually exclusive.Citation51 Patients with KRAS mutations rarely harbor EGFR mutations, whereas those with wild type KRAS may potentially harbor EGFR mutations. Therefore, we only focused on the EGFR status rather than KRAS status in this study. Nevertheless, we would consider more molecular alterations in future studies.
We found that many notable mass spectra differences existed between sera of patients with different responses to EGFR-TKIs. This result indicated the presence of a unique proteomic signature characteristic of tumor TKI sensitivity. In a previous study, the proteomic signature (VeriStrat®) that is comprised of eight protein features was able to classify patients for improved survival after treatment with EGFR-TKIs.Citation22 Interestingly, in the current study, classifiers based on only three proteomic features could also stratify NSCLC patients after treatment with EGFR-TKIs in terms of OS and PFS. We suspect that there are several reasons contributing to this difference. First, VeriStrat® was built on the basis of the most different MALDI-TOF-MS spectra belonging to the patients with SD longer than 6 months (classified as good) and progressive disease within 1 month (classified as poor).Citation22 As previously described, we divided the patients with PR and long SD to the good clinical outcome group, and the PD and short SD to the poor group. Considering all patients with distinct response/survival were brought into the training set, our classification may be more close to facts in clinical practice. Secondly, analysis of VeriStrat® in the sera from patients included in the BR.21 trial was recently reported and indicated that this marker had prognostic as well as predictive value.Citation53 Further studies indicated that the same signature was also applicable to other epithelial cancers, such as colorectal and head and neck squamous cell carcinomas,Citation37 and to other targeted therapies, including anti-EGFR and anti-vascular epithelial growth factor.Citation35,Citation36 Accordingly, it suggests that this proteomic profile may detect tumor EGFR signal dependence and thus somewhat explain why the protein features of VeriStrat® are more than the ones of our classifier. Lastly, most patients in VeriStrat® related studies are Caucasian. In our study, all patients are Asian. The underlying race differences may partly contribute to the proteomic distinctions.
Furthermore, the spectral feature of M/Z 5965.53 in our classifier resembled one of the features in VeriStrat®. A recent publication demonstrated that four out of the eight peaks of the VeriStrat signature, including the peak at M/Z 5843, contain several forms of serum amyloid A1 (SAA1).Citation54 Although the authors did not find the mechanistic effect of SAA1 upregulated in VeriStrat poor classified patients, they speculated that higher SAA1 levels are associated with activation of the tumor microenvironment which in turn is responsible for cancer progression. Since accumulating data have shown that the role of the tumor microenvironment is more relevant in patients treated with EGFR-TKIs, we also hypothesize that the signatures of our classifier are associated with specific tumor-host interactions, which lead to the distinctions in survival of NSCLC patients with EGFR-TKIs therapy.
Finally, we cannot exclude the prognostic role of the proteomic classifier in EGFR-TKIs treatment. However, considering the classifier was strongly associated with tumor response and duration of PFS, the survival signature may relate to therapy outcome rather than natural history of the disease. Moreover, to confirm whether the predictive power of the classifier is specific to treatment with EGFR-TKIs, another two cohorts of patients treated with chemotherapy or surgery alone should be included in a further study.
In the current study, we confirm that serum protein profiles are distinct in patients with different response to EGFR-TKIs. A noninvasive, highly sensitive, and high throughput approach was established to predict the clinical outcome of NSCLC patients administered with EGFR-TKIs. Our findings suggest that the MS based serum classifier may assist clinicians in the selection of second or third line therapy in the absence of available tumor tissue or in patients whose tumors have wild type EGFR, or in certain subsets, such as nonsmokers and patients with pathological adenocarcinoma. Although our findings are encouraging, we cannot rule out that a heterogeneous patient group with a small number of patients, and a retrospective single institution study may result in an incorrect estimate of the association between the algorithm and clinical outcome. Accordingly, further validation with larger cohorts and randomized prospective trials is necessary in Asia to validate the proteomic classifier. Since the biology underlying this serum classifier is unclear, the next step is to purify, identify, and characterize the proteins that are expressed at significantly different levels between patients with different outcomes. Further understanding about the mechanisms of the sensitivity and resistance to EGFR-TKIs can be explored to bring out the individualized therapy for patients with advanced NSCLC.
Disclosure
The authors report no conflict of interest in this work.
References
- KimESHirshVMokTGefitinib versus docetaxel in previously treated non-small-cell lung cancer (INTEREST): a randomized Phase III trialLancet200837296521809181819027483
- ShepherdFARodrigues PereiraJCiuleanuTNational Cancer Institute of Canada Clinical Trials GroupErlotinib in previously treated non-small-cell lung cancerN Engl J Med2005353212313216014882
- MokTSWuYLThongprasertSGefitinib or carboplatin–paclitaxel in pulmonary adenocarcinomaN Engl J Med20093611094795719692680
- ThatcherNChangAGefitinib plus best supportive care in previously treated patients with refractory advanced non-small-cell lung cancer: Results from a randomized, placebo-controlled, multicentre study (Iressa Survival Evaluation in Lung Cancer)Lancet200536694961527153716257339
- ZhangLMaSSongXINFORM investigatorsGefitinib versus placebo as maintenance therapy in patients with locally advanced or metastatic non-small-cell lung cancer (INFORM; C-TONG 0804): a multicentre, double-blind randomized phase 3 trialLancet Oncol201213546647522512843
- LynchTJBellDWSordellaRActivating mutations in the epidermal growth factor receptor undenying responsiveness of non-small-cell lung cancer to gefitinibN Engl J Med20043502129213915118073
- PaezJGJannePALeeJCEGFR mutations in lung cancer: correlation with clinical response to gefitinib therapyScience200430456761497150015118125
- TakanoTFukuiTOheYEGFR mutations predict survival benefit from gefitinib in patients with advanced lung adenocarcinoma: a historical comparison of patients treated before and after gefitinib approval in JapanJ Clin Oncol200826345589559518794545
- TaniguchiKOkamiJKodamaKHigashiyamaMKatoKIntratumor heterogeneity of epidermal growth factor receptor mutations in lung cancer and its correlation to the response to gefitinibCancer Sci200899592993518325048
- ChenZYZhongWZZhangXCEGFR mutation heterogeneity and the mixed response to EGFR tyrosine kinase inhibitors of lung adenocarcinomasOncologist201217797898522673630
- ZhouQZhangXCChenZHRelative abundance of EGFR mutations predicts benefit from gefitinib treatment for advanced non-small-cell lung cancerJ Clin Oncol201129243316332121788562
- BaiHWangZChenKInfluence of chemotherapy on EGFR mutation status among patients with non-small-cell lung cancerJ Clin Oncol201230253077308322826274
- PunnooseEAAtwalSLiuWEvaluation of circulating tumor cells and circulating tumor DNA in non-small cell lung cancer: association with clinical endpoints in a phase II clinical trial of pertuzumab and erlotinibClin Cancer Res20121882391240122492982
- TaniguchiKUchidaJNishinoKQuantitative detection of EGFR mutations in circulating tumor DNA derived from lung adenocarcinomasClin Cancer Res201117247808781521976538
- BaiHMaoLWangHSEpidermal growth factor receptor mutations in plasma DNA samples predict tumor response in Chinese patients with stages IIIB to IV non-small-cell lung cancerJ Clin Oncol200927162653265919414683
- XuFWuJXueCComparison of different methods for detecting epidermal growth factor receptor mutations in peripheral blood and tumor tissue of non-small cell lung cancer as a predictor of response to gefitinibOnco Targets Ther2012543944723251095
- MaheswaranSSequistLVNagrathSDetection of mutations in EGFR in circulating lung cancer cellsN Engl J Med2008359436637718596266
- YungTKChanKCMokTSTongJToKFLoYMSingle-molecule detection of epidermal growth factor receptor mutations in plasma by microfluidics digital PCR in non-small cell lung cancer patientsClin Cancer Res20091562076208419276259
- KimuraHKasaharaKShibataKEGFR mutation of tumor and serum in gefitinib-treated patients with chemotherapy-naive non-small cell lung cancerJ Thorac Oncol20061326026717409866
- CoombesKRMorrisJSHuJEdmonsonSRBaggerlyKASerum proteomics profiling-a young technology begins to matureNat Biotechnol200523329129215765078
- OkanoTKondoTFujiiKProteomic signature corresponding to the response to gefitinib (Iressa, ZD1839), an epidermal growth factor receptor tyrosine kinase inhibitor in lung adenocarcinomaClin Cancer Res200713379980517289870
- TaguchiFSolomonBGregorcVMass spectrometry to classify non-small-cell lung cancer patients for clinical outcome after treatment with epidermal growth factor receptor tyrosine kinase inhibitors: a multicohort cross-institutional studyJ Natl Cancer Inst2007991183884617551144
- SalmonSChenHChenSClassification by mass spectrometry can accurately and reliably predict outcome in patients with non-small cell lung cancer treated with erlotinib-containing regimenJ Thorac Oncol20094668969619404214
- VoortmanJPhamTVKnolJCGiacconeGJimenezCRPrediction of outcome of non-small cell lung cancer patients treated with chemotherapy and bortezomib by time-course MALDI-TOF-MS serum peptide profilingProteome Sci200973419728888
- HeJShenDChungDUTumor proteomic profiling predicts the susceptibility of breast cancer to chemotherapyInt J Oncol200935468369219724903
- AmannJMLeeJWRoderHGenetic and proteomic features associated with survival after treatment with erlotinib in first-line therapy of non-small cell lung cancer in Eastern Cooperative Oncology Group 3503J Thorac Oncol20105216917820035238
- VillanuevaJPhilipJEntenbergDSerum peptide profiling by magnetic particle-assisted, automated sample processing and MALDI-TOF mass spectrometryAnal Chem20047661560157015018552
- QiuFLiuHYZhangXJTianYPOptimization of magnetic beads for MALDI-TOF MS analysisFront Biosci (Landmark Ed)2009143712372319273304
- SchwambornKKriegRCGrosseJSerum Proteomic Profiling in Patients with Bladder CancerEur Urol200956698999619282097
- VillanuevaJShafferDRPhilipJDifferential exoprotease activities confer tumor-specific serum peptidome patternsJ Clin Invest2006116127128416395409
- ChangJTChenLCWeiSYIncrease diagnostic efficacy by combined use of fingerprint markers in mass spectrometry-plasma peptidomes from nasopharyngeal cancer patients for exampleClin Biochem200639121144115117014837
- FreedGLCazaresLHFichandlerCEDifferential capture of serum proteins for expression profiling and biomarker discovery in pre- and posttreatment head and neck cancer samplesLaryngoscope20081181616818043497
- RessomHWVargheseRSDrakeSKPeak selection from MALDI-TOF mass spectra using ant colony optimizationBioinformatics200723561962617237065
- OrviskyEDrakeSKMartinBMEnrichment of low molecular weight fraction of serum for MS analysis of peptides associated with hepatocellular carcinomaProteomics2006692895290216586431
- CarboneDPSalmonJSBillheimerDVeriStrat classifier for survival and time to progression in non-small cell lung cancer (NSCLC) patients treated with erlotinib and bevacizumabLung Cancer201069333734020036440
- KuiperJLLindJSGroenHJVeriStrat(®) has prognostic value in advanced stage NSCLC patients treated with erlotinib and sorafenibBr J Cancer2012107111820182523079575
- ChungCHSeeleyEHRoderHDetection of tumor epidermal growth factor receptor pathway dependence by serum mass spectrometry in cancer patientsCancer Epidemiol Biomarkers Prev201019235836520086114
- LazzariCSpreaficoABachiAChanges in plasma mass-spectral profile in course of treatment of non-small cell lung cancer patients with epidermal growth factor receptor tyrosine kinase inhibitorsJ Thorac Oncol201271404821964534
- TherassePArbuckSGEisenhauerEANew guidelines to evaluate the response to treatment in solid tumorsJ Natl Cancer Inst200092320521610655437
- KurataTMatsuoKTakadaMIs the importance of achieving stable disease different between epidermal growth factor receptor tyrosine kinase inhibitors and cytotoxic agents in the second-line setting for advanced non-small cell lung cancer?J Thorac Oncol20061768469117409937
- DouillardJYTargeting the target: a step forward for the treatment of non-small-cell lung cancerLancet Oncol201011210410520152760
- FukuokaMWuYLThongprasertSBiomarker analyses and final overall survival results from a phase III, randomized, open-label, first-line study of gefitinib versus carboplatin/paclitaxel in clinically selected patients with advanced non-small-cell lung cancer in Asia (IPASS)J Clin Oncol201129212866287421670455
- SaijoNTakeuchiMKunitohHReasons for response differences seen in the V15-32, INTEREST and IPASS trialsNat Rev Clin Oncol20096528729419390555
- ZhuCQda Cunha SantosGDingKNational Cancer Institute of Canada Clinical Trials Group Study BR.21Role of KRAS and EGFR as biomarkers of response to erlotinib in National Cancer Institute of Canada Clinical Trials Group Study BR.21J Clin Oncol200826264268427518626007
- KobayashiTKoizumiTAgatsumaTA phase II trial of erlotinib in patients with EGFR wild-type advanced non-small-cell lung cancerCancer Chemother Pharmacol201269512421246
- YoshiokaHHottaKKiuraKOkayama Lung Cancer Study GroupA phase II trial of erlotinib monotherapy in pretreated patients with advanced non-small cell lung cancer who do not possess active EGFR mutationsJ Thorac Oncol2010519910419898258
- NieQYangXNAnSJCYP1A1*2A polymorphism as a predictor of clinical outcome in advanced lung cancer patients treated with EGFR-TKI and its combined effects with EGFR intron 1 (CA)n polymorphismEur J Cancer201147131962197021616658
- IshikawaNDaigoYTakanoAIncreases of amphiregulin and transforming growth factor-α in serum as predictors of poor response to gefitinib among patients with advanced non-small cell lung cancersCancer Res200565209176918416230376
- LinardouHDahabrehIJKanaloupitiDAssessment of somatic k-RAS mutations as a mechanism associated with resistance to EGFR-targeted agents: a systematic review and meta-analysis of studies in advanced non-small-cell lung cancer and metastatic colorectal cancerLancet Oncol2008996297218804418
- MaoCQiuLXLiaoRYKRAS mutations and resistance to EGFR-TKIs treatment in patients with non-small cell lung cancer: a meta-analysis of 22 studiesLung Cancer20106927227820022659
- AnSJChenZHSuJIdentification of enriched driver gene alterations in subgroups of non-small cell lung cancer patients based on histology and smoking statusPLoS One20127e4010922768234
- SunJMHwangDWAhnJSAhnMJParkKPrognostic and predictive value of KRAS mutations in advanced non-small cell lung cancerPLoS One201385e6481623724098
- CarboneDPDingKRoderHPrognostic and predictive role of the VeriStrat plasma test in patients with advanced non-small-cell lung cancer treated with erlotinib or placebo in the NCIC Clinical Trials Group BR.21 trialJ Thorac Oncol20127111653166023059783
- MilanELazzariCAnandSSAA1 is over-expressed in plasma of non small cell lung cancer patients with poor outcome after treatment with epidermal growth factor receptor tyrosine-kinase inhibitorsJ Proteomics2012129110122771314