Abstract
Purpose
The aim of this study was to quantify the displacement of cardiac substructures, including the anterior myocardial territory (AMT), left ventricle, and coronary arteries during a normal cardiac cycle.
Materials and methods
Computed tomography (CT) images with retrospective electrocardiographic gating of 17 eligible patients were obtained. All images were reconstructed automatically for the end-diastolic and end-systolic phases. CT scanning without contrast at a random phase and a selected vertebral body were used as references to measure three-dimensionaldisplacements of the cardiac substructures.
Results
The displacement between the end-diastolic and end-systolic phases (Dd-s) was greater than that between the end-systolic and random phases and between the end-diastolic and random cardiac phases. The largest displacements for the heart were in the left, posterior, and inferior directions with an average Dd-s of approximately 4–6 mm. The average Dd-s for the AMT and left ventricle was 1.2–2.7 mm in the anterior and right directions, 4.3–7.8 mm in left and posterior directions, and 4.9–6.3 mm in superior and inferior directions. For the coronary arteries, the average Dd-s was 2.8–5.9 mm in the anterior-posterior direction, 3.5–6.6 mm in left-right direction, and 3.8–5.3 mm in the superior-inferior direction. Inter-observer agreement was excellent for the heart, AMT, and left ventricle (kappa coefficient, >0.75 for all) and good for most coronary arteries in three dimensions (kappa coefficient, 0.511–0.687). The Dd-s did not differ significantly between men and women.
Conclusion
Most average displacements of the cardiac substructures and coronary arteries were 3–8 mm in three dimensions. These findings will be useful to accurately estimate the radiation dose to cardiac substructures during thoracic radiation and to evaluate the risk of radiation-related heart disease.
Introduction
Radiation-related heart disease, appearing as a late toxicity following thoracic radiotherapy (RT), is increasingly becoming a concernCitation1–Citation5 and should not be disregarded, especially in patients with curable malignancies such as breast cancer and Hodgkin lymphoma. There may be a heterogeneous biological response to radiation among cardiac substructures such as the myocardium, coronary arteries, pericardium, and cardiac conduction systems.Citation2 Pathologically, radiation-related heart disease includes radiation-induced pericarditis, pericardial and myocardial fibrosis, vascular disease, valvular disease, and conduction system abnormalities though they are much less common than in the past due to the improvements and modifications in RT techniques.Citation2 Long-term follow-up studies of patients with breast cancer who received RT indicated that ischemic heart disease is the most common cause of cardiac mortalityCitation6 and morbidity.Citation7,Citation8 Theoretically, both the microvascular and macrovascular radiation-related cardiac damage could combine to cause ischemic heart disease.Citation2
The risk of radiation-related heart disease is likely related to both the radiation dose and the irradiated volume.Citation4 Clinically however, the heart is generally considered a whole organ at risk during thoracic RT,Citation4 whereby possible heterogeneity in the radiobiological response of various substructures is not taken into consideration. In previous studies,Citation9,Citation10 we specifically defined the anterior part of the heart as the anterior myocardial territory (AMT). We have shown that the AMT can replace the heart as an independent cardiac substructure, with the aim of decreasing the cardiac radiation dose during breast intensity-modulated RT. According to our definition, the AMT includes several cardiac substructures such as the anterior parts of the myocardial muscles and the coronary arteries in the anterior portion of the heart.
Previous studies have not effectively evaluated the impact of the motion of the heart and its substructures on the estimation of the cardiac radiation dose.Citation6–Citation8 Therefore, a quantitative analysis of the displacement of cardiac substructures will probably benefit the estimation of the radiation dose to these structures during thoracic RT. To date, however, data on the displacement of cardiac substructures are limited, although three-dimensional cardiac displacements have been measured in some studies.Citation11–Citation16 In these studies, some cardiac displacements were measured during breath control.Citation13–Citation16 The heart was treated as a single organCitation14–Citation16 and the displacements of the left anterior descending arteryCitation12–Citation15 were measured. Leter et al measured the displacement of coronary artery stents during a cardiac cycle.Citation12 There was a weakness that those subjects with stents had coronary artery disease and it was therefore not representative of the normal population.
To the best of our knowledge, there is no report in the literature on the displacement of the other cardiac substructures such as the AMT, left ventricle, and coronary arteries (including the left main coronary artery, right main coronary artery, left circumflex artery, and right marginal artery). Therefore, the purpose of this study was to quantify the three-dimensional displacements of cardiac substructures as independent regions of interest during a normal cardiac cycle. We believe this will lead to a more accurate estimation of the risk of radiation-related heart disease.
Methods and materials
Imaging acquisition and reconstruction
The ethical committee of Zhongnan Hospital, Wuhan University approved this retrospective study. From the Zhongnan Hospital Department of Radiology database, we selected computed topography (CT) images of 17 patients who had undergone multi-slice CT-based coronary angiography with retrospective electrocardiographic (ECG) gating between February 2010 and July 2012. We also collected the patients’ demographic and ultrasound cardiography data (performed as our routine clinical protocol) from the medical records. All patients had suspected heart disease with no history of cardiac disease, hypertension, or cardiac risk factors; and a normal baseline electrocardiogram. Eligible candidates were 18 to 70 years of age and had a heart rate of 60–100 beats per minute, with a regular rhythm. An average adult heart measures 12 cm from the base to apex, 8–9 cm at its broadest transverse diameter, and 6 cm anteroposteriorly;Citation17 only patients with measurements of less than 15 cm, 12 cm, and 9 cm for these three parameters, respectively, were included in this study. On CT imaging, all cardiac substructures were clearly visible and the coronary arteries had no obvious artefacts that could have affected the measurements. Patients with a history of heart disease that could affect the motion and volume of the heart were excluded. These conditions included heart failure, hypertension, myocardial infarction, valvular heart disease, and pericardial or myocardial disease. Patients with disease in the mediastinum, right and/or left lung or chest wall, or in the upper abdomen, that might influence the motion of the heart and coronary arteries and the volume of cardiac substructures were also excluded from the study. Overall, all aforementioned inclusion and exclusion criteria were employed to minimize any potential factors that could affect the accurate measurement of the cardiac substructures and coronary arteries, thus guaranteeing the most accurate representation of measurements for a normal population.
Before CT image acquisition, each patient provided written consent. All patients underwent two sets of cardiac CT scans with a dual-source 64-slice scanner (SOMATOM, Siemens Medical Solutions, Forchheim, Germany). The first set was an ECG-gated step-and-shoot scan, with slices of 2.5 mm obtained from the apex of the lungs to the adrenal glands without contrast agent. We used these images, acquired during a random cardiac phase, as a reference, because this setup is similar to that used for simulation of thoracic radiation, in which the cardiac phase and position is not considered. The second scan was a contrast-enhanced ECG, with slices of 0.625 mm obtained from the carina to the bottom edge of the heart. Contrast agent (Ioversol injection; Jiangsu Hengrui Medicine Co, Ltd, Lianyunguang, People’s Republic of China) was intravenously injected at 1.25 mL/kg of body weight; this was followed by a saline flush of 50 mL at a flow rate of 5 mL/s. Image acquisition was performed 20–22 s immediately after injection of the contrast agent, in accordance with our routine protocol. Images for each patient were automatically reconstructed using the end-diastolic and end-systolic CT data sets acquired over the course of a single cardiac cycle.
Definition of cardiac substructures and coronary arteries
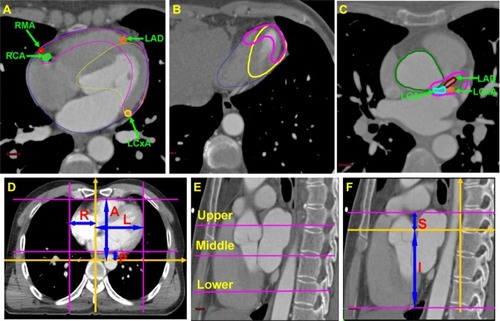
We have previously reported detailed definitions of the heart, AMT, and left ventricle.Citation9,Citation10 Briefly, the heart includes all visible myocardium and excludes large vessels ( and ). The left ventricle was defined as the visible myocardium, according to both a CT scan and the cardiac anatomy. The interventricular septum was also included in the left ventricle ( and ). The AMTCitation9,Citation10 comprised the myocardium from the anterior surface of the heart up to 1.0 cm posteriorly and the main branches of the coronary arteries at the anterior portion of the heart, such as the left anterior descending artery, left circumflex artery, and right marginal artery as well as the left and right main coronary arteries (–). The left and right main coronary arteries were defined from their origin in the aortic sinus to the first branches ( and ). The left anterior descending artery, left circumflex artery, and right marginal artery were defined from where they branched at the left or right main coronary artery to the caudal edge of the endocardial surface of the left ventricle ( and ).
Figure 1 Definitions of cardiac sub-structures and coronary arteries.
Abbreviations: LCA, left main coronary artery; RCA, right main coronary artery; LAD, left anterior descending artery; LCxA, left circumflex artery; RMA, right marginal artery; L, left; R, right; A, anterior; P, posterior; S, superior; I, inferior.
Calculation of the displacement
We calculated the displacement of the heart, AMT, and left ventricle in the anterior, posterior, left, right, superior, and inferior directions ( and ). Two independent cardiac radiologists from our facility performed all measurements at our imaging workstation. For accuracy, we established a rectangular plane coordinate system (). The horizontal axis was positioned at the front edge of the vertebral body and the vertical axis was positioned at the midline, using the spine as a stable reference. For displacements in a given direction, we measured the greatest perpendicular distance between the cardiac margin and the coordinate axis in the same image plane for the random cardiac phase (Dr), end-diastolic phase (Dd), and end-systolic phase (Ds) ( and ). Displacement was calculated using the following formula: displacement = |Dd – Ds|, |Dd – Dr|, or |Ds – Dr|. Similarly, to measure displacement in the superior and inferior directions, a reconstructed maximal sagittal plane was used. Another coordinate system was established (), in which the horizontal axis was positioned at the cranial edge of the sixth vertebrate body and the vertical axis was positioned at the front edge of the vertebrate body. Thus, the Dr, Dd, and Ds could be measured during the three different phases and displacements in the superior and inferior directions could be calculated.
Physiologic motion differs among cardiac structures. Therefore, we selected three different axial image planes of the heart to measure displacements in the anterior, posterior, left, and right directions (). The upper, middle, and lower axial planes were at the caudal edge of the left main coronary artery (originating from the left aortic sinus), the mitral valve, and the endocardial surface of the left ventricle, respectively. For the heart, we measured displacements along the aforementioned three planes, and for the AMT and left ventricle, we measured only displacements along the middle axial plane. For the AMT and left ventricle, we measured the greatest perpendicular distance from the horizontal and vertical axes ( and ). For the coronary arteries, we obtained measurements from the center of a single cross-sectional area. Therefore, only anterior–posterior, left–right, and superior–inferior displacements were measured. We then measured the displacements from the center of mass along the axial plane of the left or right main coronary artery. However, the left anterior descending artery, left circumflex artery, and right marginal artery vary in length and direction. Therefore, we measured their displacements at their most anterior locations on the sagittal plane. To measure displacements in the superior and inferior directions, we first determined the planes as previously discussed, and then measured the maximal vertical distance from the horizontal axial plane during the three phases.
Statistical analysis
Cohen’s kappa coefficient was used to estimate the variation in Dd-s values as measured independently by two radiologists. The Mann–Whitney U test was used to analyze the difference in Dd-s between male and female patients. Statistical analyses were performed on a personal computer using SPSS v.21.0 (IBM Corporation, Armonk, NY, USA). Differences were considered statistically significant at P-values < 0.05.
Results
Demographic characteristics of the patients
Of the patients admitted to our department between February 2010 and July 2012, 17 eligible patients were included in our study to quantify the displacements of cardiac substructures and coronary arteries. Of these patients, ten were male and seven were female, with a median age of 49 years (range, 36–64 years). The average heart rate was 68 ± 3.2 beats per minute (range, 61–84 beats per minute) and the average body mass index was 22.3 ± 3.6 (range, 17.6–25.2). All displacements of the heart, AMT, left ventricle, left anterior descending artery, and left and right main coronary arteries were successfully measured in all directions. One displacement of the left circumflex artery in the superior–inferior direction and one displacement of the right marginal artery in each of the left–right and superior–inferior directions failed because of a slight artefact that could affect the accuracy of our measurements.
Imaging techniques and measurements
Fifteen patients underwent both CT and ultrasound cardiography; the median interval between two cardiac examinations was 1.5 days (range: 0–5 days). The end-diastolic and end-systolic volumes were 95.7 ± 18.9 cm3 and 43.6 ± 12.8 cm3, respectively, for the left ventricle. For the right ventricle, those volumes were 112.7 ± 24.1 cm3 and 48.3 ± 16.7 cm3, respectively. The average left ventricular ejection fraction was 55.2% ± 8.7%. The average thicknesses of the interventricular septum and the posterior wall of the left ventricle were 9.2 ± 2.1 mm and 8.6 ± 1.8 mm, respectively.
Displacements during the random, end-diastolic, and end-systolic phases
The cardiac volume during the random phase was 382.6 ± 54.9 cm3 (95% confidence interval [CI], 275.0–589.6 cm3). When the distance between two consecutive R waves on an ECG was considered to represent 100% of a single cardiac cycle, the end-systolic phase was defined at 39.0% ± 5.7% (95% CI, 30.0–47.0%) and the end-diastolic phase was defined at 73.2% ± 2.0% (95% CI, 69.0%–76.0%).
Generally, the displacement between the end-diastolic and end-systolic phases (Dd-s) was larger than that between the random and end-systolic phases (Dr-s) and that between the random and end-diastolic phases (Dr-d). In addition, Dr-s was greater than Dr-d ( and ).
Table 1 The displacements in the anterior, posterior, left, and right direction of the heart, AMT, and LV
Table 2 Displacements of the coronary arteries
End-diastolic and end-systolic phases for the heart
Displacements of the heart were asymmetrical. In most directions, displacement of the upper part of the heart was smaller than that of the lower part of the heart. In the anterior, posterior, left, and right directions, the average Dd-s was approximately 2–4 mm and 2–6 mm for the upper and lower parts, respectively (). Displacements in the left, posterior, and inferior directions were greater, and the mean Dd-s was 5–6 mm (). However, the average Dd-s for the anterior, right, and superior directions was 2–3 mm (). For the middle part of the heart, the average Dd-s in the anterior, posterior, left, and right directions was 2–4 mm (). The mean Dd-s in the superior and inferior directions was 3.0 ± 2.8 mm (95% CI, 0.2–9.8 mm) and 4.5 ± 2.7 mm (95% CI, 1.5–8.6 mm), respectively.
End-diastolic and end-systolic phases for the AMT and left ventricle
The average Dd-s for the AMT and left ventricle in the anterior and right directions was approximately 3.0–5.0 mm (). In the left and posterior directions, the average Dd-s was approximately 5.0–8.0 mm (). The Dd-s in the superior and inferior directions was 5.0 ± 1.7 mm (95% CI, 2.4–8.4 mm) and 6.0 ± 3.6 mm (95% CI, 0.3–10.3 mm), respectively, for the AMT and 6.0 ± 2.1 mm (95% CI, 3.4–10.7 mm) and 6.1 ± 4.6 mm (95% CI, 0.7–14.8 mm), respectively, for the left ventricle.
End-diastolic and end-systolic phases for the coronary arteries
The average Dd-s for the right main coronary artery (4.5–6.2 mm) was greater than that for the left main coronary artery (3.9–4.5 mm) in the anterior-posterior, superior-inferior, and left-right directions (). The average Dd-s for the left anterior descending artery, left circumflex artery, and right marginal artery was 3.7–4.0, 3.7–6.6, and 4.7–5.9 mm in the anterior –posterior, left–right, and superior–inferior directions, respectively ().
Interobserver agreement for end-diastolic and end-systolic phases
Cohen’s kappa coefficient was used as a measure of interrater agreement, which is usually characterized as excellent for a kappa coefficient of >0.75, fair to good for coefficients between 0.40 and 0.75, and poor for values of <0.40.Citation18 For the heart, AMT, and left ventricle, all kappa coefficients for Dd-s in all directions were greater than 0.75. The kappa coefficients for the left anterior descending artery and left and right main coronary arteries in the anterior–posterior direction and for the main coronary artery in the left–right direction were also greater than 0.75. However, these values ranged from 0.511 to 0.687 for the other coronary arteries and directions (). In addition, Dd-s did not differ significantly between male and female patients.
Table 3 Dd-s of coronary arteries in three-dimensional directions
Discussion
In our study, we found that cardiac motion was asymmetrical and that the greatest displacements were observed in the left, posterior, and inferior directions. Average displacements of most of the cardiac substructures between the end-diastolic and end-systolic phases ranged from 3–8 mm in most directions. During free breathing, the heart displacement was 10–15 mm in all three dimensions.Citation16 If the displacements in the anterior and posterior, left and right, and superior and inferior directions were individually summed and these values were assumed to be the displacements in the anterior–posterior, left–right, and superior–inferior directions, respectively, the cardiac displacements recorded in our study would range from 6–10 mm, which is less than that previously reported.Citation16 One possible reason for this discrepancy is that we used a different method of measurement in this study. Furthermore, we measured the displacement of each heart wall and did not account for the internal volume changes within the atrium or ventricle over the course of the cardiac cycle. We believe that it is more important to minimize the incidental radiation dose to the substructures in the heart wall to decrease cardiac toxicity.
Several studies have examined the motion of the coronary artery using different measurement methods during a cardiac cycle. Leter et alCitation12 measured the displacement of coronary artery stents using ECG-gated CT scanning and showed an approximate maximal displacement of 7–9 mm in three dimensions (7.5 mm in the left–right direction, 8.6 mm in the anterior–posterior direction, and 8.2 mm in the superior–inferior direction). The displacements of the right main coronary artery ranged from 5 to 7 mm and those of the other coronary arteries ranged from 4 to 6 mm in our study. The size of the heart itself may be associated with the amplitude of cardiac motion. Cardiac volume during the random phase in our study (382 cm3) was much smaller than that reported by Leter et al (the heart volume was 740 cm3 in their study).Citation12 The results of the present study also showed that displacements of the right main coronary artery were greater than those of the left main coronary artery. This is likely because the right main coronary artery covers a longer distance beneath the subepicardium than the left main coronary artery.
The motion of the left anterior descending artery was of note, as it emerged mainly into the atrioventricular groove. Several studiesCitation13–Citation15 have shown that displacements, in all directions, of the left anterior descending artery ranged from 3–6 mm during breath control. We showed that the displacement of the left anterior descending artery, in all directions, during free breathing was approximately 4–6 mm. We strongly believe that these measurements of the displacement of cardiac substructures will provide useful information for the accurate estimation of radiation doses to these substructures during thoracic radiation.
Cardiac motion during thoracic RT has two effects. First, the image is blurred over time and space corresponding to a single slice on planning CT and is distorted because of the relative speed of motion and scanning.Citation19 How to correct the effect on image quality was beyond the scope of this study. Second, another important source of uncertainty arises as a result of organ motion, including cardiac motion. Such motion can affect the distribution of the radiation dose and thus result in a variation between the planned and delivered doses.Citation19 In a previous study, uncertainties arising from cardiac motion were not taken into account when estimating the radiation dose to the heart, and therefore, the risk of radiation-related heart disease may not have been accurately evaluated.Citation4 Characterization of additional margins for some critical normal tissues has been recommended for studies of this type to establish the planned risk volume.Citation19 Moreover, if systemic (Σ) and random errors (σ) are accurately measured, the margins for small and/or serial organs, such as cardiac substructures and/or coronary arteries, can be easily calculated using the following formula: 1.3 * Σ + 0.5 * σ.Citation20 Therefore, these data on cardiac displacements can be used effectively to estimate systemic and random errors. Additionally, these data can be used to calculate the margins for critical cardiac structures, which will contribute to improved safety of RT and the accuracy of radiation dose estimates for cardiac substructures and coronary arteries.
Radiation doses to the heart are significantly lower with three-dimensional RT than with previously performed two-dimensional RT.Citation5 This may be due to a variety of reasons such as changes in target volume definition, use of advanced radiation techniques, and awareness of potential problems regarding radiation-related heart disease.Citation5 Although there is no consensus on the dose-volume data for the estimation of the risk of radiation-related heart disease, it is advisable to minimize the incidental radiation dose to cardiac substructures. Furthermore, more accurate estimations and documentation of dose exposure to cardiac substructures may help us to better understand the actual tolerances of cardiac substructures in terms of long-term radiation-related heart disease. We believe that increased knowledge regarding the displacement of cardiac substructures will contribute to our understanding of this issue.
Our study has a few limitations. First, observer uncertainties could not be avoided, especially in the case of non-contrast CT imaging. Second, displacement information at a single arterial cross-section is difficult and thus may fail to accurately and completely reflect the three-dimensional motion of an entire coronary artery. Third, displacement measurements between end-diastolic and end-systolic phases (Dd-s) might overestimate the overall cardiac displacement, because the likelihood that the heart will be exactly between these particular positions during CT simulation is extremely low. Finally, all data derived from ECG-gated CT angiography were associated with unavoidable biases. In particular, when extrapolating the displacements of cardiac substructures and coronary arteries during thoracic RT, biases can arise from several inherent factors, including patient selection bias and differing arm positions or contrast-enhanced CT scanning methods between CT angiography and planning CT before thoracic radiation. In addition, the thoracic tumor and cardiac comorbidities, such as myocardial infarction and congestive heart failure, may themselves influence the motion of cardiac substructures. Therefore, the effect of heart motion on the dose distribution to cardiac substructures during radiotherapy should be individualized. However, despite these limitations, our findings will provide practical information for further study of radiation-related heart disease.
Conclusion
For most of the three-dimensional directions measured in this study, average displacements of cardiac substructures, including the heart, AMT, left ventricle, and the coronary arteries, ranged from 3 to 8 mm between the end-diastolic and end-systolic phases. The greatest cardiac motion was observed in the left, posterior, and inferior directions. These findings will be useful for the accurate estimation of the radiation dose to cardiac substructures and for gaining better understanding of the risk of radiation-related heart disease. The use of advanced radiation techniques such as multimodal image-guided radiotherapy, dose accumulation in all radiation fractions, and the combined use of various breath control techniques, will benefit the accurate estimation of radiation doses to cardiac substructures. These advanced techniques need further investigation.
Acknowledgments
This research was financially supported by the Hubei Nature Science Funding (2012FFB01702) and Hubei Health Funding (JX6B25). The funders had no role in study design, data collection and analysis, decision to publish, or preparation of the manuscript.
Disclosure
The authors report no conflicts of interest in this work.
References
- Schultz-HectorSTrottKRRadiation-induced cardiovascular diseases: is the epidemiologic evidence compatible with the radiobiologic data?Int J Radiat Oncol Biol Phys2007671101817189062
- DarbySCCutterDJBoermaMRadiation-related heart disease: current knowledge and future prospectsInt J Radiat Oncol Biol Phys201076365666520159360
- AndratschkeNMaurerJMollsMLate radiation-induced heart disease after radiotherapy. Clinical importance, radiobiological mechanisms and strategies of preventionRadiother Oncol2011100216016620826032
- GagliardiGConstineLSMoiseenkoVRadiation dose-volume effects in the heartInt J Radiat Oncol Biol Phys201076Suppl 3S77S8520171522
- SardaroAPetruzzelliMFD’ErricoMPRadiation-induced cardiac damage in early left breast cancer patients: Risk factors, biological mechanisms, radiobiology, and dosimetric constraintsRadiother Oncol2012103213314222391054
- DarbySCMcGalePTaylorCWLong-term mortality from heart disease and lung cancer after radiotherapy for early breast cancer: prospective cohort study of about 300,000 women in US SEER cancer registriesLancet Oncol20056855756516054566
- PattDAGoodwinJSKuoYFCardiac morbidity of adjuvant radiotherapy for breast cancerJ Clin Oncol200523307475748216157933
- DarbySCEwertzMMcGalePRisk of ischemic heart disease in women after radiotherapy for breast cancerN Engl J Med20133681198799823484825
- TanWLiuDXueCAnterior myocardial territory may replace the heart as organ at risk in intensity-modulated radiotherapy for left-sided breast cancerInt J Radiat Oncol Biol Phys20128251689169721621342
- TanWWangXQiuDDosimetric comparison of intensity-modulated radiotherapy plans, with or without anterior myocardial territory and left ventricle as organs at risk, in early-stage left-sided breast cancer patientsInt J Radiat Oncol Biol Phys20118151544155121470785
- YamadaKSoejimaTMinamiTThree-dimensional treatment planning using electrocardiographically gated multi-detector row CTInt J Radiat Oncol Biol Phys200356123523912694844
- LeterEMNowakPJNiemanKDefinition of a moving gross target volume for stereotactic radiation therapy of stented coronary arteriesInt J Radiat Oncol Biol Phys200252256056511872305
- JagsiRMoranJMKesslerMLMarshRBRespiratory motion of the heart and positional reproducibility under active breathing controlInt J Radiat Oncol Biol Phys200768125325817448878
- WangXPanTPinnixCCardiac motion during deep-inspiration breath-hold: implications for breast cancer radiotherapyInt J Radiat Oncol Biol Phys201228270871421444161
- McIntoshAShoushtariANBenedictSHQuantifying the reproducibility of heart position during treatment and corresponding delivered heart dose in voluntary deep inhalation breath hold for left breast cancer patients treated with external beam radiotherapyInt J Radiat Oncol Biol Phys2011814e569e57621531087
- WangZWillettCGYinFFReduction of organ motion by combined cardiac gating and respiratory gatingInt J Radiat Oncol Biol Phys200768125926617321071
- JohnPHeart and mediastinum: Heart and great vesselsSuanSGray’s Anatomy39th edElsevier20089951020
- FleissJLStatistical methods for rates and proportions2nd edNew YorkJohn Wiley1981
- van HerkMErrors and margins in radiotherapySemin in Radiat Oncol20041415264
- McKenzieAvan HerkMMijnheerBMargins for geometric uncertainty around organs at risk in radiotherapyRadiother Oncol200262329930712175561