Abstract
Purpose
The expression of an array of signaling molecules, along with the assessment of real-time cell proliferation, has been performed in U87 glioma cell line and in patients’ glioblastoma established cell cultures in order to provide a better understanding of cellular and molecular events involved in glioblastoma pathogenesis. Experimental therapy was performed using a phosphatidylinositol-3′-kinase (PI3K) inhibitor.
Patients and methods
xMAP technology was employed to assess expression levels of several signal transduction molecules and real-time xCELLigence platform for cell behavior.
Results
PI3K inhibition induced the most significant effects on global signaling pathways in patient-derived cell cultures, especially on members of the mitogen-activated protein-kinase family, P70S6 serine-threonine kinase, and cAMP response element-binding protein expression and further prevented tumor cell proliferation.
Conclusion
The PI3K pathway might be a prime target for glioblastoma treatment.
Introduction
Intracranial tumors represent a heterogeneous group of neoplasms that appear to underlie distinct patterns of growth, invasion, response to therapy, and prognosis.Citation1,Citation2 Glioblastoma (GB) is one of the most frequently occurring tumors in the central nervous system and the most lethal brain tumor type in adults.Citation3,Citation4 Despite the progress in surgery and radiotherapy, and the addition of temozolomide,Citation5 the prognosis of glioma patients remains poor.Citation6 Among the reasons for therapy failure are therapeutic resistance and frequent recurrence, together with the migratory phenotype and persistence of tumor cancer-initiating stem cells.Citation7,Citation8 Although the initial transforming event(s) remain elusive, the progression of brain tumors has been associated with multiple signaling alterations, which were postulated to confer survival and proliferation advantages.Citation9
Studies regarding glioblastoma pathogenesis point out its molecular complexity; thus, conventional biochemical methods (eg, Western blot, enzyme-linked immunosorbent assay) can overlook critical components and/or signaling profiles of this devastating disease. It has been hypothesized that the combined influence of many genes or biomarkers would make superior identifiers and/or predictors of tumor behavior and patient outcome.Citation10 Mechanistic links of different signaling pathways are still to be uncovered and appear to depend on the cell type. Acknowledging the possibility of having multiple signaling connections, high throughput proteomic profiling is becoming an important approach in cancer research. Moreover, the currently available multiplex analysis, such as xMAP and protein array technologies, offers good premises for human brain tumor research. These technologies may provide simultaneous analysis of a panel of signaling molecules, for improved diagnosis, patient stratification, prognosis, and drug screening. Biomarker discovery for brain tumors is an ongoing pursuit, and the search for the best molecule or combination of molecules is unfolding.Citation11–Citation14
The investigation of molecular mechanisms underlying the behavior of glioblastoma (including their aggressiveness and therapeutic resistance) goes hand in hand with the discovery and development of new inhibitors targeting key actors, such as protein tyrosine kinases.Citation15,Citation16 Reported deregulations of phosphatidylinositol-3-kinase/protein kinase B/mammalian target of rapamycin (PI3K/Akt/mTOR) signaling often represent the results of receptor tyrosine kinase overactivity (involving epidermal growth factor receptor, platelet-derived growth factor receptor, mesenchymal-epithelial transition factor), mutated PI3K subunits, and/or loss of phosphatase and tensin homolog (PTEN) tumor suppressor activity.Citation17 Not only do more than 40% of glioblastoma exhibit a loss of PTEN, which results in excessive PI3K signaling, but a significant number of glioblastoma tumors exhibit functional inactivation of PTEN by post-translational modifications, such as phosphorylation at Y240 and others.Citation17
From the perspective of personalized medicine, assessing signaling deregulation would best benefit from the study of glioblastoma cell cultures established from patient tumors. Hence, patient-derived cell cultures provide the ideal setup to generate results focusing on tumor biology and/or new therapeutic approaches.Citation18
In the present study, we have investigated the expression patterns of several signal transduction molecules in glioblastoma cells using multiplex assay, both in basal conditions and under kinase inhibitor treatment, targeting key signaling molecules. As we have been seeking possible future therapy targets, we have analyzed the midterm effect of inhibitors on signal transduction molecules. We considered it relevant to assess in parallel these patterns in patient-derived cell cultures and standard glioblastoma cell line U87. Furthermore, we have searched for subsequent functional cellular behavior by real-time investigation of cell proliferation, using the xCELLigence approach.
Materials and methods
Ethical conduct of research
The authors state that they have obtained appropriate institutional review board approval from the Ethics Committee of Victor Babes National Institute of Pathology and the Ethics Committee of Neurology and Neurovascular Diseases National Institute, Bucharest, Romania and have followed the principles outlined in the Declaration of Helsinki for all human experimental investigations. In addition, for investigations involving human subjects, informed consent has been obtained from the participants involved.
Samples, cell cultures, and treatments
Samples were collected from 17 patients diagnosed with Stage IV glioma (glioblastoma) undergoing surgery at Neurology and Neurovascular Diseases National Institute, Bucharest, Romania. Patients’ written informed consents were obtained, in accordance with ethical standards included in the current revision of the Declaration of Helsinki.
Paired tumoral and peritumoral tissue samples from all patients were subjected to xMAP analysis for the expression of signal transduction molecules. Tumoral samples from nine cases were processed for cell culture initiation. Each tumor sample was mechanically triturated in cell culture medium and then incubated in enzymatic cocktail solution of collage-nase I 0.25 mg/mL and trypsin 0.6 mg/mL (Sigma-Aldrich, St Louis, MO, USA) for 30 minutes, with gentle stirring, at 37°C. The supernatant was collected and centrifuged for 10 minutes at 250 ×g, then the pellet was resuspended in cell culture medium and passed through a 40 μm mesh. Viability was measured by Trypan blue method (Trypan 0.4%); cells were then seeded at 104 cells/cm2 density and maintained in culture in 5% CO2 atmosphere and 37°C. After 24 hours, the medium was replaced. Cell propagation was then performed in Dulbecco’s Modified Eagle Medium: Nutrient Mixture F-12 supplemented with 10% fetal bovine serum and 1% penicillin-streptomycin (Sigma-Aldrich) for several passages and monitored for morphological features (by light microscopy) and surface markers: glial fibrillary acidic protein (GFAP); Nestin; and Notch receptors (by immunofluorescence).
Out of the nine cases, seven cell cultures were successfully initiated, two of them maintaining similar morphological features beyond Passage 2; therefore, they were used in further experiments, herein presented as Case A and Case B. For Case B, in some of the real-time assays, cells obtained from the relapse of the original tumor were also studied. No adjuvant therapies (neither radiotherapy nor chemotherapy) were performed on this patient between the two surgical interventions. The mentioned cases were selected to be the best performers in terms of proliferation rates. The reason for our choice was both the need to match U87 proliferation rate and generation from one passage of sufficient cells to obtain a satisfactory cell lysate in terms of total protein concentration to cover all the experimental approaches.
Standard cell line: U87 cells have been purchased from ATCC (Austin, TX, USA) and maintained in culture according to manufacturer’s recommendations: Eagle’s Minimum Essential Medium supplemented with 10% fetal bovine serum (both from ATCC) and 1% antibiotic (Life Technologies, Carlsbad, CA, USA). Cells were cultivated in 5% CO2 humidified atmosphere at 37°C. For maintenance purposes, two to three media changes were required weekly. Culture passages were performed by trypsin-EDTA (Life Technologies) treatment according to the original recommendations of the supplier (ATCC).
Immunofluorescence
Nestin and GFAP expression in cultured cells were investigated by immunofluorescence, according to a modified protocol.Citation19 Anti-GFAP primary antibody was incubated for 2 hours at room temperature, using a rabbit polyclonal IgG (Sigma-Aldrich, G9269; 1:50), followed by detection with Alexa Fluor 488 conjugated goat antirabbit secondary antibody (Life Technologies, A31628; 1:300). For Nestin, we used a mouse monoclonal IgG1 antibody (Santa Cruz Biotechnology, Dallas, TX, USA, SC-23927; 1:50); followed by detection with Alexa Fluor 594 conjugated goat antimouse secondary antibody (Life Technologies, A31624; 1:300). Counterstain for nuclei was performed with 4′,6-diamidino-2-phenylindole (Life Technologies, D1306). Examination was carried out using a Nikon TE300 microscope (Nikon Instruments, Melville, NY, USA) with appropriate fluorescence settings.
Assessment of signal transduction molecules using xMAP analysis
The expression of signal transduction molecules was performed on patient tumoral/peritumoral tissue and on patient-derived and U87 cell cultures.
U87 glioblastoma cells and patient-derived cells were seeded in six-well plates at 90,000 cells/well for the evaluation of protein expression of signal transduction molecules. All experiments were performed in triplicate. After 12 hours, the culture medium was replaced with inhibitor-containing cell media, and further cultivated in standard condition for 24 more hours. The following conditions were examined: untreated cells (control) and treated cells with pharmacological inhibitors, namely PI3K inhibitor LY294002 25 μM, MEK-1 inhibitor PD98059 25 μM, MEK inhibitor U0126 10 μM, and p38 inhibitor SB203580 10 μM. After 24 hours’ incubation with inhibitors, cells were rinsed twice with cold PBS and lysed with lysis buffer provided by the xMAP kit manufacturer. Total protein concentration was assessed by Bradford assay (Sigma-Aldrich).
Multiplex analysis was performed on a Luminex® 200™ platform (Luminexcorp, Austin, TX, USA), using Cell Buffer and Detection Kit and Milliplex MAPmates for total proteins: ERK (extracellular signal-regulated kinases) 1/2, JNK, P70S6K, IκBα, p38, cAMP response element-binding protein (CREB), and glyceraldehyde 3-phosphate dehydrogenase (GAPDH; EMD Millipore, Billerica, MA, USA). Briefly, xMAP technology is based on a sandwich-type immunoassay for the detection and quantification of analytes of interest. Capture monoclonal antibodies are covalently immobilized on polystyrene microspheres (beads) of 50 nm or 60 nm diameter, loaded with precise concentrations of two fluorophores; their ratio generates a spectral address, unique for each bead class. The beads in each class are covered with a single type of capture antibody, thus providing the specificity for the analytes. A mixture of beads is incubated with the samples, resulting in the binding of analytes to their corresponding beads, via the capture antibodies on their surface. Biotinylated detection antibodies will bind to a second epitope of the captured analytes. Streptavidin conjugated phycoerythrin is used as a reporter molecule, upon measurement on a flow-cytometric device, which reports and correlates phycoerythrin fluorescence to each bead class.
Cell lysis and sample preparation for multiplex protein detection were performed according to manufacturer instructions (EMD Millipore). GAPDH was used as an internal standard for data normalization. Data measurement was performed using the Luminex 200 software; data acquisition and analysis were performed using STarStation 2.3 (AppliedCytometry, Sheffield, UK).
Assessment of MEK inhibition by MEK inhibitors U0126 and PD98059 effects on phosphorylation of ERK 1/2 was performed on lysates of U87 cell cultures, using Milliplex 8-plex Multi-Pathway Signaling Kit (M8MP kit, EMD Millipore) for phosphoprotein, according to the manufacturer’s instructions. Cell lysis was performed after 1 hour of exposure to inhibitors, in the lysis buffer from the M8MP kit. According to the manufacturer’s protocol, total GAPDH was used for data normalization. Data measurement was performed using the Luminex 200 software; data acquisition and analysis were performed using STarStation 2.3.
Real-time cell monitoring using xCELLigence platform
Briefly, the xCELLigence system measures electrical impedance of culture cells across interdigitated microelectrodes integrated on the bottom of specially designed culture plates. Through this system, cellular events are monitored in real time without any labeling incorporation. The impedance measurement provides quantitative information about the biological status of the cells, including cell number, adhesion, and viability. Electrode impedance changes, automatically displayed as Cell Index, were used to monitor cell viability, number, proliferation, and adhesion.
Both patient-derived cultures and U87 cell line were treated with kinase inhibitors (purchased from Promega, Madison, WI, USA), as follows: LY294002, 25 μM; PD98059, 25 μM; U0126, 10 μM; and SB203580, 10 μM. The inhibitors were solubilized in dimethyl sulfoxide (DMSO), which was also added to the control vehicle (1:400). Starting concentrations for experiments were chosen based on similar approaches in literature.Citation20–Citation24
The tests were performed on E-16 plates (Roche Diagnostics Corporation, Indianapolis, IN, USA; catalog number 05469830001), compatible with RCTA-DP system (Roche Diagnostics Corporation), which are basically 16-well plates covered on the bottom with sensor electrodes capable of reading modification of electric resistivity induced by cell adhesion. Each well was coated with collagen I (Sigma-Aldrich C7661) 5 μg/mL in 0.1M NaHCO3, for 1 hour at 37°C, except for the wells used as negative control. To each well, 5,000–10,000 previously serum-starved cells were added in complete cell media and left to adhere for 2 hours in the RTCA DP device at 37°C and 5% CO2. Kinase inhibitors were added to appropriate concentration, and readings were recorded for 24 hours or more in order to quantify cell proliferation. Controls were incubated with vehicle containing 1/400 DMSO, to match the reconstituted kinase inhibitors solutions. Each well was duplicated or quadruplicated, and each experiment was performed three times.
Western blot
U87 cells were lysed in a buffer containing 2% Triton-X100 and 2% NP-40, 10% protease inhibitors cocktail (Sigma-Aldrich), and 2 mM sodium orthovanadate. Volumes containing the same amount of protein (25 μg) for each experimental condition were loaded on a 10% SDS-PAGE gel. Electrophoresis was run at 20 mA/gel, and separated proteins were subsequently blotted on nitrocellulose membranes at 100 V for 1 hour, on ice. After 1 hour blocking with bovine serum albumin 2.5% in Tris buffered saline, membranes were incubated over night with primary antibodies: CREB1 (C-21, Santa Cruz Biotechnology), ERK 1/2 (sc-135900, Santa Cruz Biotechnology), P70S6K (C-18, Santa Cruz Biotechnology), pAkt1 (S473, 81283, Abcam), and betaactin (Santa Cruz Biotechnology). The following day, after 1 hour incubation in suitable secondary antibody (1:4000) (goat antirabbit and goat antimouse, respectively, Santa Cruz Biotechnology), membranes were incubated for 5 minutes in ECL solution (Thermo Fisher Scientific, Waltham, MA, USA) and exposed to film.
Statistical analysis
For each experiment, data from three independent experiments were analyzed; Student’s t-test was used to calculate statistical significance; in every individual experiment, each experimental condition was reproduced in triplicate. For protein expression analysis using the Luminex system, data acquisition and processing were performed using STarStation 2.3 software (Applied Cytometry, Sheffield, UK), and calibration curves were built using the built-in five-point logistics function of the software.
Results
Having personalized therapy as a future goal and searching for the best experimental conditions to assess effects of inhibitors, we chose patient-derived primary cell cultures.
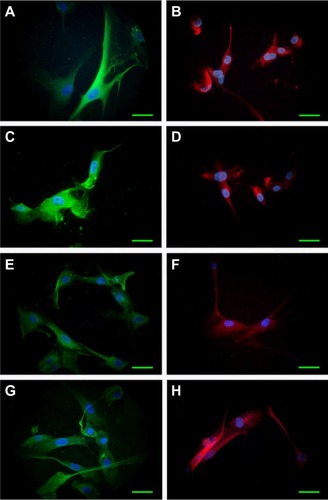
Cell morphological features of initial cultures were maintained during several passages, as revealed by cell shape, size, and density. Immunofluorescence examination for GFAP, Nestin, and Notch receptors 1–4 detected a relatively constant presence of these biomarkers from one passage to another. GFAP was expressed in over 90% of the cells in all situations, attesting the tumor origin of the cultivated cells. Examples of GFAP and Nestin distribution in Passages 1 and 4 are provided in .
Figure 1 Expression of GFAP (green) and Nestin (red) in cultivated cells derived from tumor specimens.
Abbreviations: DAPI, 4′,6-diamidino-2-phenylindole; GFAP, glial fibrillary acidic protein; obj, objective.
Upon prolonged cultivation, Case B culture established neurospheres similar to those generated by the U87 cell line.
Qiu et al reported a similar approach using GFAP as a marker for glioma cells in culture.Citation25 Witusik-Perkowska et al reported adherent cells and spheroid cultures derived from glioblastoma, displaying similar morphologies with our results.Citation18
Assessment of signal transduction molecules modulated by protein kinase inhibitors: xMAP analysis
Our study examined the expression pattern of several signal transduction molecules that act as key players in various cancers, including glioblastoma. The expression levels of key molecules involved in signaling pathways relevant to brain carcinogenesis: ERK 1/2, JNK, P70S6K, IκBα, p38, and CREB were determined in tissue samples from glioblastoma patients. The expression profile is described in . Significant differences were obtained in tumoral compared with peritumoral samples: the kinases ERK 1/2, P70S6K, JNK, and p38 were 1.7-fold to 4.0-fold increased, and the transcription factor CREB had a twofold increment.
Figure 2 Expression profiles of signal transduction proteins quantified by xMAP analysis.
Abbreviations: CREB, cAMP response element-binding protein; GAPDH, glyceraldehyde 3-phosphate dehydrogenase; MFI, mean fluorescence intensities; SD, standard deviation; ERK, extracellular signal-regulated kinase; JNK, jun amino-terminal kinase.
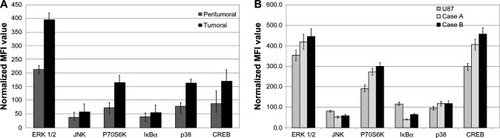
The basal (unstimulated) expression pattern of the same molecules was examined in cell cultures established from patients and in the U87 glioblastoma cell line and are presented in . The displayed profile of expression appears rather similar for most of the examined molecules, between case-derived and U87 cells.
The expression profile of signal transduction molecules in patient-derived cell cultures closely follows the trend found in the originating tumor tissue, but at a higher concentration. This may be explained by a higher ratio of the physiologically active cells and to a lower contamination with stromal, endothelial, and inflammatory cells compared to the originating tissue ( and ).
Similar results were obtained using xMAP and Western blot technologies for determining protein levels in a linear fashion (Figure S1).
Treating the cells with protein kinase inhibitors resulted in an array of responses of signaling molecule expression, a pattern that appears to be specific for each cell culture ().
Figure 3 Modulation of protein expression of signal transduction molecules in case-derived cell cultures treated with pharmacological inhibitors: LY294002 (A), PD98059 (B), U0126 (C) and SB203580 (D).
Abbreviations: PI3K, phosphatidylinositol-3′-kinase; SD, standard deviation; vs, versus; CREB, cAMP response element-binding protein; ERK, extracellular signal-regulated kinase; JNK, jun amino-terminal kinase.
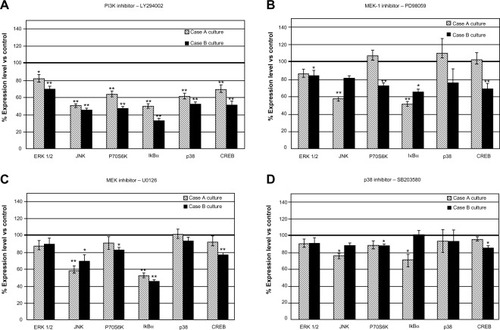
PI3K inhibitor treatment induced the strongest response in patient-derived cell cultures, demonstrated by a decreased expression level of all tested signaling molecules (). Case B-derived cells showed an overall more prominent response, displaying decreased expression levels in the range of 30.47%–66.61% in comparison with untreated control cells; for Case A-derived cells, the range was 18.66%–50.44%. The other inhibitors proved to be less effective when compared to PI3K.
Similar results were obtained using xMAP and Western blot technologies for determining protein levels and phosphorylation status in a linear fashion (Figures S2 and S3). The inhibitor did, as expected, completely inhibit the level of pAkt (Figure S3).
The effects of kinase inhibition were demonstrated on the components of the targeted signaling cascades (PI3K → P70S6K, MEK-ERK 1/2 → P70S6K) and also on molecules involved in other signal transduction cascades (CREB). P70S6K was significantly down-regulated after the inhibition of PI3K by LY294002 (); since P70S6K is a major player in the control of protein synthesis, a general decline in protein synthesis is expected as a consequence of the inhibition of one of its main activators.
MEK-1 inhibition of Case B cells induced after PD98059 treatment was associated with a moderate decrease in expression level of all investigated signaling molecules. This finding did not apply to Case A, where PD98059 inhibitor displayed more selective effects. MEK-1 and MEK-1/2 inhibitors exerted more significant effects than the p38 inhibitor (–), suggesting ERK 1/2 as another therapeutic target for glioblastoma cases. Inhibition of ERK 1/2 phosphorylation by MEK inhibitors U0126 and PD98059 in U87 cell cultures was detected as expected (Figure S3), showing that inhibitors acted on their primary target pathways.
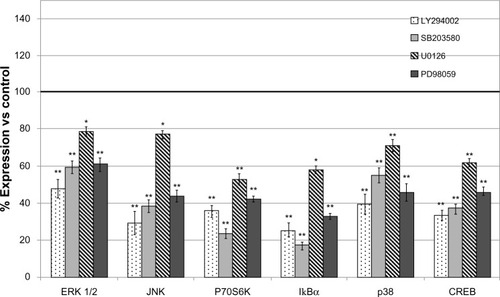
Compared to the patient-derived cell cultures, the U87 cell line was sensitive in variable degrees to all used inhibitors, pointing to PI3K inhibitor as the most active ().
Figure 4 Modulation of protein expression of signal transduction molecules in U87 glioblastoma cell line treated with pharmacological inhibitors LY294002, PD98059, U0126, and SB203580.
Abbreviations: CREB, cAMP response element-binding protein; vs, versus; ERK, extracellular signal-regulated kinase; JNK, jun amino-terminal kinase; SD, standard deviation.
The results of xMAP expression analysis were confirmed by Western blot for total ERK, P70S6K, and CREB (Figure S2). Confirmation of effects of MEK inhibitor and PI3K inhibitor on phosphorylation levels of their targets were obtained by xMAP and Western blot (Figure S3).
Real-time monitoring using xCELLigence platform
Following xMAP assay results, we assessed whether these molecular modifications impact tumor cell behavior. In basal conditions, impedance registered for patient-derived culture cells tends to plateau within the first 24 hours of cultivation, similar to the U87 glioblastoma cell line. The choice to use only cells in basal conditions (steady state growth in normal tissue culture medium, without starvation and stimulation) for the assessment of effects displayed by pharmacological inhibitors is supported by Bartscht et al.Citation26 This group showed that both stimulated cells and nonstimulated cells have a similar scattering behavior related to inhibition.Citation26
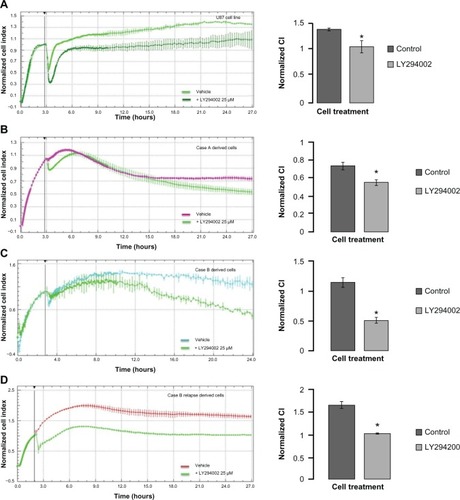
Under all inhibitors, adhesion and proliferation of U87 glioblastoma cells decreased, with the PI3K inhibitor having the most prominent effect (data not shown), in compliance with the inhibition obtained on xMAP analysis. In these circumstances, we have further investigated if the molecular modifications yielded by PI3K inhibition induced significant alteration of patient-derived cell culture behavior. Decreased scattering and proliferation was observed with 25 μM of PI3K inhibitor for both the U87 cell line and the patient-derived cultures (). Case A derived cells showed a delayed response to kinase inhibition (); however, at 24 hours, this response also reached statistical significance, as indicated in the right panel.
Figure 5 Real-time impedance analysis of cell proliferation under PI3K inhibition.
Abbreviations: CI, cell indexes; DMSO, dimethyl sulfoxide; SD, standard deviation.
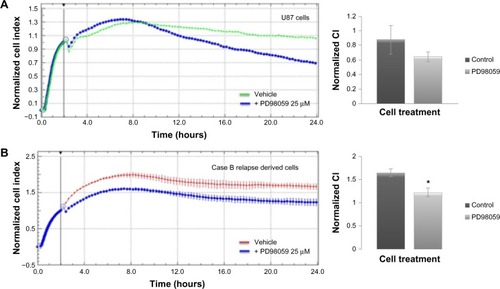
We have further assessed the adherence and proliferation patterns for U87 and patient B relapse derived cells in response to MEK-1 inhibition by PD98059 25 μM (). Twenty-four hours of incubation in cell culture standard condition, with MEK-1 inhibitor, displayed a decreased proliferation under kinase inhibition for both the standardized cell line () and patient-derived cells ().
Figure 6 Real-time impedance analysis of cell proliferation under MEK-1 inhibition.
Abbreviations: CI, cell indexes; DMSO, dimethyl sulfoxide; SD, standard deviation.
Discussion
Our main results reveal that inhibiting the PI3K pathway in patient-derived glioblastoma cells impacts the expression of signaling proteins significantly, along with the cell proliferation pattern. A combination of real-time monitoring of cell behavior and screening for expression levels of signaling proteins can highlight important differences between primary tumors of similar histological type, and can possibly allow comparisons of primary and relapse tumor samples from the same patient.
Improving overall understanding of the fundamental mechanisms that govern cell proliferation and invasiveness is vital for the future development of therapeutic approaches for treating devastating cancers, such as glioblastoma. As in any other type of cancer, glioblastoma shows increased cell survival due to mutations, gene amplifications, and deletions, often (at least 40%) targeting the PI3K signaling pathway.Citation27,Citation28 Although the PI3K signaling pathway is being investigated as a target for treatment of glioblastoma,Citation28–Citation31 it is still essential to study the effect of inhibitors on patient-derived cell cultures and carefully characterize sensitivity to inhibitors or combinations of inhibitors. The global effects we notice in signaling studies might support the dependence of these tumors to the PI3K signaling pathway; therefore, PI3K inhibitors as therapeutic agents might change the clinical treatment landscape of glioblastoma patients.Citation32–Citation34
Our study revealed that treatment of glioblastoma cell cultures from patient tumors with PI3K inhibitor induced significant decrease in the expression level of several key signaling molecules involved in cell survival (p38), proliferation (ERK 1/2, IκBα, p38 MAP[mitogen-activated protein]-kinase, CREB), differentiation (ERK 1/2, CREB), migration (ERK 1/2, CREB), and apoptosis (ERK 1/2, P70S6K, IκBα, JNK, CREB). The simultaneous detection of several molecules involved in various signaling pathways has not been previously reported in glioblastoma. Further studies are needed in order to assess whether this regulation is transcriptional or post-transcriptional. The effects of PI3K inhibitors on the expression of key signal transduction molecules were also reflected in cell proliferation and are in accordance with similar findings regarding the role of PI3K as a therapy target, disclosed by Boller et al.Citation34 This group demonstrated that specific pharmacological inhibitors or RNA interferences impaired cell proliferation in several tumor types, including glioblastoma.Citation34 The maximal efficacy of PI3K inhibitor recorded by us on the cellular responses is consistent with other studies that point out the major relevance of PI3K signaling in glioblastoma and that PI3K inhibitors can complement, enhance, or override the limited success of epidermal growth factor receptor inhibitors in clinical trials.Citation35
One of the molecules affected by inhibitors, P70S6K, can be activated by loops emerging from PI3K and ERK pathways. This offers an “escape” route that may diminish the efficacy when targeting a single pathway, and supports some suggestions regarding the simultaneous use of PI3K and MAP-kinase inhibitors.Citation36 In our study, down-regulation of P70S6K was observed for Case B with both PI3K and MEK-1 inhibitors, in accordance with decreased proliferation profile revealed by real-time monitoring assay. A similar interference between signaling pathways was evidenced for PI3K and MEK/ERK pathways by Sunayama et al.Citation37
The distinct patterns of reactivity to inhibitors in our experiments point to the differences between patients for similar histological grades. Distinct sensitivity to growth inhibition by pharmacological MEK inhibitors was demonstrated by See et al on several glioblastoma cell lines.Citation38
The modification of protein expression for several signal transduction molecules under inhibition of one pathway (in our case, PI3K) is consistent with the previous demonstration by Han et al, that PI3K inhibition affects β-catenin mediated transcription.Citation39 Furthermore, precedents also exist in the cytokine receptor signaling field, where, for instance, it was shown that MAP-kinase ERK activation by IL(interleukin)-2 via IL-2R β and γ chain is decreased by PI3K inhibitors. Reif et al demonstrated that there is a crucial link between the IL-2 receptor, the proto-oncogene PKB, and P70S6K.Citation40
Down-regulation of key signal transducers generates a potential desensitization of cells towards extracellular signals, as well as towards several endogenous oncogenic molecules. The down-regulated molecules affect downstream signaling for cytokines, growth, and angiogenic factors, and belong (in most cases, simultaneously) to several gene ontologies (antiapoptosis, cell cycle, transcription, regulation of transcription, angiogenesis, cell adhesion, cell growth, cell differentiation).Citation41 Moreover, Cox et al have investigated gene expression for proteins distributed in various transduction pathways. The inhibition of a single molecule (SOX-2) revealed significant modification of expression (over twofold up- or down-regulation) of a large number of genes, reporting a total of 620 transcripts with altered expression.Citation42
Using different inhibitors to disrupt tyrosine kinase signaling, our study resulted in changes in proliferation rates of glioblastoma cells in culture, as assessed by xCELLigence studies. In vitro analyses indicate that patient B would benefit mostly from PI3K inhibition therapy. The differences in responses between cases (as outlined by both proteomic analysis and functional assays) make an argument for personalized medicine in a sense extending genetic testing to functional and signaling assessments. The difference in sensitivity between different patient-derived cultures is not unexpected, since differences in expression profiles of several genes have been demonstrated for several glioblastoma derived cell lines.Citation43
Importantly, a considerable consistency could be found between the effects of various protein-tyrosine-kinase inhibitors on protein expression of signal transduction molecules and cell behavior (adhesion and proliferation), as measured in real-time experiments. Thus, the best-ranked inhibitors (as established by protein expression experiments) also proved to be the most effective tools in decreasing cell growths.
The cellular pattern of signaling molecules in basal (unstimulated) cultivation conditions is in good correlation with the profile obtained in originating tissue samples (data not shown). In our view, this can represent a valuable tool for the assessment of in vitro-to-in vivo translatability. A further step in reducing this gap would be a better reproduction of some in vivo microenvironmental determinants, such as partial oxygen pressure, since hypoxia and members of hypoxia-inducible factors family are described among the major actors in glioblastoma, as well as in other tumors.Citation44–Citation46
Assessing key signaling molecules through the rapid and efficient screening method represented by xMAP technology can be useful for the diagnosis of brain tumors and for the discovery of new potential therapeutic targets or therapy monitoring. Furthermore, using molecular profiling, via high-throughput technologies such as proteomics, genomics, and metabolomics, it is currently possible to identify unique differences within an individual tumor, or between tumors of same histological grade.Citation47
Conclusion
Our results show that in comparison to standard cell lines, evaluating tumor-derived cells by a combination of real-time monitoring of cellular behavior and multiplex analysis of several signaling pathways can be used for individualized therapy in patients with both primary and relapsed tumors.
PI3K inhibition proved to have the greatest capacity to influence the signaling proteins pattern, which would suggest that this pathway might be a prime target for glioblastoma treatment, alone or in combination, depending on the molecular association appending to each individual tumor.
Author contributions
Maria Linda Cruceru, Ana-Maria Enciu, and Adrian Claudiu Popa performed the experiments; Radu Albulescu, Maria Linda Cruceru, and Ana-Maria Enciu analyzed the data; and Cristiana Pistol Tanase, Radu Albulescu, Monica Neagu, and Stefan N Constantinescu designed the research study and analyzed data. All authors took part in either drafting the article or revising it critically for important intellectual content.
Acknowledgments
The research presented in this paper was supported by Grant POS-CCE 685-152/2010, Romania. Stefan N Constantinescu was supported by the Ludwig Institute for Cancer Research, ARC, and Fondation contre le cancer, Belgium. The authors present special thanks to Dr Daniel Petrescu from Neurology and Neurovascular Diseases National Institute, Bucharest, Romania, for providing the samples of patients’ tumors.
Supplementary materials
Figure S1 Validation of xMAP assays for signal transduction molecule.
Notes: Serial dilutions of U87 cell lysates 1, 1/2, 1/4, and 1/8 for xMAP and 1, 1/2, 1/4, 1/8, and 1/16 for Western blot, respectively, were used for the estimation of the expression levels of P70S6K, ERK 1/2, and CREB. For xMAP assay, the MFI were normalized using GAPDH as a “housekeeping molecule.” (A) Dependence of normalized MFI with concentration of sample. (B) Western blot evaluation of protein levels of P70S6K, ERK 1/2, and CREB at different dilutions. Both methods demonstrated similar trends between sample concentration and the specific signal.
Abbreviations: CREB, cAMP response element-binding protein; GAPDH, glyceraldehyde 3-phosphate dehydrogenase; MFI, mean fluorescence intensities; ND, non diluted; ERK, extracellular signal-regulated kinase.
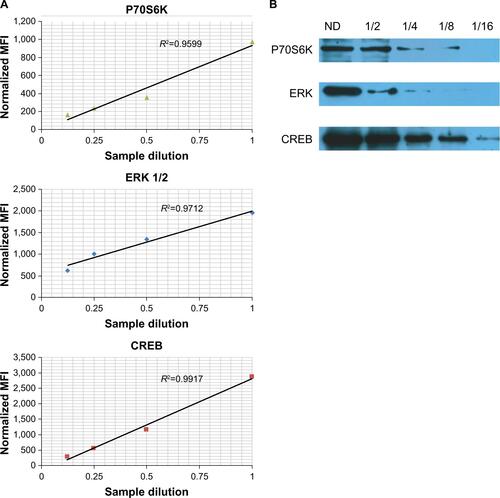
Figure S2 Validation of modulation of signal transduction molecules expression by WB.
Notes: U87 cell lysates, from untreated cells and cells treated with PI3K inhibitor LY294002 were analyzed by WB. Expression levels of P70S6K, ERK 1/2, and CREB were specifically detected. Depletion of protein expression for each molecule was demonstrated in treated cells. Actin was used as a loading control. U87 cells were grown with vehicle (1/400 DMSO – untreated cells) or 25 μM PI3K inhibitor (LY294002) for 24 hours, lysed, and the same amount of protein was loaded on a 10% SDS-PAGE gel, transferred onto a nitrocellulose membrane, and examined for total protein expression. Betaactin reblotting was used as loading control. PI3K inhibitor treatment lowered total protein levels for all three investigated proteins.
Abbreviations: CREB, cAMP response element-binding protein; DMSO, dimethyl sulfoxide; PI3K, phosphatidylinositol-3′-kinase; WB, Western blot; SDS-PAGE, sodium dodecyl sulfate polyacrylamide gel electrophoresis; ERK, extracellular signal-regulated kinase.
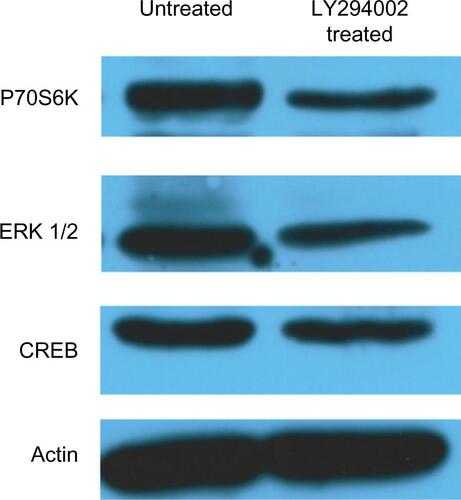
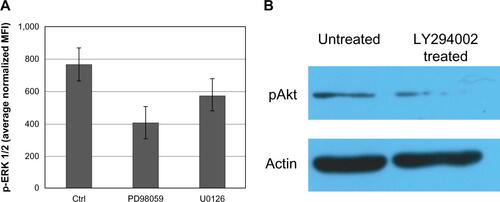
Figure S3 Verification of inhibitory effects of some inhibitors on the activity of targeted signal transduction molecules.
Notes: (A) xMAP determination of pERK 1/2, in U87 cells treated with the MEK inhibitors U0126 and PD98059. U87 controls were cultivated under similar conditions and administered an equal amount of vehicle as that used for the administration of inhibitor. Both inhibitors affected the levels of phosphorylation of ERK 1/2, as demonstrated by Luminex assay using the pERK MAP-mates. (B) WB determination of inhibition of Akt phosphorylation by inhibition of PI3K by treatment of U87 cells with PI3K inhibitor LY294002. U87 cells were treated with vehicle (1/400 DMSO) or 25 μM PI3K inhibitor (LY294002) for 24 hours, lysed, and the same amount of protein was loaded on a 10% SDS-PAGE gel, transferred onto a nitrocellulose membrane, and examined for Akt activation. Betaactin reblotting was used as loading control. Cell treatment with PI3K inhibitor significantly lowered pAkt levels.
Abbreviations: Akt, protein kinase B; Ctrl, control; DMSO, dimethyl sulfoxide; MFI, mean fluorescence intensities; PI3K, phosphatidylinositol-3′-kinase; SDS-PAGE, sodium dodecyl sulfate polyacrylamide gel electrophoresis; WB, Western blot; pAkt, phospho Akt.
Disclosure
The authors report no conflicts of interest in this work.
References
- SchwartzSAWeilRJJohnsonMDTomsSACaprioliRMProtein profiling in brain tumors using mass spectrometry: feasibility of a new technique for the analysis of protein expressionClin Cancer Res200410398198714871976
- IwamiKNatsumeAWakabayashiTCytokine networks in gliomaNeurosurg Rev2011343253263 discussion 263–26421656131
- OhkaFNatsumeAWakabayashiTCurrent trends in targeted therapies for glioblastoma multiformeNeurol Res Int2012201287842522530127
- LouisDNOhgakiHWiestlerODThe 2007 WHO classification of tumours of the central nervous systemActa Neuropathol200711429710917618441
- DresemannGTemozolomide in malignant gliomaOnco Targets Ther2010313914620856849
- YoonCHKimMJKimRKc-Jun N-terminal kinase has a pivotal role in the maintenance of self-renewal and tumorigenicity in glioma stem-like cellsOncogene201231444655466622249269
- ChenJLiYYuTSA restricted cell population propagates glioblastoma growth after chemotherapyNature2012488741252252622854781
- SaiKWangSBalasubramaniyanVInduction of cell-cycle arrest and apoptosis in glioblastoma stem-like cells by WP1193, a novel small molecule inhibitor of the JAK2/STAT3 pathwayJ Neurooncol2012107348750122249692
- ChenJMcKayRMParadaLFMalignant glioma: lessons from genomics, mouse models, and stem cellsCell20121491364722464322
- ScheckACStaffordPDesign and use of biomarkers for the current and future clinical management of brain tumorsBiomark Med20126329329522731902
- IwadateYSakaidaTHiwasaTMolecular classification and survival prediction in human gliomas based on proteome analysisCancer Res20046472496250115059904
- KumarHRZhongXSandovalJAHickeyRJMalkasLHApplications of emerging molecular technologies in glioblastoma multiformeExpert Rev Neurother20088101497150618928343
- OlarAAldapeKDBiomarkers classification and therapeutic decision-making for malignant gliomasCurr Treat Options Oncol201213441743622956341
- AlbulescuRCodriciEPopescuIDCytokine patterns in brain tumour progressionMediators Inflamm2013201397974823864770
- Van MeirEGHadjipanayisCGNordenADShuHKWenPYOlsonJJExciting new advances in neuro-oncology: the avenue to a cure for malignant gliomaCA Cancer J Clin201060316619320445000
- LukasRVBoireANicholasMKTargeted therapy in the treatment of malignant gliomasOnco Targets Ther2009211513320616900
- FentonTRNathansonDPonte de AlbuquerqueCResistance to EGF receptor inhibitors in glioblastoma mediated by phosphorylation of the PTEN tumor suppressor at tyrosine 240Proc Natl Acad Sci U S A201210935141641416922891331
- Witusik-PerkowskaMRieskePHułas-BigoszewskaKGlioblastoma-derived spheroid cultures as an experimental model for analysis of EGFR anomaliesJ Neurooncol2011102339540720803305
- PopescuLMManoleESerboiuCSIdentification of telocytes in skeletal muscle interstitium: implication for muscle regenerationJ Cell Mol Med20111561379139221609392
- PingYFYaoXHJiangJYThe chemokine CXCL12 and its receptor CXCR4 promote glioma stem cell-mediated VEGF production and tumour angiogenesis via PI3K/AKT signallingJ Pathol2011224334435421618540
- KambeAYoshiokaHKamitaniHWatanabeTBaekSJElingTEThe cyclooxygenase inhibitor sulindac sulfide inhibits EP4 expression and suppresses the growth of glioblastoma cellsCancer Prev Res (Phila)20092121088109919934343
- LinHYSunMTangHYL-Thyroxine vs 3,5,3′-triiodo-L-thyronine and cell proliferation: activation of mitogen-activated protein kinase and phosphatidylinositol 3-kinaseAm J Physiol Cell Physiol20092965C980C99119158403
- ZohrabianVMForzaniBChauZMuraliRJhanwar-UniyalMRho/ROCK and MAPK signaling pathways are involved in glioblastoma cell migration and proliferationAnticancer Res200929111912319331140
- PoreNJiangZShuHKBernhardEKaoGDMaityAAkt1 activation can augment hypoxia-inducible factor-1alpha expression by increasing protein translation through a mammalian target of rapamycin-independent pathwayMol Cancer Res20064747147916849522
- QiuBZhangDTaoJWuAWangYA simplified and modified procedure to culture brain glioma stem cells from clinical specimensOncol Lett201231505422740855
- BartschtTLehnertHGieselerFUngefrorenHThe Src family kinase inhibitors PP2 and PP1 effectively block TGF-beta1-induced cell migration and invasion in both established and primary carcinoma cellsCancer Chemother Pharmacol201270222123022699812
- KitaDYonekawaYWellerMOhgakiHPIK3CA alterations in primary (de novo) and secondary glioblastomasActa Neuropathol2007113329530217235514
- ParkCMParkMJKwakHJIonizing radiation enhances matrix metalloproteinase-2 secretion and invasion of glioma cells through Src/epidermal growth factor receptor-mediated p38/Akt and phosphatidylinositol 3-kinase/Akt signaling pathwaysCancer Res200666178511851916951163
- HölandKSalmFArcaroAThe phosphoinositide 3-kinase signaling pathway as a therapeutic target in grade IV brain tumorsCurr Cancer Drug Targets201111889491821861842
- WickWWellerMWeilerMBatchelorTYungAWPlattenMPathway inhibition: emerging molecular targets for treating glioblastomaNeuro Oncol201113656657921636705
- PuPKangCZhangZLiuXJiangHDownregulation of PIK3CB by siRNA suppresses malignant glioma cell growth in vitro and in vivoTechnol Cancer Res Treat20065327128016700623
- WenPYLeeEQReardonDALigonKLAlfred YungWKCurrent clinical development of PI3K pathway inhibitors in glioblastomaNeuro Oncol201214781982922619466
- KoulDShenRKimYWCellular and in vivo activity of a novel PI3K inhibitor, PX-866, against human glioblastomaNeuro Oncol201012655956920156803
- BollerDDoepfnerKTDe LaurentiisATargeting PI3KC2β impairs proliferation and survival in acute leukemia, brain tumours and neuroendocrine tumoursAnticancer Res20123283015302722843869
- OpelDWesthoffMABenderABraunVDebatinKMFuldaSPhosphatidylinositol 3-kinase inhibition broadly sensitizes glioblastoma cells to death receptor- and drug-induced apoptosisCancer Res200868156271628018676851
- KimYWLiuTJKoulDIdentification of novel synergistic targets for rational drug combinations with PI3 kinase inhibitors using siRNA synthetic lethality screening against GBMNeuro Oncol201113436737521430111
- SunayamaJMatsudaKSatoACrosstalk between the PI3K/mTOR and MEK/ERK pathways involved in the maintenance of self-renewal and tumorigenicity of glioblastoma stem-like cellsStem Cells201028111930193920857497
- SeeWLTanILMukherjeeJNicolaidesTPieperROSensitivity of glioblastomas to clinically available MEK inhibitors is defined by neurofibromin 1 deficiencyCancer Res201272133350335922573716
- HanLYangYYueXInactivation of PI3K/AKT signaling inhibits glioma cell growth through modulation of β-catenin-mediated transcriptionBrain Res2010136691720888802
- ReifKBurgeringBMCantrellDAPhosphatidylinositol 3-kinase links the interleukin-2 receptor to protein kinase B and p70 S6 kinaseJ Biol Chem19972722214426144339162082
- CarbonSIrelandAMungallCJShuSMarshallBLewisSAmiGO HubWeb Presence Working GroupAmiGO: online access to ontology and annotation dataBioinformatics200925228828919033274
- CoxJLWilderPJDeslerMRizzinoAElevating SOX2 levels deleteriously affects the growth of medulloblastoma and glioblastoma cellsPLoS One201278e4408722937156
- ClarkMJHomerNO’ConnorBDU87MG decoded: the genomic sequence of a cytogenetically aberrant human cancer cell linePLoS Genet201061e100083220126413
- HeddlestonJMWuQRiveraMHypoxia-induced mixed-lineage leukemia 1 regulates glioma stem cell tumorigenic potentialCell Death Differ201219342843921836617
- BarEELinAMahairakiVMatsuiWEberhartCGHypoxia increases the expression of stem-cell markers and promotes clonogenicity in glioblastoma neurospheresAm J Pathol201017731491150220671264
- MéndezOZavadilJEsencayMKnock down of HIF-1alpha in glioma cells reduces migration in vitro and invasion in vivo and impairs their ability to form tumor spheresMol Cancer2010913320515450
- RosserCJGoodisonSToday’s discoveries to tomorrow’s care: cancer biomarkers revisited. ForewordBiomark Med20104449149320701437