
Abstract
Purpose
Skin cutaneous melanoma (SKCM) is the most aggressive skin cancer that results in high morbidity and mortality rate worldwide. Immune-related long non-coding RNAs (IRlncRs) play an important role in regulating gene expression in tumors. Therefore, in this study, we aimed to identify IRlncRs signature that could predict prognosis and therapeutic targets for melanoma irrespective of the gene expression levels.
Methods
RNA-sequencing data were obtained from The Cancer Genome Atlas (TCGA). IRlncRs were identified using co-expression analysis and recognized using univariate analysis. The impact of IRlncRs on survival was analyzed using a modified least absolute shrinkage and selection operator (Lasso) regression model. A 1-year survival receiver operating characteristic curve was constructed, and the area under the curve was calculated to identify the optimal cut-off point to distinguish between high and low-risk groups in patients with SKCM. Furthermore, integrative analysis was performed to identify the impact of clinicopathological features, chemotherapeutic treatment, tumor-infiltrating immune cells, and mutant genes on survival.
Results
A total of 28 IRlncRs significantly associated with survival were identified. Seventeen IRlncRs pairs were used to build a survival risk model that could be used to distinguish between low and high-risk groups. The high-risk group was negatively associated with tumor-infiltrating immune cells and had a higher half inhibitory centration for chemotherapeutic agents such as cisplatin and vinblastine. Additionally, the high-risk group had a positive correlation with the expression of specific mutant genes such as BRAF and KIT.
Conclusion
Our findings demonstrate that some IRlncRs have a significant correlation with survival and therapeutic targets for SKCM patients and may provide new insight into the clinical diagnosis and treatment strategies for SKCM patients.
Introduction
Malignant melanoma is one of the most aggressive cancers and the fifth most common cancer in the United States.Citation1 The incidence of skin cutaneous melanoma (SKCM) continues to increase in both males and females.Citation2,Citation3 In contrast, melanoma cancer mortality has declined with the emergence of targeted therapy and immunotherapy in recent years.Citation4 Surgery is the primary treatment option for localized disease with cure rates of 90%.Citation5 Other therapeutic approaches such as chemotherapy, radiotherapy, targeted therapy, and immunotherapy are increasingly being used to improve local control. Although the remarkable improvements in targeted therapy and immunotherapy,Citation4 the prognosis of metastatic melanoma remains poor due to its intrinsic resistance to chemotherapy or radiotherapy and aggressive clinical behavior.Citation6 Therefore, it is crucial to explore new sensitive biomarkers to predict melanoma patients’ prognosis and further guide the proper individual treatment strategies.
Long non-coding RNA (lncRNA) is a class of RNA transcripts more than 200 nucleotides, which take part in gene expression through histone modification, transcriptional, translational, and post-transcriptional regulations.Citation7 Although lncRNAs include most transcripts in the mammalian genomes, their biological functions remain largely unknown.Citation8 Recent studies indicated that lncRNAs were involved in human diseases such as various cancer.Citation9–Citation11 For instance, lncRNA DLX6-AS1 promoted proliferation, migration, and invasion of liver cancer via increasing the expression of WEE1.Citation9 Jin et al found that overexpression of lncRNA MORT inhibited cell proliferation in oral squamous cell carcinoma through downregulating ROCK1.Citation10 Various lncRNAs have also been linked with tumor progression in melanoma. MEG3 was found to promote growth, metastasis, and formation of melanoma via regulating the miR-21/E-cadherin axis.Citation11 MALAT1 was found to be highly associated with lymph node metastasis, and UCA1 was related to advanced melanoma.Citation12 Moreover, lncRNAs regulate genes related to the activation of immune cells, thus leading to tumor immune-cell infiltration while altering the immune microenvironment.Citation13,Citation14 These findings suggest that lncRNAs could be used as predictive biomarkers for metastatic melanoma.
Therefore, the construction of a model to accurately predict the prognosis may play an important role in improving survival in SKCM patients. The signatures related to tumor immune infiltration reveal promising predictive and prognostic effectiveness in the evaluation, diagnosis, and treatment of cancer.Citation15–Citation17 The immune-related long non-coding RNAs (IRlncRs) signatures further improve the accuracy of prediction and diagnosis.Citation18–Citation21 Moreover, the use of dual biomarkers was found to increase the prediction accuracy of diagnostic models for cancers when compared with single genes.Citation22 However, there are few similar models available for SKCM. In this study, a novel modeling algorithm, paring, and iteration were utilized to establish an IRlncRs signature that could be used to improve the diagnosis of SKCM irrespective of the specific expression levels. Then, we validated its predictive value among patients with SKCM, as well as its diagnostic effectiveness, tumor immune infiltration, and chemotherapeutic efficacy.
Materials and Methods
Data Download and Pretreatment
The workflow used throughout this study is illustrated in . The RNA-sequencing (RNA-Seq) data of 470 SKCM samples were downloaded from The Cancer Genome Atlas (TCGA) data portal (https://portal.gdc.cancer.gov/). The corresponding patients’ clinical data, such as age, survival information, and clinical stage, were also derived from TCGA. The clinicopathological characteristics of these patients are listed in . Gene transfer annotation files were downloaded from Ensembl (http://asia.ensembl.org) to differentiate the messenger RNAs (mRNAs) from lncRNAs for further analysis. The RNA-Seq data files were merged into a matrix file using the merge language script Perl 5.32.1 (http://www.perl.org/). Similarly, we used a symbol script in the Perl language to convert the Ensembl IDs of genes into a matrix of gene symbols.
Table 1 Clinicopathological Characteristics of SKCM Patients from TCGA Database
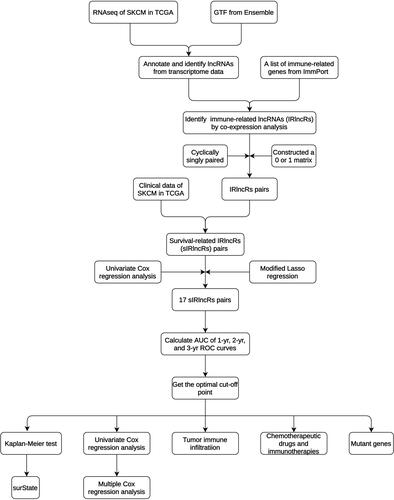
Figure 1 The process flow of this study.
Furthermore, the immune-related genes (ir-genes) list was downloaded from the ImmPort database (http://www.immport.org). It was used to identify IRlncRs through the co-expression analysis. Ir-genes with correlation coefficients higher than 0.6 and a p-value less than 0.001 were classified as IRlncRs.
Pairing IRlncRs
The IRlncRs were cyclically paired individually, and a 0 or 1 matrix was constructed using the assumption that D is equal to IRlncR B plus IRlncR C; D is defined as 1 if the expression of IRlncR B is higher than IRlncR C, otherwise, D is defined as 0. Then, we further screened the constructed 0 or 1 matrix. If the expression quantity of the IRlncR pairs was 0 or 1, the relationship between pairs and prognosis was disregarded, as the absence of a specific grade could not correctly predict the patient’s survival outcome. The IRlncRs-pairs were considered valid when the expression quantity of the IRlncRs-pairs was either 0 or 1 and accounted for 20% to 80% of the total pairs.
Acquisition of Survival-Related IRlncRs (sIRlncRs)
To get the sIRlncRs, we took the intersection of the survival information and the IRlncRs-pairs using the limma package. The survival time of SKCM patients ranges from 0 to 11,252. Then, univariate Cox regression analysis was performed to identify sIRlncRs from the IRlncRs-pairs. The analysis was carried out through the R packages “survival”, and IRlncRs-pairs with p < 0.01 for survival comparison were considered as sIRlncRs. These sIRlncRs were used for subsequent analysis.
Construction of a Risk Model to Evaluate the Risk Score
The prognosis-related sIRlncRs were identified using the least absolute shrinkage and selection operator (Lasso) Cox analysis with 10,000-rounds cross-validation to prevent overfitting. Then, multivariate Cox regression analysis was performed on these prognosis-related sIRlncRs to establish a prognostic sIRlncRs signature and calculate the coefficients.Citation23 The forest map was used to visualize the result of multivariate Cox regression analysis. The risk score of the prognostic sIRlncRs signature for each patient was calculated using the following formula:
Risk score = (ExpressionsIRlncRs1×CoefficientsIRlncRs1) + (ExpressionsIRlncRs2×CoefficientsIRlncRs2) + … + (ExpressionsIRlncRs28 × CoefficientsIRlncRs28).
We calculated the prognostic sIRlncRs signature risk score according to a linear combination of the expression level of sIRlncRs weighted by the regression coefficient (β). The β was calculated from the univariate Cox regression hazard analysis using log-transformed hazard ratios (HR).Citation23–Citation25
Validation of the Constructed Risk Model
We assessed the predictive value of the model using the time-dependent receiver operating characteristic (ROC) curve and calculated the area under the curve (AUC) using the “survivalROC” package.Citation25 The 1-, 2-, and 3-year ROC curves of the model were also plotted. The patients were divided into high-risk and low-risk groups for subsequent analysis according to the optimal cut-off value calculated by the “survminer” package. The Kaplan-Meier survival analysis was used to analyze the survival difference between the two groups. Furthermore, to confirm whether the model was an independent factor for SKCM patients’ survival, we performed univariate and multivariate Cox regression analyses. To confirm the model’s clinical application value, we analyzed the relationship between the model and clinicopathological characteristics with a chi-square test. A band diagram was plotted and labeled according to the p-value as follows: <0.001 = ***<0.01 = * *and <0.05 = *. The Wilcoxon signed-rank test was used to compare the differences in the risk score among groups with different clinicopathological characteristics. The box diagram showed the analysis results. The R packages utilized in these operations were survival, pHeatmap, and ggupbr.
Impact of Tumor-Infiltrating Immune Cells on Risk Scores
To evaluate the relationship between the risk score and immune-cell characteristics, we utilized the widely acknowledged methods to calculate the immune infiltration statuses among the samples from the TCGA project of the SKCM dataset, including TIMER, CIBERSORT, XCELL, QUANTISEQ, MCPcounter, EPIC, and CIBERSORT-ABS. The Wilcoxon signed-rank test was performed to analyze the differences in tumor immune infiltrating cell content between high-risk and low-risk groups of the model. Spearman correlation analysis was used to evaluate the relationship between the risk score and the immune infiltrated cells. The results of both tests were further illustrated through the use of a boxplot diagram. The data were analyzed using the R ggplot2 packages, and a p-value below 0.05 was considered statistically significant.
Clinical Performance of the Model for Identification of Gene Mutations and Treatment
According to the national comprehensive cancer network (NCCN), paclitaxel, vinblastine, and cisplatin are commonly used cytotoxic drugs for the management of SKCM. The clinical performance of the model was estimated by calculating the half-maximal inhibitory concentration (IC50) of these drugs using the SKCM dataset of the TCGA. Wilcoxon signed-rank test analyzed the difference in the IC50 between the high-risk and low-risk groups, using R language loaded with packages pRRophetic and ggplot2. To further explore the clinical performance of the model, we investigated the relationship between this model and immune checkpoint inhibitors including, CTLA4 and PD1. Furthermore, according to the NCCN guidelines, we evaluated the correlation between the risk and specific mutant genes (BRAF, KIT, and NRAS) using R packages limma and ggupbr.
Results
Establishment of IRlncR Pairs and a Risk Assessment Model
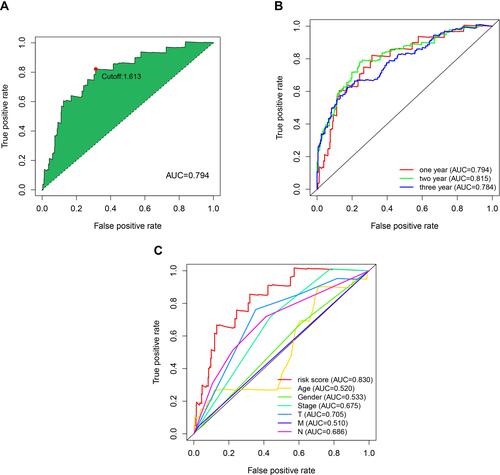
A total of 753 IRlncRs were identified following co-expression analysis between known ir-genes and lncRNAs. These are summarized in Table S1. The iteration loop and the 0 or 1 matrix screening identified 9107 valid IRlncR pairs, following the removal of clinical data with non-complete survival information. The IRlncR pairs were added with survival information by intersecting complete tumor survival information and IRlncR pairs. After univariate Cox regression analysis, a total of 2345 sIRlncRs pairs were identified, as illustrated in Table S2. Using modified Lasso regression analysis ( and , and Table S3), 28 sIRlncRs were extracted, 17 of which were included in a Cox proportional hazards model using the stepwise method (). The AUC of the one-year ROC of the 17 pairs resulted in an optimal cut-off point of 1.613 (). The two- and three-year ROCs further validated the optimal cut-off point with an AUC above 0.784 for both curves (). ROC curves were also used to validate the impact of clinical characteristics on the risk score (). A total of 454 cases of patients with SKCM were identified from TCGA. The risk scores were calculated for all cases.
Figure 2 Identification of survival-related IRlncRs using LASSO regression analysis and multivariate Cox regression analysis. (A) LASSO coefficient profiles of the 28 sIRlncRs of SKCM. (B) Plots of the cross-validation error rates. Each dot represents a lambda value along with error bars that represent the confidence interval for the cross-validated error rate. The top of the plot gives the size of each model. The vertical dotted line indicates the value with the minimum error and the largest lambda value where the deviance is within one SE of the minimum. (C) Forest plots of HR of sIRlncRs pairs obtained by multivariate Cox regression analysis. A total of 6 DEGs were found to be prognostic factors. The genes with HR < 1 are protective factors, while the ones with HR > 1 are risk factors in SKCM.
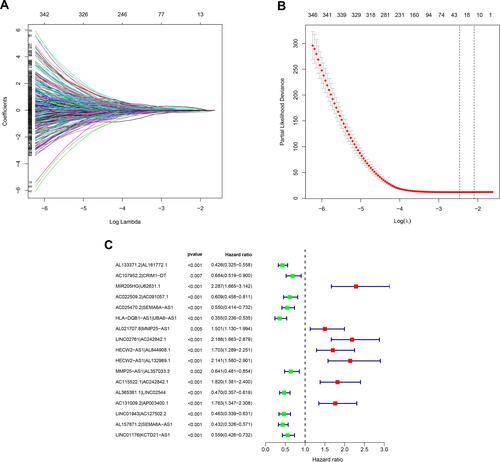
Figure 3 Primary evaluation of the risk model by sIRlncRs pairs. (A) Plot a curve of AUC value generated by ROCs of 1-year and to identify the optimal cut-off value of the AUC. (B) The 1-, 2-, and 3-year survival receiver operating characteristic curves. (C) A comparison of 1-year ROC curves with other common clinical characteristics showed the superiority of the risk score.
Clinical Evaluation by Risk Assessment Model
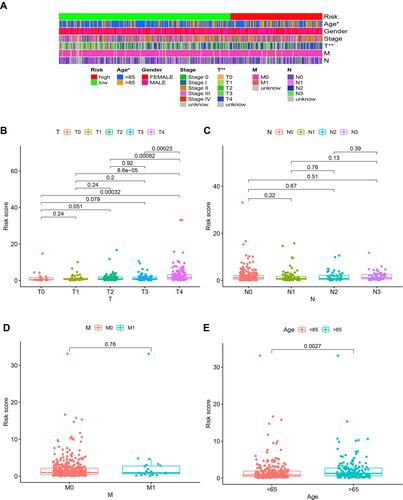
According to the optimal cut-off point validated previously, we divided the SKCM samples into the high-risk group and the low-risk group. The risk curve and scatterplot were drawn to the risk score and survival status of each SKCM sample (). These results suggested that patients in the low-risk group had better clinical outcomes than those in the high-risk group. Kaplan-Meier curve showed that patients in the low-risk group had better overall survival (OS) than those in the high-risk group (p<0.001) (). The result of univariate analysis exhibited that age (P < 0.001), clinical stage (P < 0.001), T stage (P < 0.001), N stage (P < 0.001) and risk score (P < 0.001) were significantly correlated with OS (). Multivariate analysis further suggested that risk score (P < 0.001) was an independent prognostic predictor for SKCM patients (). Furthermore, chi-square tests found the relationship between the prognosis of SKCM and clinicopathological characteristics, including age, gender, clinical stage, T stage, N stage, M stage. The strip chart () and scatter diagrams showed that T stage (), N stage (), M stage (), and age () were significantly related to the risk score.
Figure 4 Risk model for prognosis prediction. (A) From top to bottom are the risk score, survival status distribution of each patient. (B) Overall survival curves of the prognostic signature, in which the blue line represents the low-risk subgroup and the red line represents the high-risk subgroup.
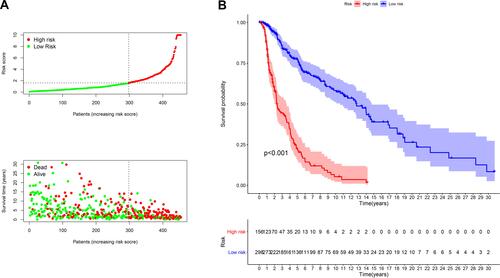
Figure 5 Univariate and multivariate Cox regression analysis of the risk model and clinicopathologic parameters (A-B).
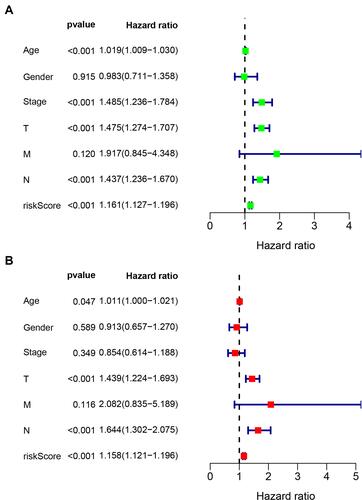
Figure 6 Clinical evaluation by the risk model. A strip chart (A) along with the scatter diagram showed that T stage (B), N stage (C), M stage (D), and age (E) were associated with the risk score.
Association of Tumor-Infiltrating Immune Cells with the Risk Assessment Model
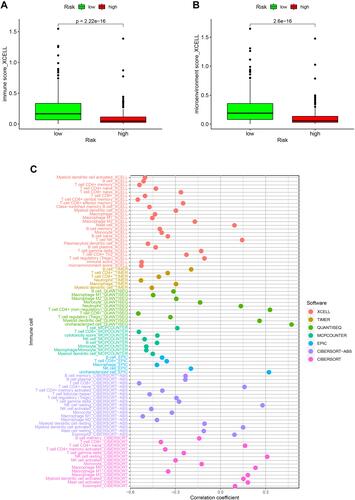
Because the lncRNAs and infiltrating immune cells played essential roles in the tumor microenvironment, we investigated the relationship between the model and the tumor immune microenvironment. We found that the immune score and microenvironment score was significantly higher in the low-risk group than in the high-risk group by the Wilcoxon signed-rank test ( and p<0.001). Furthermore, we showed the differences in infiltrating immune cells between high-risk and low-risk groups in Figure S1–7. A detailed Spearman correlation analysis was conducted, and the bubble chart exhibited that the high-risk group was more negatively associated with tumor-infiltrating immune cells such as B cell, CD4+ T cells, monocytes, and CD8+ T cells, whereas they were positively associated with M0 macrophages, and resting NK cell (, and Table S4).
Figure 7 Estimation of tumor-infiltrating cells by the risk model. Patients in the high-risk group were more negatively associated with tumor-infiltrating immune cells (A) and microenvironment (B). The bubble chart (C) exhibited the detailed correlation between different tumor-infiltrating immune cells.
Verification of the Correlation Between the Risk Model and the IC50 of Common Chemotherapeutic Drugs
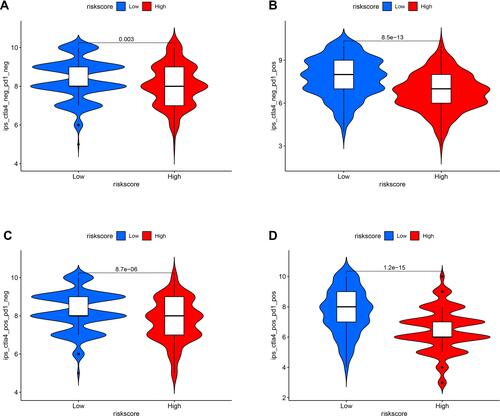
Because cisplatin, vinblastine, and paclitaxel are recommended for cutaneous melanoma treatment by NCCN guidelines, we assessed the correlation between the model and the efficacy of common chemotherapeutics in treating cutaneous melanoma in the TCGA project of the SKCM dataset. The high-risk score was significantly associated with a higher IC50 of chemotherapeutics such as cisplatin (, p<0.001), vinblastine (, p<0.001), and paclitaxel (, p=0.097). Furthermore, we evaluated whether the model could predict patients’ response to immune checkpoint inhibitors including, CTLA4 and PD1. The results showed that patients with low risk-score have better therapeutic effects than those with high risk-score (–, p<0.01). These data suggested that the model might predict the treatment response to specific chemotherapy agents and immunotherapies.
Figure 8 Assessment of the IC50 of common chemotherapeutic drugs by the risk model. Box plots revealed that the high-risk score was significantly associated with a higher IC50 of chemotherapeutics such as cisplatin (A, p<0.001), vinblastine (B, p<0.001), and paclitaxel (C, p=0.097).
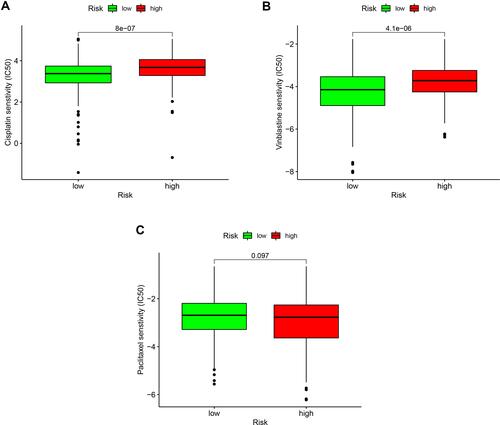
Figure 9 The association between the risk model and the efficacy of immunotherapies (A–D).
Correlation Between the Risk Model and Specific Mutant Genes in SKCM
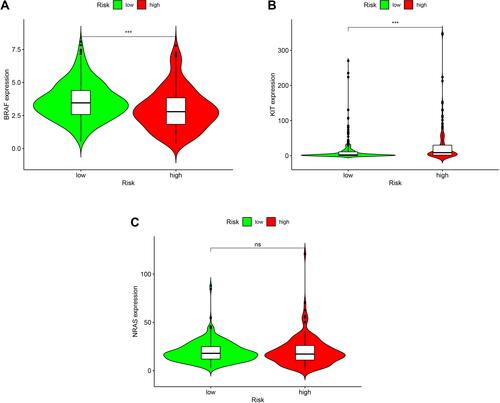
Specific gene mutations (BRAF, NRAS, KIT), which are the most common mutant genes in melanoma, had important diagnostic and prognostic implications according to the NCCN guideline. We also assessed the correlation between the risk and specific mutant genes in the TCGA project of the SKCM dataset. The high-risk group had a positive correlation with the presence of particular mutant genes, including BRAF (, p<0.001), KIT (, p<0.001), and NRAS (, ns). The model confirmed that the presence of these mutant genes has important diagnostic and prognostic implications in SKCM.
Figure 10 Verification of the correlation between the risk model and the most frequently mutated genes in SKCM. Violin plots showed that the high-risk group had a positive correlation with the presence of particular mutant genes, including BRAF ((A), p<0.001), KIT ((B), p<0.001), and NRAS ((C), ns).
Discussion
Despite the recent development of immunotherapy and targeted therapy in the management of SKCM, the treatment outcomes for patients with advanced disease are still poor.Citation26 Tumor molecular features impact treatment response and survival in patients with SKCM, even if these patients have similar clinical risk factors.Citation27 Thus, apart from traditional clinical risk factors, it is imperative to identify additional molecular prognostic markers. Previous studies have concluded that the immune system plays both positive and negative roles in regulating tumorigenesis, cancer progression, and metastasis.Citation26 Correspondingly, lncRNAs are involved in regulating the gene expression of the immune system.Citation14 Therefore, we constructed a model focusing on IRlncRs and tumor-infiltrating immune cells to guide the diagnosis, treatment, and prognosis of SKCM. This study established an excellent model with two-lncRNA combinations, which was inspired by the strategy of ir-gene pairing. The advantage of this technique is that it is not dependent on the expression levels of the gene signature.Citation28
In this study, we downloaded raw datasets of lncRNAs from TCGA and adopted a differential co-expression analysis to pair IRlncRs. Then, IRlncRs-pairs were identified using an improved method of cyclically single pairing along with a 0 or 1 matrix. We further screened for sIRlncRs-pairs using univariate, Lasso, and multivariate Cox regression analysis. The AUC value of the 1-year ROC curve was calculated to estimate the optimal cut-off point to differentiate between the high-risk and low-risk patients.In addition, we assessed the impact of various clinical variables, including clinical-pathological characteristics, tumor-infiltrating immune cells, chemotherapy, and gene mutation, on the prediction model’s accuracy.
A 6-lncRNA signature was set up for predicting prognosis in melanoma patients.Citation29 Generally, lncRNAs possess significant biological functions and characteristics. Our algorithm could initially identify IRlncRs and pair the most significant IRlncRs. Thus, the higher or lower expressed pairs could be detected instead of calculating each lncRNA’s specific expression value. This novel model has a clinical advantage as it facilitates the distinction between high- and low-risk groups. As lncRNAs are correlated with ir-genes, these lncRNAs may be involved in regulating the tumor immune microenvironment or the immune cells. The models of IRlncRs were applied to predict the prognosis of breast cancer,Citation30 hepatocellular carcinoma,Citation31 clear cell renal cell carcinoma,Citation20 and pancreatic cancer,Citation32 except for melanoma. In this study, we first established a novel model with lncRNAs signature to predict melanoma prognosis. In this model, several sIRlncRs had been found to play an important role in the malignant phenotypes of various cancer types, such as AC022509.2,Citation30 LINC02544,Citation33 AC091057.1,Citation34 HLA-DQB1-AS1,Citation34 SEMA6A-AS1,Citation35 AL365361.1,Citation36,Citation37 and UBA6-AS1.Citation38 For example, UBA6-AS1 promoted GBM’s malignant progression by targeting the miR-760/HOXA2 axis. Therefore, this model could be used to identify novel biomarkers.
To increase the efficacy and accuracy of the risk prediction model, we calculated every AUC value to determine the maximum value for the optimal model and then compared it with other clinical parameters. We also calculated an optimal cut-off point with the highest specificity and sensitivity to distinguish between the high- and low-risk groups instead of just using the median value.Then, we reevaluated the survival outcome by performing the chi-square test and Wilcoxon signed-rank test to identify the impact of clinicopathological characteristics, chemotherapy efficacy treatment, tumor immune infiltration, and mutant gene. These findings suggested that the upgraded algorithm worked well irrespective of the patients’ clinicopathological characteristics.
To investigate the relationship between tumor-infiltrating immune cells and risk scores, we used seven standard acknowledged methods to estimate the immune-infiltrating cell, including XCELL,Citation39 TIMER,Citation40 QUANTISEQ,Citation41,Citation42 MCPcounter,Citation43 EPIC,Citation44 CIBERSORTABS,Citation45 and CIBERSORT.Citation46,Citation47 Through the above-integrated bioinformatics analysis, we found that sIRlncRNA pairs were more positively correlated with tumor-infiltrating immune cells such as CD4+T cells, natural killer cells, neutrophils, and myeloid dendritic cells. These immune cells were an important part of the tumor microenvironment and involved in tumorigenesis, invasion, and metastasis.Citation48 Our model suggested that the risk scores were associated with sensitivity to chemotherapeutics (vinblastine, cisplatin), immunotherapies and gene mutations (BRAF, KIT), which further validated the model’s prediction accuracy.
However, this study has some shortcomings and limitations. For example, the raw data downloaded from TCGA was relatively insufficient. We did not manage to retrieve datasets simultaneously, including information on lncRNA expression levels, survival outcomes, and clinicopathological characteristics in patients with SKCM. The constructed model required external validation as each sample had a different expression level, which may lead to an unreliable model. To overcome this problem, a 0 or 1 matrix was created to screen all IRlncRs-pairs and hence minimize sample errors due to differences in expression. Moreover, various methods were used to validate and optimize this novel modeling algorithm. Our model was acceptable based on these results despite the lack of external data and experimental validation. However, external validation by other clinical datasets and experiments is recommended.
Conclusion
A novel prognosis model for SKCM was constructed based on 17 pairs of IRlncRs. These IRlncRs might participant in the development and prognosis of SKCM and could be a powerful indicator of the clinical outcome of SKCM patients. However, further research is required to verify the efficacy of this model clinically.
Acknowledgments
We gratefully acknowledge the contributions of the TCGA project.
Disclosure
The authors declare no conflicts of interest in this work.
References
- Siegel RL, Miller KD, Fuchs HE, Jemal A. Cancer statistics, 2021. CA Cancer J Clin. 2021;71(1):548.
- Ward EM, Sherman RL, Henley SJ, et al. Annual report to the nation on the status of cancer, featuring cancer in men and women age 20–49 years. J Natl Cancer Inst. 2019;111(12):1279–1297. doi:10.1093/jnci/djz106
- Klein SL, Flanagan KL. Sex differences in immune responses. Nat Rev Immunol. 2016;16(10):626–638. doi:10.1038/nri.2016.90
- Berk-Krauss J, Stein JA, Weber J, Polsky D, Geller AC. New Systematic Therapies and Trends in Cutaneous Melanoma Deaths Among US Whites, 1986–2016. Am J Public Health. 2020;110(5):731–733. doi:10.2105/AJPH.2020.305567
- Mishra H, Mishra PK, Ekielski A, Jaggi M, Iqbal Z, Talegaonkar S. Melanoma treatment: from conventional to nanotechnology. J Cancer Res Clin Oncol. 2018;144(12):2283–2302. doi:10.1007/s00432-018-2726-1
- Bommareddy PK, Silk AW, Kaufman HL. Intratumoral Approaches for the Treatment of Melanoma. Cancer j. 2017;23(1):40–47. doi:10.1097/PPO.0000000000000234
- Huang Q, Yan J, Agami R. Long non-coding RNAs in metastasis. Cancer Metastasis Rev. 2018;37(1):75–81. doi:10.1007/s10555-017-9713-x
- Ramilowski JA, Yip CW, Agrawal S, et al. Functional annotation of human long noncoding RNAs via molecular phenotyping. Genome Res. 2020;30(7):1060–1072. doi:10.1101/gr.254219.119
- Li D, Tang X, Li M, Zheng Y. Long noncoding RNA DLX6-AS1 promotes liver cancer by increasing the expression of WEE1 via targeting miR-424-5p. J Cell Biochem. 2019;120(8):12290–12299. doi:10.1002/jcb.28493
- Jin Z, Jiang S, Jian S, Shang Z. Long noncoding RNA MORT overexpression inhibits cancer cell proliferation in oral squamous cell carcinoma by downregulating ROCK1. J Cell Biochem. 2019;120(7):11702–11707. doi:10.1002/jcb.28449
- Wu L, Zhu L, Li Y, Zheng Z, Lin X, Yang C. LncRNA MEG3 promotes melanoma growth, metastasis and formation through modulating miR-21/E-cadherin axis. Cancer Cell Int. 2020;20(1):12. doi:10.1186/s12935-019-1087-4
- Tian Y, Zhang X, Hao Y, Fang Z, He Y. Potential roles of abnormally expressed long noncoding RNA UCA1 and Malat-1 in metastasis of melanoma. Melanoma Res. 2014;24(4):335–341. doi:10.1097/CMR.0000000000000080
- Atianand MK, Caffrey DR, Fitzgerald KA. Immunobiology of Long Noncoding RNAs. Annu Rev Immunol. 2017;35(1):177–198. doi:10.1146/annurev-immunol-041015-055459
- Chen YG, Satpathy AT, Chang HY. Gene regulation in the immune system by long noncoding RNAs. Nat Immunol. 2017;18(9):962–972. doi:10.1038/ni.3771
- Peng D, Wang L, Li H, et al. An immune infiltration signature to predict the overall survival of patients with colon cancer. IUBMB Life. 2019;71(11):1760–1770. doi:10.1002/iub.2124
- Zhang B, Wang Q, Fu C, Jiang C, Ma S. Exploration of the immune-related signature and immune infiltration analysis for breast ductal and lobular carcinoma. Ann Transl Med. 2019;7(23):730. doi:10.21037/atm.2019.11.117
- Wei Z-W, Wu J, Huang W-B, et al. Immune-infiltration based signature as a novel prognostic biomarker in gastrointestinal stromal tumour. EBioMedicine. 2020;57:102850. doi:10.1016/j.ebiom.2020.102850
- Zhang Y, Zhang L, Xu Y, Wu X, Zhou Y, Mo J. Immune-related long noncoding RNA signature for predicting survival and immune checkpoint blockade in hepatocellular carcinoma. J Cell Physiol. 2020;235(12):9304–9316. doi:10.1002/jcp.29730
- Li Z, Li Y, Wang X, Yang Q. Identification of a Six-Immune-Related Long Non-coding RNA Signature for Predicting Survival and Immune Infiltrating Status in Breast Cancer. Front Genet. 2020;11:680. doi:10.3389/fgene.2020.00680
- Jiang Y, Gou X, Wei Z, et al. Bioinformatics profiling integrating a three immune-related long non-coding RNA signature as a prognostic model for clear cell renal cell carcinoma. Cancer Cell Int. 2020;20(1):166. doi:10.1186/s12935-020-01242-7
- Song Y, Jin D, Chen J, et al. Identification of an immune-related long non-coding RNA signature and nomogram as prognostic target for muscle-invasive bladder cancer. Aging. 2020;12(12):12051–12073. doi:10.18632/aging.103369
- Lv Y, Lin S-Y, Hu -F-F, et al. Landscape of cancer diagnostic biomarkers from specifically expressed genes. #N/A. 2020;21(6):2175–2184.
- Zhang W, Zhang J, Yan W, et al. Whole-genome microRNA expression profiling identifies a 5-microRNA signature as a prognostic biomarker in Chinese patients with primary glioblastoma multiforme. Cancer. 2013;119(4):814–824. doi:10.1002/cncr.27826
- Lossos IS, Czerwinski DK, Alizadeh AA, et al. Prediction of survival in diffuse large-B-cell lymphoma based on the expression of six genes. N Engl J Med. 2004;350(18):1828–1837. doi:10.1056/NEJMoa032520
- Heagerty PJ, Lumley T, Pepe MS. Time-dependent ROC curves for censored survival data and a diagnostic marker. Biometrics. 2000;56(2):337–344. doi:10.1111/j.0006-341X.2000.00337.x
- Jenkins RW, Fisher DE. Treatment of Advanced Melanoma in 2020 and Beyond. J Invest Dermatol. 2021;141(1):23–31. doi:10.1016/j.jid.2020.03.943
- Darmawan CC, Jo G, Montenegro SE, et al. Early detection of acral melanoma: a review of clinical, dermoscopic, histopathologic, and molecular characteristics. J Am Acad Dermatol. 2019;81(3):805–812. doi:10.1016/j.jaad.2019.01.081
- Gruss I, Twardowski JP, Cierpisz M. The Effects of Locality and Host Plant on the Body Size of (Thysanoptera: aeolothripidae) in the Southwest of Poland. Insects. 2019;10(9):266. doi:10.3390/insects10090266
- Yang S, Xu J, Zeng X. A six-long non-coding RNA signature predicts prognosis in melanoma patients. Int J Oncol. 2018;52(4):1178–1188. doi:10.3892/ijo.2018.4268
- Shen Y, Peng X, Shen C. Identification and validation of immune-related lncRNA prognostic signature for breast cancer. Genomics. 2020;112(3):2640–2646. doi:10.1016/j.ygeno.2020.02.015
- Hong W, Liang L, Gu Y, et al. Immune-Related lncRNA to Construct Novel Signature and Predict the Immune Landscape of Human Hepatocellular Carcinoma. Mol Ther Nucleic Acids. 2020;22:937–947. doi:10.1016/j.omtn.2020.10.002
- Wei C, Liang Q, Li X, et al. Bioinformatics profiling utilized a nine immune-related long noncoding RNA signature as a prognostic target for pancreatic cancer. J Cell Biochem. 2019;120(9):14916–14927. doi:10.1002/jcb.28754
- Guo ZH, Yao LT, Guo AY. Clinical and biological impact of LINC02544 expression in breast cancer after neoadjuvant chemotherapy. Eur Rev Med Pharmacol Sci. 2020;24(20):10573–10585. doi:10.26355/eurrev_202010_23413
- Jin D, Song Y, Chen Y, Zhang P. Identification of a Seven-lncRNA Immune Risk Signature and Construction of a Predictive Nomogram for Lung Adenocarcinoma. #N/A. 2020;2020:7929132.
- Yu S, Li N, Wang J, et al. Correlation of Long Noncoding RNA SEMA6A-AS1 Expression with Clinical Outcome in HBV-Related Hepatocellular Carcinoma. Clin Ther. 2020;42(3):439–447. doi:10.1016/j.clinthera.2020.01.012
- Lv Y, Wei W, Huang Z, et al. Long non-coding RNA expression profile can predict early recurrence in hepatocellular carcinoma after curative resection. Hepatology Res. 2018;48(13):1140–1148. doi:10.1111/hepr.13220
- Zhong Z, Hong M, Chen X, et al. Transcriptome analysis reveals the link between lncRNA-mRNA co-expression network and tumor immune microenvironment and overall survival in head and neck squamous cell carcinoma. BMC Med Genomics. 2020;13(1):57. doi:10.1186/s12920-020-0707-0
- Cheng F, Liu J, Zhang Y, et al. Long Non-Coding RNA UBA6-AS1 Promotes the Malignant Properties of Glioblastoma by Competitively Binding to microRNA-760 and Enhancing Homeobox A2 Expression. Cancer Manag Res. 2021;13:379–392. doi:10.2147/CMAR.S287676
- Aran D, Hu Z, Butte AJ. xCell: digitally portraying the tissue cellular heterogeneity landscape. Genome Biol. 2017;18(1):220. doi:10.1186/s13059-017-1349-1
- Li T, Fan J, Wang B, et al. TIMER: a Web Server for Comprehensive Analysis of Tumor-Infiltrating Immune Cells. Cancer Res. 2017;77(21):e108–e110. doi:10.1158/0008-5472.CAN-17-0307
- Finotello F, Mayer C, Plattner C, et al. Molecular and pharmacological modulators of the tumor immune contexture revealed by deconvolution of RNA-seq data. Genome Med. 2019;11(1):34. doi:10.1186/s13073-019-0638-6
- Plattner C, Finotello F, Rieder D. Deconvoluting tumor-infiltrating immune cells from RNA-seq data using quanTIseq. Methods Enzymol. 2020;636:261–285.
- Dienstmann R, Villacampa G, Sveen A, et al. Relative contribution of clinicopathological variables, genomic markers, transcriptomic subtyping and microenvironment features for outcome prediction in stage II/III colorectal cancer. Ann Oncol. 2019;30(10):1622–1629. doi:10.1093/annonc/mdz287
- Racle J, de Jonge K, Baumgaertner P, Speiser DE, Gfeller D. Simultaneous enumeration of cancer and immune cell types from bulk tumor gene expression data. Elife. 2017;6:6. doi:10.7554/eLife.26476
- Tamminga M, Hiltermann TJN, Schuuring E, Timens W, Fehrmann RS, Groen HJ. Immune microenvironment composition in non-small cell lung cancer and its association with survival. Clin Transl Immunol. 2020;9(6):e1142. doi:10.1002/cti2.1142
- Chen B, Khodadoust MS, Liu CL, Newman AM, Alizadeh AA. Profiling Tumor Infiltrating Immune Cells with CIBERSORT. Methods Mol Biol. 2018;1711:243–259.
- Zhang H, Li R, Cao Y, et al. Poor Clinical Outcomes and Immunoevasive Contexture in Intratumoral IL-10-Producing Macrophages Enriched Gastric Cancer Patients. Ann Surg. 2020. doi:10.1097/SLA.0000000000004037
- Qian J, Olbrecht S, Boeckx B, et al. A pan-cancer blueprint of the heterogeneous tumor microenvironment revealed by single-cell profiling. Cell Res. 2020;30(9):745–762. doi:10.1038/s41422-020-0355-0