
Abstract
Introduction
Genetic variability in genes encoding drug-metabolizing enzymes may contribute to the heterogeneity of drug responses in different populations. Extensive research in pharmacogenomics in major populations around the world provides us with a great deal of information about drug-related genetic polymorphisms.
Objective
The purpose of this study was to detect the genetic variation of drug-metabolism-related genes in the five ethnic minorities Daur, Hezhen, Ewenki, Mongolian and Manchu in China, and to analyze the distribution differences among ethnic groups.
Methods
We genotyped 32 SNPs of drug metabolism genes in 882 healthy Chinese volunteers from five ethnic groups. The genotype frequency and allele frequency of the five ethnic groups were calculated, and the different variants among the five ethnic groups were compared by chi-square test. Genetic parameters were analyzed using Popgene software. The genetic structure of five ethnic minorities was analyzed by principal component analysis, and compared with 26 populations.
Results
We found that SNPs of genes related to drug metabolism existed diversity in different populations. Among them, rs8192766 and rs9419082 in CYP2E1 showed statistical differences between Daur and Manchu, and NAT2 rs1801280 showed statistical differences between Hezhen and Mongolian. In addition, the five populations we studied had the smallest differences with EAS populations. There was haplotype diversity in CHST3, VKORC1, CYP1A2 and CYP2E1 genes in the five ethnic minorities, and these haplotype polymorphisms were related to the use of corresponding drug doses. Cluster analysis shows that the five ethnic minorities in Heilongjiang Province are clustered together with the EAS populations.
Conclusion
These results suggest that understanding the diversity of drug-related genetic markers is critical for individualized drug gene therapy programs in ethnic minorities in China as well as in populations highly mixed with these ethnic groups.
Introduction
In recent years, the safety and efficacy of drugs are important factors of concern in clinical treatment and drug development.Citation1,Citation2 A study conducted by the World Health Organization shows that about one-third of the deaths of patients worldwide each year are closely related to the irrational use of drugs.Citation3 In China, unreasonable drug use phenomenon is also quite prominent. It has been reported that at least 2 million people are hospitalized due to adverse drug reactions every year, and about 200,000 people die as a result.Citation4 In addition, adverse drug reactions also cause huge costs to the pharmaceutical industry. In recent decades, with the development of the association between pharmacogenomics and population genetics and the completion of the Human Genome Project, many studies have begun to focus on the genetic basis of individual differences in drug response.Citation5,Citation6 It is gradually recognized that the heterogeneity of drug response in different individuals is mainly due to the differences of drug metabolism-related genes.Citation2,Citation5,Citation7,Citation8 Therefore, the exploration of drug-metabolism-related gene polymorphism is beneficial to optimize drug selection and dosage, and provides the theoretical basis for personalized medicine.Citation9
Drug metabolism involves the interaction of various drug metabolism enzymes, including stage Phase I enzymes, Phase II conjugation enzymes, transporters, cytochrome reductases, and nuclear receptors. One of the most important drug metabolism enzymes is the cytochrome P450 (CYP) family. CYP1A2, CYP2C19, CYP2D6 and CYP3A4/5 are the main human enzymes involved in drug metabolism and metabolize most clinical drugs.Citation10 However, SNPs of these drug-metabolism-related genes may lead to changes in mRNA activity, gene expression, and even translation or splicing, leading to genetic polymorphisms in drug metabolism among different individuals or populations.Citation11–Citation14 For example, rs4244285 and rs4986893 of CYP2C19 gene are the most common major mutations in the Chinese population, which have been shown to profoundly affect the uptake of clopidogrel for the treatment of coronary artery disease, and ultimately affect drug response polymorphism.Citation6 In addition, individuals with allelic variants may exhibit one of the following metabolic phenotypes: poor metabolizers (PM; A combination of alleles with no function or reduced function and individuals with low or no enzyme activity), intermediate metabolizers (IM; Individuals with a combination of normal and reduced functional alleles that cause reduced enzyme activity); normal metabolizers (NM; Individuals with two normal alleles and full functional enzyme activity) or rapid and ultra-rapid metabolizers (UM; individuals with two increased function alleles or more than two normal function alleles).Citation15 Studies have shown that due to the differences in genetic backgrounds of different populations, the distribution of some gene metabolic phenotypes presents corresponding population differences.Citation2,Citation16–Citation18
However, most genetic studies (eg, GWAS) focus on populations of European and African origin, while genetic studies in China are dominated by Han nationality.Citation19–Citation22 In China, where many ethnic groups live in compact communities, different ethnic groups have different genetic backgrounds. For example, the Mongolians are a minority ethnic group with a large population in China, and they are significantly different from other ethnic groups in terms of facial features. Similar to the Mongolians, the Daur, Hezhen, Ewenki and Manchu have different genetic backgrounds and the diversity of their environment, including pharmacogenetic difference.Citation9 Previous studies have compared allele and genotype polymorphisms in ADME in several populations (Tajik, Uygur, Kazak, Kirgiz and Hui).Citation2,Citation9 In this study, we investigated the genetic diversity of drug metabolism genes of Daur, Hezhen, Ewenki, Mongolian and Manchu, in an attempt to identify highly different SNPs and further explore their clinical significance.Citation2
Materials and Methods
Study Participants
We recruited 882 volunteers (413 males, 469 females, 45 average age) from Daur (n = 233), Hezhen (n = 250), Ewenki (n = 73), Mongolian (n = 106) and Manchu (n = 220) nationalities in China. Participants from all five ethnic groups were from Heilongjiang province in China. Each participant signed an informed consent form. Each subject has at least three generations of the same ethnic origin, minimizing known environmental and therapeutic factors that affect genetic variation. The study was approved by the Ethics Committee of Harbin Medical University and carried out in strict accordance with the Helsinki Declaration. In addition, we collected and downloaded raw genotype data of 2504 individuals in 26 population groups globally from Ensemble database at http://grch37.ensembl.org/Homo_sapiens/Tools/DataSlicer for follow-up analysis. Explanations of abbreviations for different groups are shown in Supplementary Table 1.
DNA Extraction and Concentration Determination
An appropriate amount of peripheral blood samples were taken from the participants. DNA was extracted from the peripheral blood of 882 subjects using the QIAamp DNA Blood Mini Kit (Qiagen, Hilden, Germany) as recommended by the manufacturer. Concentration and purity of DNA are measured using NanoDrop One spectrophotometer (Thermolyne, Thermo Fisher Scientific, Madison, USA). Genotyping was performed using the SNPscan™ Kit (Genesky Biotechnologies Inc., Shanghai, China) according to the manufacturer’s instructions.
Variant Selection and Genotyping
From SNP database, PharmGKB database and published literature,Citation2,Citation23 relatively important SNPs related to drug metabolism were screened according to the following principles: First, Very Important Pharmacogenes (VIP) variants in PharmGKB database were searched. We screened out clinically relevant variants with a high level of clinical annotation. Then we used dbSNP database to conduct frequency search for the screened variants, and retained the variants with altered alleles greater than 0.05 in the Han population of Beijing, China (CHB), in order to increase the statistical efficacy.Citation24 Finally, PGx biomarkers that have been reported and recommended for drug dose adjustment by global drug regulatory agencies are selected as candidate SNPs from these SNPs according to published literature.Citation25 Based on the above criteria and methods, we used SNPscanTM technology to genotype candidate SNPs, and excluded those SNPs that could not be successfully genotyped. Finally, 32 SNPs in 10 genes were reserved as research objects.
Statistical Analyses
The test of Hardy-Weinberg equilibrium (HWE) and haplotype were estimated using the Haploview 4.2. Chi-square test was used to assess the allele differences between two ethnic groups. We performed multiple corrections using Bonferroni. Subsequently, genetic diversity was analyzed using Population Genetic Analysis (version Popgene32) software. R i386 4.0.2 software was used to plot the principal component analysis (PCA) based on raw genotype and allele frequency, respectively. Phylogenetic neighbor-joining (NJ) tree was reconstructed by MEGA7 software v5.0 using Dendrogram index.
Results
The Allele Frequencies of 32 Variants in Different Ethnic Populations
The genotype statistics in overall population is shown in , and the results show that all SNPs meet the Hardy-Weinberg equilibrium. The allele frequencies of five ethnic minorities from this study and 26 populations from the 1000 Genome Project are shown in Supplementary Table 2.
Table 1 Genotype Count and HWP of 882 Individuals
Pairwise Comparison of Five Ethnic Populations Screened for Differential SNP
In addition, we compared the SNPs of five ethnic minorities in pairs. After Bonferroni correction (0.05/(32*5)), the results showed in Supplementary Table 3 that rs9419082 and rs8192766 of CYP2E1 gene had statistical difference between Daur and Manchu, and rs1801280 of NAT2 gene had statistical difference between Hezhen and Mongolian.
Five Ethnic Populations Were Compared with 26 Populations to Screen the Difference SNP
When Daur was compared with 26 populations (Supplementary Table 4), except for CHB, JPT and MSL, rs28360521 in CYP2D6 gene was significantly different after Bonferroni correction (0.05/(32*27)). In addition, the allele frequency of Daur population was the least different from EAS populations, but the most different from AFR populations. When Ewenki population is compared with East Asian populations (Supplementary Table 5), rs28360521 of CYP2D6 gene is statistically different from KHV, rs8192766 of CYP2E1 gene is statistically different from CDX after Bonferroni correction (0.05/(32*27)). In addition, the alleles of Ewenki were the most different from AFR and EUR, and the least different from EAS population. After Bonferroni correction (0.05/(32*27)), rs4148943 and rs730720 in CHST3 gene in Manchu were statistically different from AFR, AMR, EUR and GIH populations when compared with 26 populations (Supplementary Table 6). Except EAS and BEB, CYP1A1 rs4646421 was statistically different from other 20 populations in Manchu after Bonferroni correction (0.05/(32*27)). After Bonferroni correction (0.05/(32*27)), CYP2C19 rs12248560 showed statistical difference between Manchu and 20 populations, except EAS and PEL when compared with 26 populations. In addition, as shown in Supplementary Table 7 and Supplementary Table 8, when comparing with the 26 populations, both Hezhen and Mongolian have a large difference with AFR, AMR, EUR and SAS, but a small difference with EAS, after Bonferroni correction (0.05/(32*27)).
Haplotype Analysis of Five Ethnic Populations
The haplotype block was constructed by Haploview software with D’ >0.8. The results show that the distribution of haplotype among the five ethnic groups was different. As shown in , one block of five SNPs located in the CHST3 gene was constructed, and the most prevalent haplotype was CCGGC, followed by TTAAT, TCGGT. The results showed that the frequency distributions of CCGGC and TTAAT in Ewenki vs Daur populations and Mongolian vs Ewenki populations were statistically significant (P<0.005). The second block consists of four SNPs in the VKORC1 gene, the most prevalent haplotype was CAGA, followed by TGCG. The CAGA haplotype frequencies in Manchu vs Mongolian, Ewenki vs Daur, Hezhen vs Daur, Manchu vs Ewenki and Hezhen vs Manchu are statistically in the comparison of the differences, and TGCG haplotype frequency only in Ewenki vs Daur and Hezhen vs Manchu two comparison differences statistically. The third block includes three SNPs in the CYP1A2 gene. AGC is the main haplotype in the five ethnic minorities, followed by CGC and AAT. AGC haplotype showed the most statistical difference between Manchu and Mongolian (P<0.005). The haplotype of CGC were statistically different between Manchu and Mongolian, Hezhen and Mongolian, and Mongolian and Daur. The haplotype of AAT were statistically different between Mongolian and Daur and between Hezhen and Ewenki. The fourth block includes three SNPs in the CYP2E1 gene. The main haplotype in the five nationalities is GTC, followed by AGT and AGC, among which the GTC haplotype showed statistical differences in the comparison of Manchu vs Mongolian, Hezhen vs Daur and Hezhen vs Manchu. The haplotype of AGT were only statistically different between the Manchu and the Mongolian, and the haplotype of AGC were statistically different between Hezhen vs Mongolian and Hezhen vs Daur.
Table 2 Composition and Frequency Distribution of Haplotypes of Five Nationalities
Significant Difference SNP and Drug Related Information
In addition, from the PharmGKB database, we found that the basic drug-related information for loci with statistical differences is summarized in Supplementary Table 9. Different genotype compositions of rs8192766 and rs4646421 did not affect the increased risk of bladder tumors associated with caffeine exposure. Rs1801280 was associated with cisplatin or cyclophosphamide, but CC genotype was not associated with an increased risk of anemia in women treated with cisplatin and cyclophosphamide compared with the TT genotype. Rs4148943 and rs730720 in CHST3 gene are associated with docetaxel and thalidomide, and allele changes of these two variants can affect the treatment risk of prostate patients. For rs12248560, located on CYP2C19, the T allele was associated with an increased risk of bleeding in patients with coronary artery disease treated with clopidogrel when compared with the C allele. So far, the relationship between CYP2E1 rs9419082 and drugs has not been reported in literature.
Further, we made a linear distribution of the frequency of rs8050894 G allele and rs9934438 G allele in VKORC1 gene in five populations and 26 populations, as shown in Supplementary Figure 1. The results showed that rs8050894 G allele frequency in EAS population was higher than that in other regions of the world, while rs9934438 G allele frequency in East Asian population was lower than that in other regions of the world. The distribution of these two alleles in five different populations we studied was consistent with that in EAS populations.
Genetic Parameters of Five Populations
Popgene software was used to calculate the genetic parameters among five ethnic groups in Heilongjiang Province. First of all, the heterozygosity statistics of all loci in the five ethnic groups are shown in . The average heterozygotic value of 32 SNPs in five populations was 0.2494. Rs28360521 located on CYP2D6 gene has a relatively large heterozygosity, while rs12248560 located on CYP2C19 gene has the smallest heterozygosity. As shown in , the genetic distances of Nei’s for pair-for-pair-comparison of the five ethnic minorities ranged from 0.0018 to 0.0051. The upper part of the diagonal is the genetic consistency. The larger the value is, the higher the consistency is between the two populations. The consistency value of Hezhen and Manchu is 0.9982, indicating that the genetic consistency of Hezhen and Manchu is higher. The lower part of the diagonal is the genetic distance, the higher the value is, the farther the relationship is. The maximum value of the genetic distance between Ewenki and Manchu is 0.0051.
Table 3 Summary of Heterozygosity Statistics for All Loci in Five Ethnic Populations
Table 4 Nei’s Unbiased Measures of Genetic Identity and Genetic Distance
Analysis of Genetic Structure and Population Membership
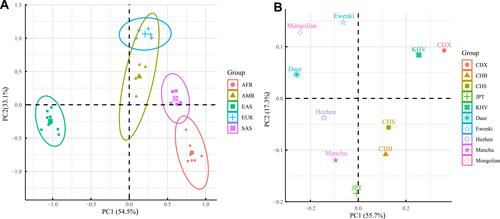
Here, we conducted a population genetic analysis of the five ethnic minorities. We performed a series of principal component analyses (PCA) based on allele frequencies of 32 SNPs in the Daur, Hezhen, Ewenki, Mongolian, and Manchu populations in the Heilongjiang province and in 26 populations from 1000 Genome Project. shows the PCA plot of five ethnic groups from Heilongjiang Province and 26 populations divided into AFR, AMR, EAS, EUR and SAS groups. PC1 and PC2 accounted for 54.5% and 33.1% of the total genetic variation. The results showed that the population of different continents is clearly stratified. The five ethnic minorities in Heilongjiang Province were clustered together with EAS. In addition, shows the results of principal component analysis of 5 ethnic minorities in Heilongjiang Province and 5 populations in EAS. PC1 accounted for 55.7% of the total genetic variation, which differentiated the ten populations with a north-south trend. PC2 accounted for 17.3% of the total genetic variation. The results showed that the genetic distance between Daur and Mongolian was close, the genetic distance between Manchu and Hezhen was close, CHS was closely related to CHB, and CDX was closely related to KHV.
Figure 1 Principal component analysis. (A) Principal component analysis was performed on 3386 individuals using 32 SNPs from 31 populations. (B) Principal component analysis was performed using 32 SNPs from 10 populations in East Asia.
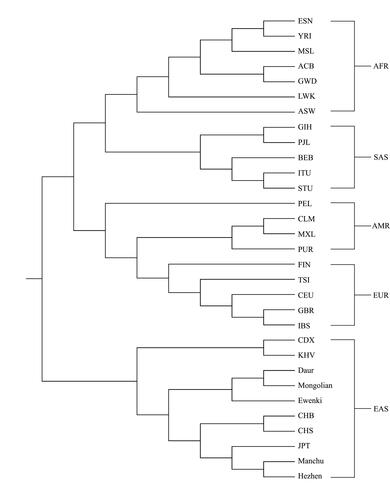
To further explore the genetic clustering of each ethnic group, we used Popgene to calculate a Dendrogram index and clustered the 5 ethnic populations and 26 populations from the 1000 Genome Project via MEGA. As shown in , when the phylogenetic tree was constructed based on 31 populations, five main clusters were identified: African cluster, American cluster, European cluster, South Asian cluster and East Asian cluster. Five ethnic minority population from Heilongjiang Province in China were dispersed in the East Asian population, which was consistent with the results of principal component analysis. In the East Asian branch, on the one hand, the Manchu and Hezhen ethnic groups cluster together, which then converges with JPT, while CHB and CHS cluster together, on the other hand, the Daur and Mongolian cluster together, which then converges with Ewenki, and CDX and KHV cluster together.
Figure 2 Phylogenetic trees of 31 populations from around the world.
Discussion
In recent decades, with the completion of three major projects, namely the Human Genome Project, the International Human Genome Haplogram Project and the International 1000 Genome Project, many studies of human genetic diversity around the world have inferred the global distribution of pharmacogenomic variation and defined its population structure, which is consistent with the geographical location of the population.Citation26–Citation29 However, previous studies in China have been limited to the Han population and a small minority of ethnic groups. In the present study, genetic polymorphisms of drug-metabolism-related genes were analyzed in 5 ethnic groups in northern China and 26 populations (from 1000 genomic databases) from around the world. The results showed that the allele frequencies of 32 SNPs in 10 genes were different among these populations. This study not only provides useful genomic diversity data for the further study of pharmacogenomics among these populations, but also reveals the reasons for heterogeneity of drug responses in populations of different ethnic origins.
Among the statistically significant drug-metabolism-related gene polymorphisms we analyzed, most of them were located in CYP450 gene, the most important first-stage drug metabolism gene.Citation30 Many studies have proven that genetic variation of CYP450 gene was associated with drug metabolism in different diseases.Citation10,Citation31,Citation32 In 2013, P. Maisano Delser et al showed that the locus encoding cytochrome P450s showed a significantly higher level of genetic diversity among populations than other gene categories.Citation26 In the present study, SNPs rs8192766 and rs9419082, located on CYP2E1 gene, had different distribution among populations although after multiple comparisons. The CYP2E1 gene encodes enzymes that are involved in the metabolism and biological activation of a large number of low molecular compounds. Studies have shown that the loci of rs8192766 of CYP2E1 gene polymorphisms in Chinese Han population have a significant statistical relationship with schizophrenia susceptibility.Citation33 Therefore, it is reasonable to speculate that the five ethnic groups may have different levels of schizophrenia susceptibility due to rs8192766 locus polymorphism. In addition, the enzyme encoded by CYP2C19 gene is involved in the metabolism of clopidogrel, a commonly used drug for the treatment of coronary artery disease in clinical practice. Previous results showed that more than 50% of the carriers of the IM type of CYP2C19 were in the Han, Tibetan and Miao ethnic groups, while more than 30% of the UM type of CYP2C19 were in the Uygur and Kazak ethnic groups. In this study, SNPs of CYP2C19 gene showed significant differences in allele frequencies among different populations, so CYP2C19 gene testing should be carried out prior to corresponding drug treatment in accordance with FDA’s warning.Citation34 Therefore, the heterogeneity of metabolic types should be considered when different populations take drugs to prevent the occurrence of adverse drug reactions. Based on the results of previous pharmacogenetic observation, further studies on the genetic variants related to important drug metabolism in different regions of the population may have new findings, which may help to predict the general drug response of individuals or the trend of drug response of the population.
Widespread diversity is also shown when the haplotypes of the five ethnic groups are considered. We mainly found four haplotypes of diversity, which were located on CHST3, VKORC1, CYP1A2 and CYP2E1 genes. Five SNPs in CHST3 gene (rs4148943, rs1871450, rs4148950, rs730720, rs4148945) were associated with the sensitivity of Docetaxel and Thalidomide to the clinical treatment of prostate cancer. Both drugs were most effective when the haplotype composition of the five polymorphic loci was “CTTCC”.Citation14 Although there were five minority loci without such haplotype, alleles at each locus of the haplotype affected the metabolism of Docetaxel and Thalidomide. Therefore, we strongly recommend that different groups of prostate cancer patients conduct genetic testing before using these two drugs, so as to prevent the occurrence of adverse reactions and optimize the efficacy of the drugs according to the actual situation of the patients. The SNPs of rs7294, rs2359612, rs8050894 and rs9934438 on VKORC1 gene are all correlated with the sensitivity of warfarin, a drug used in the clinical treatment of thromboembolic diseases. When the alleles of rs7294, rs2359612, rs805894 and rs9934438 are “G”, “T”, “G” and “C” respectively, the effective warfarin dose required by thromboembolism patients is lower.Citation9,Citation12,Citation35,Citation36 The FDA has specified that the use of warfarin in clinical trials should be subject to genetic testing for VKORC1.Citation34 Our research data made up for the lack of pharmacogenomic data among Chinese ethnic minorities, and provided negligible help for the clinical medication of five ethnic minorities in Heilongjiang Province, China.
Through population genetic clustering analysis, the distribution of different populations was further clarified. Most populations are clustered according to their geographic locations in Asia, Europe, Africa, and the Americas. In this study, PCA results show that five ethnic minorities in Heilongjiang Province, China are associated with East Asian groups, which may be due to the geographical location of Heilongjiang Province in Northern China and East Asia resulting in a possible genetic fusion. This fusion increases the genetic diversity of genes. In addition, the principal component analysis of the five ethnic minorities found that the Daur ethnic group was close to the Mongolian ethnic group, which was consistent with the results of phylogenetic tree. Interestingly, the distribution of drug-metabolism-related genes is consistent with the human linguistic language population and its origins. Five ethnic groups in this study show clear language clustering tendency, Daur and Mongolian belong to the Altai language family - The Mongolian languages, Manchu and Hezhen nationality belong to the Altaic - Manchu-Tungusic languages, the Ewenki people also belong to the Altai language family with the Tungusic languages but its branch of Bei language.Citation37 Interestingly, the grouping of this linguistic family is consistent with the clustering results of this study. Consequently, our data may provide a basis for future studies on drug metabolism and clinical treatment of ethnic groups with different population structures.
Nevertheless, there are still many defects in this study, the first of which is the limitation of sample size. Secondly, the target variants of this study were not comprehensive enough, and only a small number of pharmacogenetic variants were studied. Last but not least, the relationship between genetic variants of different populations and complex diseases still needs to be explored in depth, so as to improve drug efficacy in clinical drug therapy, reduce adverse drug reactions, and promote drug development and clinical rational drug use and precision medicine.Citation38
Conclusion
In conclusion, our results demonstrate that SNPs in drug metabolism-related genes are similar and heterogeneous in five ethnic groups. At the pharmacogenomic level, five ethnic groups in Heilongjiang province clustered with East Asians. The genetic distance between Daur and Mongolian is the closest, followed by Ewenki, and the genetic distance between Hezhen and Manchu is also close. We believe that pharmacogenomic differences between different populations should be paid attention to, and genetic testing should be conducted before the treatment of corresponding drugs, so as to improve the availability of drugs.
Ethics Approval and Informed Consent
This study was approved by the Ethics Committee of Harbin Medical University. All volunteers signed informed consent prior to participating.
Consent for Publication
The authors have declared that they agreed to publish.
Author Contributions
All authors made a significant contribution to the work reported, whether that is in the conception, study design, execution, acquisition of data, analysis and interpretation, or in all these areas; took part in drafting, revising or critically reviewing the article; gave final approval of the version to be published; have agreed on the journal to which the article has been submitted; and agree to be accountable for all aspects of the work.
Acknowledgments
All participants in this study are appreciated for their valuable contributions.
Disclosure
The authors declare that they have no competing interests in this work.
References
- Zhou Y, Lauschke VM. Comprehensive overview of the pharmacogenetic diversity in Ashkenazi Jews. J Med Genet. 2018;55(9):617–627. doi:10.1136/jmedgenet-2018-105429
- Li J, Lou H, Yang X, et al. Genetic architectures of ADME genes in five Eurasian admixed populations and implications for drug safety and efficacy. J Med Genet. 2014;51(9):614–622. doi:10.1136/jmedgenet-2014-102530
- Donaldson LJ, Kelley ET, Dhingra-Kumar N, et al. Medication without harm: WHO’s Third global patient safety challenge. Lancet. 2017;389(10080):1680–1681. doi:10.1016/S0140-6736(17)31047-4
- Wester K, Jonsson AK, Spigset O, et al. Incidence of fatal adverse drug reactions: a population based study. Br J Clin Pharmacol. 2008;65(4):573–579. doi:10.1111/j.1365-2125.2007.03064.x
- Chowbay B, Zhou S, Lee EJD. An interethnic comparison of polymorphisms of the genes encoding drug-metabolizing enzymes and drug transporters: experience in Singapore. Drug Metab Rev. 2005;37(2):327–378. doi:10.1081/DMR-28805
- Zuo LJ, Guo T, Xia DY, et al. Allele and genotype frequencies of CYP3A4, CYP2C19, and CYP2D6 in Han, Uighur, Hui, and Mongolian Chinese populations. Genet Test Mol Biomarkers. 2012;16(2):102–108. doi:10.1089/gtmb.2011.0084
- Kuehl P, Zhang J, Lin Y, et al. Sequence diversity in CYP3A promoters and characterization of the genetic basis of polymorphic CYP3A5 expression. Nat Genet. 2001;27(4):383–391. doi:10.1038/86882
- Zhang C, Jiang X, Chen W, et al. Population genetic difference of pharmacogenomic VIP gene variants in the Lisu population from Yunnan Province. Medicine. 2018;97(52):e13674. doi:10.1097/MD.0000000000013674
- Jin T, Zhao R, Shi X, et al. Genetic polymorphisms study of pharmacogenomic VIP variants in Han ethnic of China’s Shaanxi province. Environ Toxicol Pharmacol. 2016;46:27–35. doi:10.1016/j.etap.2016.06.026
- McGraw J, Waller D. Cytochrome P450 variations in different ethnic populations. Expert Opin Drug Metab Toxicol. 2012;8(3):371–382. doi:10.1517/17425255.2012.657626
- Magalon H, Patin E, Austerlitz F, et al. Population genetic diversity of the NAT2 gene supports a role of acetylation in human adaptation to farming in Central Asia. Eur J Hum Genet. 2008;16(2):243–251. doi:10.1038/sj.ejhg.5201963
- Sun B, Wen YF, Culhane-Pera KA, et al. Differences in predicted warfarin dosing requirements between Hmong and East Asians using genotype-based dosing algorithms. Pharmacotherapy. 2021;41(3):265–76. doi:10.1002/phar.2487
- Yan M, Li D, Zhao G, et al. Genetic polymorphisms of pharmacogenomic VIP variants in the Yi population from China. Gene. 2018;648:54–62. doi:10.1016/j.gene.2018.01.040
- Deeken JF, Cormier T, Price DK, et al. A pharmacogenetic study of docetaxel and thalidomide in patients with castration-resistant prostate cancer using the DMET genotyping platform. Pharmacogenomics J. 2010;10(3):191–199. doi:10.1038/tpj.2009.57
- Rajman I, Knapp L, Morgan T, et al. African genetic diversity: implications for cytochrome P450-mediated drug metabolism and drug development. EBioMedicine. 2017;17:67–74. doi:10.1016/j.ebiom.2017.02.017
- Zanger UM, Schwab M. Cytochrome P450 enzymes in drug metabolism: regulation of gene expression, enzyme activities, and impact of genetic variation. Clin Pharmacol Ther. 2013;138(1):103–141.
- Jin T, Aikemu A, Zhang M, et al. Genetic polymorphisms analysis of pharmacogenomic VIP variants in Miao ethnic group of Southwest China. Med Sci Monit. 2015;21:3769–3776. doi:10.12659/MSM.895191
- Zhang J, Jin T, Yunus Z, et al. Genetic polymorphisms of VIP variants in the Tajik ethnic group of northwest China. BMC Genet. 2014;15(1):102. doi:10.1186/s12863-014-0102-y
- Gudbjartsson DF, Helgason H, Gudjonsson SA, et al. Large-scale whole-genome sequencing of the Icelandic population. Nat Genet. 2015;47(5):435–444. doi:10.1038/ng.3247
- Hehir-Kwa JY, Marschall T, Kloosterman WP, et al. A high-quality human reference panel reveals the complexity and distribution of genomic structural variants. Nat Commun. 2016;7(1):12989. doi:10.1038/ncomms12989
- MacArthur J, Bowler E, Cerezo M, et al. The new NHGRI-EBI catalog of published genome-wide association studies (GWAS Catalog). Nucleic Acids Res. 2017;45(D1):D896–D901. doi:10.1093/nar/gkw1133
- Gao Y, Zhang C, Yuan L, et al. PGG.Han: the Han Chinese genome database and analysis platform. Nucleic Acids Res. 2020;48(D1):D971–D6. doi:10.1093/nar/gkz829
- Zhang J, Wang H, Niu G, et al. Deciphering DMET genetic data: comprehensive assessment of Northwestern Han, Tibetan, Uyghur populations and their comparison to eleven 1000 genome populations. Artif Cell Nanomed B. 2019;46(sup3):S1176–S85. doi:10.1080/21691401.2018.1533849
- Chen W, Ding H, Cheng Y, et al. Genetic polymorphisms analysis of pharmacogenomic VIP variants in Bai ethnic group from China. Mol Genet Genomic Med. 2019;7(9):e884. doi:10.1002/mgg3.884
- Rodrigues JCG, Fernandes MR, Guerreiro JF, et al. Polymorphisms of ADME-related genes and their implications for drug safety and efficacy in Amazonian Amerindians. Sci Rep. 2019;9(1):1–8.
- Maisano Delser P, Fuselli S. Human loci involved in drug biotransformation: worldwide genetic variation, population structure, and pharmacogenetic implications. Hum Genet. 2013;132(5):563–577. doi:10.1007/s00439-013-1268-5
- Zhou Y, Ingelman-Sundberg M, Lauschke VM. Worldwide distribution of cytochrome P450 alleles: a meta-analysis of population-scale sequencing projects. Clin Pharmacol Ther. 2017;102(4):688–700. doi:10.1002/cpt.690
- Kozyra M, Ingelman-Sundberg M, Lauschke VM. Rare genetic variants in cellular transporters, metabolic enzymes, and nuclear receptors can be important determinants of interindividual differences in drug response. Genet Med. 2017;19(1):20–29. doi:10.1038/gim.2016.33
- Abecasis GR, Auton A, Brooks LD, et al.; Genomes Project C. An integrated map of genetic variation from 1092 human genomes. Nature. 2012;491(7422):56–65.
- Zhou S-F, Liu J-P, Chowbay B. Polymorphism of human cytochrome P450 enzymes and its clinical impact. Drug Metab Rev. 2009;41(2):89–295.
- Al-Eitan LN, Rababa’h DM, Hakooz NM, et al. Genetic polymorphisms of pharmacogenes among the genetically isolated Circassian subpopulation from Jordan. J Pers Med. 2020;10(1):2. doi:10.3390/jpm10010002
- Jaja C, Burke W, Thummel K, et al. Cytochrome p450 enzyme polymorphism frequency in indigenous and native American populations: a systematic review. Community Genet. 2008;11(3):141–149.
- Huo R, Tang K, Wei Z, et al. Genetic polymorphisms in CYP2E1: association with schizophrenia susceptibility and risperidone response in the Chinese Han population. PLoS One. 2012;7(5):e34809. doi:10.1371/journal.pone.0034809
- Relling MV, Klein TE. CPIC: Clinical pharmacogenetics implementation consortium of the pharmacogenomics research network. Clin Pharmacol Ther. 2011;89(3):464–467. doi:10.1038/clpt.2010.279
- Geisen C, Watzka M, Sittinger K, et al. VKORC1 haplotypes and their impact on the inter-individual and inter-ethnical variability of oral anticoagulation. Thromb Haemost. 2005;94(4):773–779.
- Askari B, Khaleqsefat E, Khalafkhani D, Khalaj-Kondori M, Khademvatan K, Soraya H. Study on a novel polymorphism in the VKORC1 promoter region using bioinformatic tools and warfarin dosing data. Thromb Res. 2017;158:76–78. doi:10.1016/j.thromres.2017.08.012
- Peng L. An overview of the seed origin myths of the Chinese Altaic language family ethnic group. J Hulunbuir Univ. 2021;29(3):143–148.
- Zhang H, De T, Zhong Y, Perera MA. The advantages and challenges of diversity in pharmacogenomics: can minority populations bring us closer to implementation? Clin Pharmacol Ther. 2019;106(2):338–349. doi:10.1002/cpt.1491